


Abstract
The conventional use of racial categories in health research naturalizes “race” in problematic ways that ignore how racial categories function in service of a White-dominated racial hierarchy. In many respects, racial labels are based on geographic designations. For instance, “Asians” are from Asia. Yet, this is not always a tenable proposition. For example, Afghanistan resides in South Asia, and shares a border with China and Pakistan. Yet, people from Afghanistan are not considered Asian, but Middle Eastern, by the US Census. Furthermore, people on the west side of the Island of New Guinea are considered Asian, whereas those on the eastern side are considered Pacific Islander. In this article, we discuss the complexity of the racial labels related to people originating from Oceania and Asia, and, more specifically, those groups commonly referred to as Pacific Islander, Middle Eastern, and Asian. We begin with considerations of the aggregation fallacy. Just as the ecological fallacy refers to erroneous inferences about individuals from group data, the aggregation fallacy refers to erroneous inferences about subgroups (eg, Hmong) from group data (ie, all Asian Americans), and how these inferences can contribute to stereotypes such as the “model minority.” We also examine how group averages can be influenced merely by the composition of the subgroups, and how these, in turn, can be influenced by social policies. We provide a historical overview of some of the issues facing Pacific Islander, Middle Eastern, and Asian communities, and conclude with directions for future research.
“The very act of defining racial group is a process fraught with confusion, contradiction, and unintended consequences.” – Omi and Winant2, p. 105
Introduction
Health researchers often use “race” categories in ways that ignore the complex process by which racial classification arises and ignores the systems of power that generate them. When we collect epidemiologic data with the intent of understanding racial health disparities, we are in danger of cyclically reproducing racial categories, the discursive stigma we attach to those categories, and the interventions that pathologize those groups. In this article, we focus specifically on the epidemiology of what is known as “Asian” or “Asian American” health. Of course, who constitutes “Asian” is socially and historically constructed—from South Asians to Southeast Asians, Native Hawaiians to East Asians, Central Asians to West Asians. However, much of our political and social discourse and demographic research on racial categories in the United States is influenced by the fixed, static, and ostensibly apolitical categorization of groups by Directive 15 from the US Office of Management and Budget (OMB), which provides standard classifications for the record keeping and presentation of data on race and ethnicity.1
Over history, the OMB categories have changed considerably.2,–4 It took nearly a century after the first Census for it to include any recognition of people from the Asian continent, with the addition of the “Chinese” category in 1870.5 Twenty years later, in 1890, an option for “Japanese” was added, followed by “Other” in 1910 and “Filipino,” “Korean,” and “Hindu” in 1920. Currently, the Census Bureau defines the Asian racial category as individuals “having origins in any of the original peoples of the Far East, Southeast Asia, or the Indian subcontinent including, for example, Cambodia, China, India, Japan, Korea, Malaysia, Pakistan, the Philippine Islands, Thailand, and Vietnam.”5 The category also includes people who self-identify as “Other Asian” or “provide other detailed Asian responses.” The changes in these categories over time point to the precariousness of racial classification, but health researchers largely remain steadfast in their conceptualizations of race.6
Beyond these geopolitical definitions, who identifies and who is identified as Asian is profoundly contentious. The term “Asian American” was originated during the Civil Rights movement by activists who intentionally created a general term to mobilize diverse persons facing common experiences of discrimination.7 However, over time, the idea of “Asian” narrowed despite the increasing diversification of national origin of Asians immigrating to the United States.4 Whereas immigration to the United States in the 1970s was primarily from East Asian countries, the fastest growing subgroup of Asians is now South Asians (eg, people from countries such as Bangladesh, Pakistan, and India).8 Yet, recent national surveys have shown that among both White and Asian Americans there is skepticism, or uncertainty, about whether Arabs, Middle Easterners, Indians, and Pakistanis are considered Asian or Asian American.8
The contradictions highlighted above reveal the fluidity with which both race as an idea and races as categories are formed. Omi and Winant refer to this fluidity as the process of establishing race as a “master category” in which “the establishment and reproduction of different regimes of domination, inequality, and difference in the United States have consciously drawn upon concepts of difference, hierarchy, and marginalization based on race”1,, p. 106 in a proposed theory of racial formation rooted in scholastic traditions of ethnic studies and critical social sciences. Places and races, as Omi and Winant contend, are neither static nor durable, but instead are dynamic and always being created. What race does, then, is “signify and symbolize social conflicts and interests by referring to different types of human bodies.”1,, p. 110 In this article, we reiterate that race is a concept that helps us perceive corporeal and phenotypic markers of difference and the social attitudes and practices that we then ascribe to these differences, as well as the interventional implications. By understanding this, we operate knowing that race is rooted in the need to fabricate difference to create power. To be sure, this is not to say that racial classification and categorization do not have material consequences. Decades of robust empirical scholarship in the social sciences and beyond have shown tangible differences in outcomes across racial categories.9,10 After all, racial capitalism has been argued to operate as a fundamental cause of health disparities, by producing material insecurities that shape these inequities.11,12 Instead, we intend to advance these conversations by unsettling our notions of race and interrogating how race is used to make and mark people, not the other way around.
We begin with a discussion about the broader process of inclusion and exclusion related to the idea of the aggregation fallacy. We then examine maps of Asia and Oceania to begin discussing the geographic origins of people within Pacific Islander and Middle Eastern racial/ethnic categories. We next provide an overview of issues and historical contexts related to these communities, including the role of Census logics. Because of limited space, this review will necessarily be incomplete and bounded by considerations of the US context. Finally, we conclude with some recommendations for future research, including a greater focus on perspectives from critical race scholars in other disciplines.
Aggregation fallacy
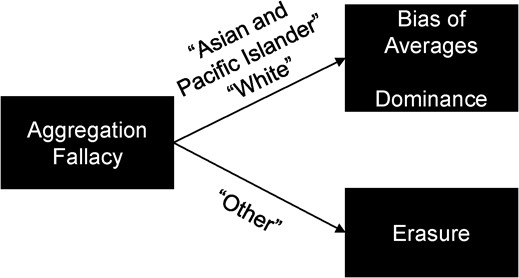
The aggregation fallacy is a variant of the well-known ecological fallacy, whereby a group mean (or median) is used to make inferences about individuals. The ecological fallacy is troubling when, for example, the average fine particulate matter (PM2.5) levels of a city are used as a proxy for individual exposures to these small particulates, which may be highly inaccurate. Moreover, it can be even more problematic when actions arise from such inaccurate inferences, such as the assumption that because the outdoor air quality is good, there is no need to intervene with respect to the air quality exposures for individuals. Analogously, the aggregation fallacy occurs when the group mean is used to make inferences about subgroups, such as when the mean for all Asian Americans is applied to subgroups (eg, Filipino Americans). This fallacy presents several problems (summarized in Figure 1). The first is most obvious, that the mean estimate does not represent the estimate for any given subgroup. But this underlies a more insidious process. The mean estimates for the aggregate contribute to a stereotype that Asians are a healthy and socioeconomically advantaged “model minority.”
Effects of the aggregation fallacy. A visual schematic of the effects of the aggregation fallacy on inferences made regarding the Asian, Native Hawaiian and Other Pacific Islander, and Middle Eastern populations.
To see this problem, Table 1 shows the statistics for various Asian and Native Hawaiian and Other Pacific Islander (NHOPI) subgroups for a selection of social and economic indicators from the 2019 American Community Survey 1-year estimates. We calculated a population-size weighted mean for each indicator so that each ethnic subgroup is represented in the mean estimate in proportion to its actual population size. We first multiplied the data for each ethnic subgroup by its proportional representation within the entire Asian and NHOPI population count and then summed the weighted data across subgroups to obtain a weighted mean estimate; thus, data of ethnic subgroups with a greater population size are weighted more than data of subgroups with a smaller population size. Consider the average median household income, which is $93 599 when data from all Asian and NHOPI subgroups are combined (we do not advocate for aggregating Asians and NHOPI subgroups together but do so here for illustration purposes). This estimate is higher than that of White Americans ($69 823), consistent with the model minority myth.13 Yet, in this estimate, only 3 of the Asian subgroups are above the mean, whereas 13 of the Asian subgroups fall below, and all of the 3 NHOPI subgroups are below the mean. This is why many Asian and NHOPI communities object to aggregated estimates—because they are inaccurate at the subgroup level.
Aggregation fallacy demonstration: sociodemographic characteristics of Asian American and Native Hawaiian and Other Pacific Islander subgroups in the United States, 2019.a
| Ethnic groupb | Population size | Total Asian and NHOPI population (%) | Population age ≥25 years with Bachelor’s degree or higher | Unemployed civilian labor force (%) | Households with food stamps/SNAP benefits (%) | Population without health insurance coverage (%) | Poverty rate | Foreign-born population (%) | Median household income ($) |
|---|---|---|---|---|---|---|---|---|---|
| Asian Indian | 4 240 466 | 23.24 | 75.7 | 2.4 | 3.5 | 5.2 | 5.9 | 70.9 | 126 705 |
| Chinese | 4 216 922 | 23.12 | 56.7 | 2.1 | 6.7 | 6.1 | 13.1 | 69.0 | 85 424 |
| Filipino | 2 983 596 | 16.35 | 49.8 | 2.6 | 5.7 | 5.5 | 5.8 | 64.5 | 100 273 |
| Vietnamese | 1 873 707 | 10.27 | 32.0 | 2.4 | 9.9 | 8.3 | 10.9 | 67.1 | 72 161 |
| Korean | 1 461 843 | 8.01 | 58.9 | 1.9 | 6.3 | 10.0 | 11.2 | 69.3 | 76 674 |
| Japanese | 755 672 | 4.14 | 53.7 | 1.6 | 2.0 | 2.8 | 7.3 | 41.4 | 85 007 |
| Pakistani | 506 193 | 2.77 | 59.8 | 2.4 | 9.3 | 8.4 | 12.6 | 63.7 | 87 509 |
| Hmong | 308 803 | 1.69 | 24.4 | 3.3 | 16.6 | 7.3 | 14.0 | 35.2 | 73 373 |
| Cambodian | 258 052 | 1.41 | 22.3 | 2.7 | 15.3 | 8.9 | 10.3 | 56.4 | 72 038 |
| Thai | 224 463 | 1.23 | 45.9 | 2.5 | 7.3 | 9.6 | 11.9 | 75.5 | 66 763 |
| Native Hawaiian | 198 734 | 1.09 | 19.4 | 4.3 | 21.9 | 7.8 | 18.4 | 3.5 | 62 272 |
| Bangladeshi | 198 628 | 1.09 | 49.1 | 2.7 | 16.0 | 8.4 | 18.1 | 73.2 | 67 944 |
| Laotian | 192 689 | 1.06 | 16.4 | 2.7 | 16.3 | 9.5 | 14.0 | 56.1 | 66 117 |
| Nepalese | 189 399 | 1.04 | 44.3 | 3.0 | 17.0 | 12.6 | 13.8 | 81.5 | 63 619 |
| Taiwanese | 187 756 | 1.03 | 78.8 | 1.4 | 1.4 | 4.9 | 8.8 | 67.1 | 102 405 |
| Burmese | 173 586 | 0.95 | 26.2 | 1.6 | 29.8 | 12.1 | 24.3 | 78.0 | 45 903 |
| Samoan | 112 845 | 0.62 | 15.2 | 4.3 | 21.1 | 13.6 | 12.5 | 34.8 | 67 573 |
| Indonesian | 81 269 | 0.45 | 55.8 | 3.8 | 4.2 | 9.9 | 8.9 | 72.8 | 93 501 |
| Guamanian or Chamorro | 78 323 | 0.43 | 20.2 | 1.9 | 12.9 | 9.4 | 15.3 | 5.7 | 72 722 |
| Weighted meansc | 54.9 | 2.3 | 7.0 | 6.6 | 9.7 | 65.5 | 93 599 | ||
| Reweighted meansd | 36.5 | 2.8 | 13.1 | 10.0 | 13.3 | 48.9 | 76 222 |
Abbreviations: NHOPI, Native Hawaiian and Other Pacific Islander; SNAP, Supplemental Nutrition Assistance Program.
a Statistics obtained from the US Census Bureau 2019 American Community Survey 1-year estimates.71
b Data of people who reported a single ethnic subgroup alone (eg, Asian Indian alone) and not in combination with 1 or more of the other ethnic subgroups.
c Weighted mean for each indicator was calculated by first dividing the population count for each ethnic subgroup by the entire Asian NHOPI population size to obtain a subgroup-specific population “weight,” multiplying the weight with the indicator data for each subgroup, and summing the weighted data across subgroups.
d Reweighted means were calculated by switching the proportional representation for each subgroup (ie, the weights) so that the numerically smallest group is weighted as the numerically largest (eg, data of Guamanians/Chamorros are weighted with the population proportion of Asian Indians; Indonesians have the population proportion of Chinese) and vice versa (eg, Asian Indians have the population size of Guamanians/Chamorros; Chinese have the population proportion of Indonesians).
Moreover, this fallacy contributes to and perpetuates the problem in 2 ways. First, it is not simply that the estimates are inaccurate but also that the estimates are used to make sweeping generalizations about all groups. Furthermore, because means (and, to a lesser extent, medians) are driven by the population size, our inferences are dominated by those of the numerically largest group. In this case, Asian Indians, Chinese, and Filipinos account for 63% of all Asians and NHOPI.
To illustrate this problem more clearly, Table 1 also provides a recalculation of the means, this time reweighting the data so that the ethnic group with the numerically smallest population size is weighted as the numerically largest (eg, Guamanians/Chamorros have the population size of Asian Indians) and vice versa (eg, Asian Indians have the population size of Guamanians/Chamorros), holding all other variables constant. The reweighted results illustrate that once the mean for each indicator was reweighted, the entire Asian and NHOPI population appears to have performed worse on the social and economic well-being indicators. For example, the weighted proportion of people in the Asian and NHOPI community with a Bachelor’s degree or higher dropped from 54.9% to 36.5% and the poverty rate rose from 9.7% to 13.3%. In aggregating data, the experiences of some subgroups overrepresent and dominate the narrative, whereas those of others are erased. Here, our assumptions of how a particular “race” performs on certain outcomes is partly a function of the ethnic subgroup population distribution of that group.
Our exercise is not merely academic. The size of any subgroup can be manipulated through legislation that has many implications. For example, these include federal policies on immigration and deportation. Health historian Emily Abel documented calls by public health officials to deport Filipino persons less than a century ago.14 More recently, former President Trump proposed deportations of some Chinese students15; should the United States create a policy of deporting Chinese persons or restricting their immigration, the statistics about the “average” Asian American could shift. Additionally, individuals may shift their identities for personal or political reasons. For example, research has documented that some Asian Americans do not identify as Asian but choose other signifiers (eg, “American” or “other”) because of feelings of marginalization and discrimination.16 At the same time, people from other racial/ethnic groups may sometimes identify with an Asian subgroup.17
Furthermore, immigration policy and selection bias skew our understanding of race. Consider people from India, who, in the United States, have the highest educational attainment and incomes of all Asian subgroups (Table 1). These 4.2 million Asian Indians do not represent the 1.4 billion people in India, a country classified by the World Bank as a lower-middle income economy. Since 1965, in tandem with US immigration policies that favor high-achieving students and skilled workers, India has selected its most privileged members of society to emigrate.18 What this means is that any inferences that Indian Americans have of an inherent biological or even cultural proclivity toward socioeconomic success must be tempered with a consideration of selection bias.19
Finally, the aggregation fallacy is discussed here with regard to Asians and NHOPIs, but a parallel argument is made for people who are of Middle Eastern ancestry who are often aggregated into the White category, a point we develop later in this article. We turn now to the discussion on maps and representation.
Race and geography
The social and political construction of race is strongly tied to geography. Starting in the 15th century, geographers played an instrumental role in manufacturing race and a racial hierarchy to establish systems of colonial power that made the Western world the dominant center, recognize its White inhabitants as superior, and justify the theft of land.20 Geography continues to be an integral part in race-making, in that a person’s membership in a racial category is often determined by where one has ancestral ties. However, the geographic scheme of racial categorization of Asian and Oceanian countries is the legacy of multiple political and historical processes, including colonialism, imperialism, war, migration, and sociocultural beliefs, such as religious superiority.4 Omi and Winant’s theory of racial formation states that the content and importance of racial categories shift depending on the social and political conditions of a certain time and place and is used to ascribe racial meanings to organize society according to a racial hierarchy.1 The inconsistencies with racial designations of people from Asian and Oceanian countries throughout history demonstrates race-making as a political project that is frequently contested and renegotiated to reorganize and redistribute rights and resources.1
Figure 2 displays a map of the countries in Asia and Oceania, color-coded to show the racial classification of people with ancestral ties to a particular country based on the most recent US Census Bureau OMB standards. Table 2 lists these countries along with their regional classification as outlined by different governmental organizations. The map in Figure 2 shows that although the official categorizations of Asian and Pacific Islander bear some resemblance to geographic boundaries of the world continents, these categories are imperfect. Notably, 31% of the 71 countries on the continent of Asia would be classified as “White” per the Census (Table 2). These would include countries such as Turkey, Iran, and Yemen. Furthermore, Oceania comprises Micronesia, Melanesia, Polynesia, Australia, and New Zealand, but people from the latter 2 countries are considered White. Just as interesting, on the island of New Guinea, those residing on the western side (ie, Papua) are considered Asian, but those residing on the eastern side (ie, Papua New Guinea) are considered Pacific Islander. Furthermore, the variation by which the United States and other global organizations classify countries into regions of the world also showcases the political construction of both geographic boundaries and racial identities. For example, Australia is considered “Oceania,” “East Asia and Pacific,” and “Southeast Asia and Pacific” by the United Nations, World Bank, and the United States, respectively, yet people from Australia are considered “White” by the OMB.
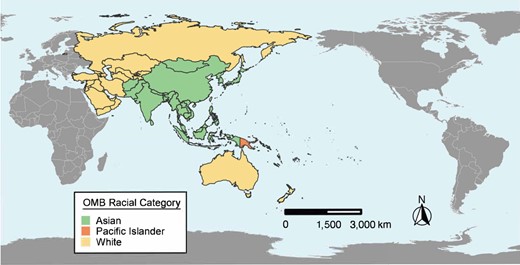
Map of the racial categorization of countries in Asia and Oceania. Map of the countries in Asia and Oceania and their racial categorization according to the US Census Bureau Office of Management and Budget (OMB) Standards, 2020.79
Countries in Asia and Oceania and their region classification and racial categorization.
| Country | US census OMB standards racial categorya | UN region classificationb | World Bank region classificationc | US trade representative region classificationd |
|---|---|---|---|---|
| Bangladesh | Asian | Southern Asia | South Asia | South Asia |
| Bhutan | Asian | Southern Asia | South Asia | South Asia |
| Brunei | Asian | Southeast Asia | East Asia and Pacific | Southeast Asia and Pacific |
| Cambodia | Asian | Southeast Asia | East Asia and Pacific | Southeast Asia and Pacific |
| China | Asian | Eastern Asia | East Asia and Pacific | East Asia |
| India | Asian | Southern Asia | South Asia | South Asia |
| Indonesia | Asian | Southeast Asia | East Asia and Pacific | Southeast Asia and Pacific |
| Japan | Asian | Eastern Asia | East Asia and Pacific | East Asia |
| Laos | Asian | Southeast Asia | East Asia and Pacific | Southeast Asia and Pacific |
| Malaysia | Asian | Southeast Asia | East Asia and Pacific | Southeast Asia and Pacific |
| Maldives | Asian | Southern Asia | South Asia | South Asia |
| Mongolia | Asian | Eastern Asia | East Asia and Pacific | East Asia |
| Myanmar | Asian | Southeast Asia | East Asia and Pacific | Southeast Asia and Pacific |
| Nepal | Asian | Southern Asia | South Asia | South Asia |
| North Korea | Asian | Eastern Asia | East Asia and Pacific | East Asia |
| Pakistan | Asian | Southern Asia | South Asia | South Asia |
| Philippines | Asian | Southeast Asia | East Asia and Pacific | Southeast Asia and Pacific |
| Singapore | Asian | Southeast Asia | East Asia and Pacific | Southeast Asia and Pacific |
| South Korea | Asian | Eastern Asia | East Asia and Pacific | East Asia |
| Sri Lanka | Asian | Southern Asia | South Asia | South Asia |
| Taiwan | Asian | Eastern Asia | East Asia and Pacific | East Asia |
| Thailand | Asian | Southeast Asia | East Asia and Pacific | Southeast Asia and Pacific |
| Timor-Leste | Asian | Southeast Asia | East Asia and Pacific | Southeast Asia and Pacific |
| Vietnam | Asian | Southeast Asia | East Asia and Pacific | Southeast Asia and Pacific |
| American Samoa | Pacific Islander | Polynesia | East Asia and Pacific | Pacific Islands |
| Cook Islands | Pacific Islander | Polynesia | East Asia and Pacific | Pacific Islands |
| Fiji | Pacific Islander | Melanesia | East Asia and Pacific | Pacific Islands |
| French Polynesia | Pacific Islander | Polynesia | East Asia and Pacific | Pacific Islands |
| Guam | Pacific Islander | Micronesia | East Asia and Pacific | Pacific Islands |
| Kiribati | Pacific Islander | Micronesia | East Asia and Pacific | Pacific Islands |
| Marshall Islands | Pacific Islander | Micronesia | East Asia and Pacific | Pacific Islands |
| Micronesia | Pacific Islander | Micronesia | East Asia and Pacific | Pacific Islands |
| Nauru | Pacific Islander | Micronesia | East Asia and Pacific | Pacific Islands |
| New Caledonia | Pacific Islander | Melanesia | East Asia and Pacific | Pacific Islands |
| Niue | Pacific Islander | Polynesia | East Asia and Pacific | Pacific Islands |
| Northern Mariana Islands | Pacific Islander | Micronesia | East Asia and Pacific | Pacific Islands |
| Palau | Pacific Islander | Micronesia | East Asia and Pacific | Pacific Islands |
| Papua New Guinea | Pacific Islander | Melanesia | East Asia and Pacific | Pacific Islands |
| Samoa | Pacific Islander | Polynesia | East Asia and Pacific | Pacific Islands |
| Solomon Islands | Pacific Islander | Melanesia | East Asia and Pacific | Pacific Islands |
| Tonga | Pacific Islander | Polynesia | East Asia and Pacific | Pacific Islands |
| Tuvalu | Pacific Islander | Polynesia | East Asia and Pacific | Pacific Islands |
| Vanuatu | Pacific Islander | Melanesia | East Asia and Pacific | Pacific Islands |
| Afghanistan | White | Southern Asia | South Asia | South Asia |
| Armenia | White | Western Asia | Europe and Central Asia | Eurasia (Caucasus region) |
| Australia | White | Oceania | East Asia and Pacific | Southeast Asia and Pacific |
| Azerbaijan | White | Western Asia | Europe and Central Asia | Eurasia (Caucasus region) |
| Bahrain | White | Western Asia | Middle East and North Africa | Middle East |
| Cyprus | White | Western Asia | Europe and Central Asia | Europe |
| Georgia | White | Western Asia | Europe and Central Asia | Eurasia (Caucasus region) |
| Iran | White | Southern Asia | Middle East and North Africa | Middle East |
| Iraq | White | Western Asia | Middle East and North Africa | Middle East |
| Israel | White | Western Asia | Middle East and North Africa | Middle East |
| Jordan | White | Western Asia | Middle East and North Africa | Middle East |
| Kazakhstan | White | Central Asia | Europe and Central Asia | Central Asia |
| Kuwait | White | Western Asia | Middle East and North Africa | Middle East |
| Kyrgyzstan | White | Central Asia | Europe and Central Asia | Central Asia |
| Lebanon | White | Western Asia | Middle East and North Africa | Middle East |
| New Zealand | White | Oceania | East Asia and Pacific | Southeast Asia and Pacific |
| Oman | White | Western Asia | Middle East and North Africa | Middle East |
| Qatar | White | Western Asia | Middle East and North Africa | Middle East |
| Russian Federation | White | Eastern Europe | Europe and Central Asia | Eastern Europe |
Continued
| Country | US census OMB standards racial categorya | UN region classificationb | World Bank region classificationc | US trade representative region classificationd |
|---|---|---|---|---|
| Saudi Arabia | White | Western Asia | Middle East and North Africa | Middle East |
| State of Palestine | White | Western Asia | Middle East and North Africa | Middle East |
| Syria | White | Western Asia | Middle East and North Africa | Middle East |
| Tajikistan | White | Central Asia | Europe and Central Asia | Central Asia |
| Turkey | White | Western Asia | Europe and Central Asia | Europe |
| Turkmenistan | White | Central Asia | Europe and Central Asia | Central Asia |
| United Arab Emirates | White | Western Asia | Middle East and North Africa | Middle East |
| Uzbekistan | White | Central Asia | Europe and Central Asia | Central Asia |
| Yemen | White | Western Asia | Middle East and North Africa | Middle East |
Abbreviations: OMB, Office of Management and Budget; UN, United Nations.
a US OMB standards racial classification.72
b UN region classification according to UN M49 or the standard country or area codes for statistical use (Series M, No. 49) managed by the UN Statistics Division.73
c World Bank country classification.74
d Country and region classification according to the Office of the US Trade Representative.75
It is also important to highlight who is not represented in the map, such as people with ties to Aboriginal communities in colonized countries like Australia and New Zealand. The erasure of these communities reflects ongoing processes of settler colonialism fundamental to the histories of many Asian and Oceanian countries.21 Settler colonialism is a distinct mode of colonialism that operates through the replacement of Indigenous populations with “an invasive settler society that, over time, develops a distinctive identity and sovereignty.”22 Colonial powers like the British Empire first occupied and sought political control over the land and people of countries in Asia and Oceania to expand trade routes and opportunities, as well as extract and exploit natural resources for the purposes of economic domination. Afterward, those objectives were supplanted with goals to permanently settle and constitute a new regime in these lands.21 Consequently, European settlers began tying race and place together through dehumanizing narratives to justify the expropriation of Aboriginal communities and Indigenous populations. For example, a prevailing notion in mid-15th to mid-20th century Christian European society was that lands outside of Europe were terra nullius, meaning “lands belonging to nobody,” or more specifically, lands not inhabited by Christians.23 This principle was used to claim Australia under a “doctrine of discovery,” in that Australia was seen as uncultivated and inhabited by uncivilized people and thus could be lawfully claimed by British settlers.23 The dispossession and forced assimilation of Indigenous populations into settler societies like those in Australia and New Zealand rendered Indigenous identities invisible, erased the heterogeneity of distinct Indigenous communities and cultures, and eliminated their right to self-determination. The story of Aboriginal communities in Oceania countries further demonstrates how racial and spatial designations are transformed to organize power and rights along fabricated racial lines.24
The political project of racial categorization has led to considerable debates and reformulations regarding the concept of race and political representation that have had notable ramifications on the health and well-being of racialized people. The following sections provide more specific conversations on the sociopolitical and health issues facing Pacific Island and Middle Eastern people in the United States. To guide this discussion, we display the general sociodemographic and health characteristics of these groups, as well as a comparative group called “Asian,” in Table 3.
Sociodemographic and health characteristics of Asian, Native Hawaiian and Other Pacific Islander, and Middle Eastern people in the United States.
| Sociodemographic and health characteristics, % | Asian | Native Hawaiian and Other Pacific Islander | Middle Eastern |
|---|---|---|---|
| Demographicsa | |||
| Population aged ≥25 years with Bachelor’s degree or higher | 51.4 | 15.3 | 55.7 |
| Unemployed civilian labor | 6.6 | 12.2 | 8.6 |
| Households with food stamps/SNAP benefits | 7.6 | 21.4 | 11.6 |
| Poverty rate | 12.6 | 21.0 | 19.7 |
| Foreign-born population | 66.5 | 21.2 | 44.2 |
| Household income ($)b | 74 245 | 52 936 | 61 263 |
| Population without health insurance coverage | 12.5 | 15.4 | 13.7 |
| Population with a disability | 6.7 | 10 | 6.4 |
| Mortality (age-adjusted death rate per 100 000 people)c | |||
| All causes | 372.8 | 679.0 | |
| Diseases of the heart | 79.2 | 168.5 | |
| Cerebrovascular diseases | 29.3 | 50.9 | |
| Malignant neoplasms | 90.4 | 141.2 | |
| Diabetes mellitus | 15.7 | 41.9 | |
| Alzheimer’s disease | 15.9 | 16.3 | |
| Unintentional injuries | 16.0 | 33.1 | |
| Suicide | 6.7 | 14.4 | |
| COVID-19d | 61.9 | 189.2 | |
| Health indicators among the adult populatione | |||
| Fair or poor health | 9.3 | 18.5 | |
| Obesity | 10.3 | 38.9 | |
| Diagnosed hypertension | 19.7 | 28.0 | |
| Diagnosed diabetes | 9.0 | 25.5 | |
| High cholesterol | 17.0 | 17.3 | |
| Experiences of serious psychological distress in the past year | 9.0 | 10.1 |
Abbreviation: SNAP, Supplemental Nutrition Assistance Program.
a Statistics obtained from the US Census Bureau, 2015–2019 American Community Survey 5-year estimates.76
b Values are expressed as median.
c Values represent age-adjusted death rate per 100 000 people.77 Note that the Centers for Disease Control and Prevention does not collect disaggregated data for the Middle Eastern population in the United States.77
d Value represents the provisional COVID-19 age-adjusted death rates from 2020–2021.78
e Values represent percentage of adults aged ≥18years.77
Pacific Islanders
Pacific Islanders are people who have ancestral ties to any of the islands of Melanesia (eg, Fiji, Vanuatu), Micronesia (eg, Guam, the Federated States of Micronesia, the Marshall Islands, Palau), and Polynesia (eg, Samoa, Tonga, Hawai’i).25 The broad and inclusive term “Pacific Islander” stems from the creation and use of the racial NHOPI category in the US Census. Pacific Islanders have had a controversial history of conflict with the United States, marked by structural racism and violence deeply rooted in colonialism, imperialism, and exploitation that have further exacerbated social, economic, and health inequities.26,27 Thus, it is critical to acknowledge Pacific Islanders’ diversity in culture, languages, history, and perspectives.
History and mobilization to create a Pacific Islander category
The racial categorization of Pacific Islanders in the United States resulted in ongoing systemic and structural issues. Early Europeans arrived in the Pacific Islands and noted similarities and distinctions among native residents’ culture, language, geography, and characteristics.28 To make sense of this diversity, in the 1830s, Dumont d’Urville, a French colonizing explorer, proposed to partition the Pacific Islands into 3 geographic regions known as Melanesia, Micronesia, and Polynesia.29 This division was based primarily on a racialized hierarchy,30 whereby individuals with a lighter complexion, or Polynesians, were ranked at the top of this racialized framework, followed by Micronesians, and then individuals with a darker complexion, or Melanesians.31 This geo-racial order, which is still used by researchers today, was created without input from those who have ancestral ties to the Pacific Islands. In turn, research focusing on Pacific Islanders further perpetuates a racial hierarchy that upholds White supremacy by erasing how people who identify with indigenous ancestry from these islands form their own identities.
Despite knowledge of these historical complexities, the US government’s conceptualization of Pacific Islander identity remains incomplete. In fact, although the first US Census was conducted in 1790, Pacific Islanders were not represented until the 1960s. The initial inclusion of Pacific Islanders in the US Census included racial categories for only “Hawaiian” and “Part-Hawaiians.” In 1970, the US Census aggregated both the Hawaiian and Part-Hawaiians categories into “Hawaiian,” which remained the only Pacific Islander group listed. “Samoan” and “Guamanian” racial classifications were added to the US Census in 1980; no additional boxes were included to represent individuals from Melanesia or Micronesia.
In 1990, the US Census collapsed the “Asian Pacific Islander” classification into a single racial category and included a section to specify a specific Pacific Islander group,32 which evoked backlash from Asian American and Pacific Islander communities and advocates. In response to some of these issues, in 1997, the US OMB released a revised set of racial and ethnic standards for the US Census Bureau and federal data entities to use as a way to adequately reflect the nation’s diverse and growing population.3 The following 3 significant revisions were implemented: (1) disaggregating the Asian Pacific Islander category, (2) changing “Hispanic” to “Hispanic or Latino,” and (3) allowing for the self-selection of more than 1 racial category (a result of extensive effort on behalf of these community members, especially Pacific Islanders). These advocacy efforts led to the initial recognition of the NHOPI racial category, which was included finally in the 2000 US Census. The OMB Directive defines the NHOPI racial category as “a person having origins in any of the original peoples of Hawaii, Guam, Samoa, or other Pacific Islands.”3 The NHOPI racial category comprises more than 12 subgroups based on self-reporting and self-identification.
Still today, federal, state, and local agencies continue to lump these groups into a single race category, rendering invisible health concerns and disparities among Pacific Islander sub-ethnic groups.33 Such erasure continues to present challenges in addressing community-specific needs, for instance, including allocating resources during public health emergencies.34
Pacific Islander health profile
Current data regarding health status among Pacific Islanders in the United States are constrained due to limited studies and inconsistent categorization attributable to the lack of consistent collecting and reporting of disaggregated Pacific Islander data and aggregation of Pacific Islander and Asian American data.35 This variability makes comparable findings in health research difficult, restricting understanding of the existing health disparities in this population. Thus, researchers, health care providers, and policymakers continue to underestimate risk and misrepresent the health needs of Pacific Islanders.
There are nearly 1.6 million Pacific Islanders alone or in combination of 1 or more races who live in the United States. Native Hawaiians make up the most significant proportion of Pacific Islanders, followed by Samoans, Chamorros, Tongans, and Fijians.36 It is essential to recognize that additional Pacific Islander groups reside in the United States, although they are not fully captured, because of limited population size. At 80.8 years for newborns, 83.2 years for women, and 78.5 years for men, the average life expectancy projections for Pacific Islanders appears slightly longer than for non-Hispanic Whites.37 However, Pacific Islanders face disproportionate levels of social inequities such as high poverty levels and limited access to health care coverage, which have resulted in health inequities.38 Pacific Islanders have high rates of smoking, diabetes, and obesity.39 The leading causes of death for Pacific Islanders include cardiovascular disease, cancer, and stroke.27 Overall, the social and health imbalances Pacific Islanders encounter are a manifestation of the long-standing history of colonialism and oppression.
Systematic changes to improve our understanding of health trends among Pacific Islanders are long overdue. At a minimum, there is a critical need to refine existing racial classifications, even if this may result in small sample sizes. The potential limitations that may arise due to small sample sizes can be addressed by oversampling and collecting data over time.
Middle Easterners
A heterogeneous and growing community that underscores the prevalence and influence of racial formation in the United States comprises people identifying as Middle Eastern and remain miscategorized by the Census within the “White” category. Yet, there is evidence that Middle Easterners do not identify as White and that a large proportion of non-Hispanic White Americans do not categorize Middle Eastern or North Africans (MENA) as White.40 The racial categorization of MENA communities is rooted in the history of racist immigration policies as early as the US Naturalization Law in 1790. On the basis of these exclusionary naturalization laws against those deemed non-White, the first immigrants from the Middle East emphasized their proximity to Whiteness as the most viable strategy for becoming citizens.41 The ongoing racialization and systematic marginalization of Middle Eastern communities has persisted throughout US history and escalated in the post–September 11, 2001 (hereafter, 9/11) context.42
The definitions and boundaries of the Middle East have varied over time and according to whom one asks.43 The term itself is contentious, given its Eurocentric roots from the 19th century as an attempt to differentiate India and “Far East” and to replace the term “Near East,” thereby encouraging the adoption of other labels including “West Asia,” “Southwest Asia,” or “Central Asia” to more accurately depict the vast region.44,45
A case study of Syrian Americans
For the purposes of this case study on the political construction of the “Asian” identity, we will explicitly focus on the Middle East and not the North African experience or component of MENA. The Middle East encompasses a richly diverse region in terms of ethnicity, religion, language, and culture. Here, we highlight the Syrian experience as a case study of how racial classification fluctuates over time and varies across individuals and the sociopolitical context. Beginning in the late 1870s, immigrants who were predominantly Christian arrived in the United States from the then–Muslim Ottoman empire that included present-day Lebanon, Palestine, and Syria.46 In 1899, the government reclassified persons from the Levant as “Syrians” as a strategy to differentiate them from Greeks, Turks, and Armenians.46 In that same year, the US Bureau of Immigration assigned Syrians and Palestinians to the then-Caucasian category, which facilitated their naturalization process.47 However, by 1909, as a result of growing anti-immigrant sentiment that specifically targeted non-Christian and non-Europeans, those categorized as Syrians were renamed “Mongoloids.”47 Syrians were now, once again, faced with a challenge of redefining their racial affiliation, and proximity to Whiteness, to secure citizenship.
From 1909 to 1915, court cases extended citizenship to some Syrians on the basis of the claim that they were “White Asians” or “Caucasians,” and at the same time, other cases were rejected on the basis of the decision that some Syrians were “non-White Asians.”47 A key factor driving courts’ decisions on citizenship was based on religious affiliation.41 Cases granted citizenship extended exclusively to Christian Syrians, thereby signaling how far back anti-Muslim racism has prevailed in the US legal and social discourse.46 A landmark case in 1914 took place when a Syrian, George Dow, was denied citizenship (twice) because of the court’s decision that the color of his skin deemed him as “Asiatic.”48 Dow appealed this decision in 1915 and won on the basis of his claim that he shared the same homeland as Jesus Christ, as well as the court’s decision that Syrians “were so closely related to their neighbors on the European side of the Mediterranean that they should be classed as white, they must be held to fall within the term ‘white persons’ used in the status.”47 This case, Dow v United States, resulted in a legal distinction between persons from the Middle East eligible for citizenship and the other groups from the Asian continent (ie, persons not deemed White) that Congress was strategizing to exclude.48 This case exemplifies how perceptions of race can (re)define geographic boundaries and also illustrates the ongoing racialization of religion, because it exclusively broadened eligibility to citizenship to Christian Middle Easterners. Muslims from the Middle East would not be eligible for citizenship until approximately 30 years later.
History and mobilization to create a MENA category
In 1977, the OMB categorized persons from the Middle East and North Africa as White. However, over time, community advocates and scholars have mobilized to challenge this classification only to be faced with ongoing political resistance. In 2010, the “Check it Right, You Ain’t White” movement among Arab and Middle Eastern communities was launched to support the creation of a MENA category. And in the 2010 Census, more than 1 million people of MENA origins selected the “some other race” classification.49 These efforts and increasing empirical research led to examining the inclusion of the MENA category in the 2015 National Content Test. The results indicated that MENA provided a more accurate response option for individuals to identify with and this evidence influenced the Census Bureau to support the inclusion of the MENA category in the 2020 Census.50 Yet, the OMB rejected adding this category to the Census during the Trump administration. Recently, the Biden administration declared the inclusion of the MENA category is considered viable for both the American Community Survey as well as the 2030 Census.51 This policy proposal would come over a decade later than a student-led initiative that included “Southwest Asian/North African” in the University of California undergraduate admissions applications that broadened the Census’ definition of Middle Easterners to include Afghans and Armenians.
MENA health profile
The MENA community in the United States is recently estimated to exceed approximately 4 million individuals.50 The systematic erasure of MENA communities from the Census and other traditional epidemiologic data sets, reflected in Table 3, has led some health-disparities scholars to assert that these communities reside in “a state of demographic purgatory.”50 Another challenge in documenting trends and patterns among this group is the heterogeneous composition of these communities including US-born individuals, immigrants from affluent countries, as well as refugees from countries plagued with ongoing war and economic crises, multiple religions, and a range of socioeconomic indicators,52 all of which underscore the need for an intersectional approach when examining outcomes. Much of the epidemiologic data, albeit limited and largely based on community samples, focus on Arab Americans, a linguistically, ethnically, and religiously diverse community with origins from 1 of the 22 Arab League countries.50 Another methodological challenge is that Arab Americans may be reluctant to participate in health research, given heightened levels of discrimination and governmental surveillance, both of which result in mistrust of research-oriented data collection efforts. Nonetheless, there is a growing body of research documenting the disparate outcomes relative to the non-Hispanic White group and the distinction between Arab Americans and more commonly reported patterns among other immigrant groups.41,53
Persons identifying as MENA continue to experience elevated rates of discrimination as a result of multiple forms of racism and stigma, including xenophobic sentiments toward immigrant and refugees. Levels of discrimination and stigma have increased in the post-9/11 context, as made evident with the introduction of the Muslim Ban in 2017.41 However, rates vary by religion; Muslim Arab Americans report higher levels of discrimination than do their Christian counterparts.52 Both 9/11 and the Muslim Ban are associated with increased risk of adverse birth outcomes, including low birth weight.54 Anti-Arab sentiment is associated with an increase in psychological distress and feelings of isolation and unhappiness among this group.53 An online study found that 50% of Arab Americans met criteria for depression.55 Despite these initial findings, prevalence rates of mental health outcomes remain largely understudied in these communities. Furthermore, authors of 1 of the first literature reviews on chronic health conditions among Arabs reported disproportionate rates of diabetes, hypertension, and obesity relative to their non-Hispanic White counterparts.53
Emerging reports have also shed light on the elevated risk of contracting COVID-19 among Arab Americans. Potential explanations for this include lower vaccination rates relative to non-Hispanic Whites, lower levels of social support, and elevated levels of xenophobia and social marginalization.56 Moreover, a recent national study, the Survey of Arab Health in America, reported that being female, having higher levels of religiosity, and reporting a lower annual household income are associated with less likelihood of receiving a COVID vaccination.57 The sex disparity in this recent study is aligned with findings of prior work suggesting that Arab American women have lower vaccination rates and preventive health care behavior than non-Arab women.56
Despite being systematically targeted and oversurveilled in governmental programs with the intention to criminalize affiliation with MENA communities, these communities simultaneously remain invisible in nationally representative epidemiologic data sets.58
Implications for public health research and practice
Quantitative researchers often like to say “let the data speak for themselves,” and conventional approaches to epidemiology and medicine have reinforced this simplistic habit. But data are interpreted by people, and research is not conducted in a social vacuum; therefore, debates over racialized political recognition and rights are inevitably embedded in the production and interpretation of data. For example, as our reweighting exercise shows, the inferences about Asian statistics can shift based simply on the composition or population distribution of subgroups, and the latter is a function of social and political forces. Rodríguez-Muñiz argues that statistics on racial groups, known as “ethnoracial statistics,” have been leveraged by political actors to establish and rationalize the distribution of resources and rights.59 In particular, ethnoracial statistics legitimize political abstractions to endorse “a way of thinking and enacting race in numerical, aggregate terms.”59,, p. 280 What ethnoracial statistics do in the absence of historical context is reify processes of racial classification that do not adhere to the social reality of being of a certain race in a certain time and of a certain place. As our study demonstrates, health research has relied on what ethnic studies scholars call “logics of sorting, ranking, and comparison that produce and naturalize categories of racial difference necessary for the legitimation of slavery, settler colonialism, and imperial expansion.”60, p. 3 Consequently, how are we to capture the experiences of racialization without reproducing racialization and racial hierarchy in service of White supremacy? The answers to this question lie in the power of critical researchers invested in a new epistemology of public health. To minimize some harms implicated in the inherent reproduction of racial hierarchy, such as aggregation fallacy, our recommendations for future research are, at minimum, given in the following discussion.
Researchers must be explicit about the assumptions made when categorizing groups and the limitations of these decisions, including the assumption that racial categories are discrete, bounded, and independent of spatial and temporal contexts. By continuing to use convenient racial categories, such as Directive 15, our scholarship is at risk of reproducing a White scientific gaze that decenters and remarginalizes community knowledge.61 For example, as we demonstrate in this article, the racial/ethnic labels of African American, Asian American, Alaska Native, Hispanic, Native American, Native Hawaiian and other Pacific Islander, and White are glaringly insufficient.
To subvert these harmful limitations, in all stages of research—from building the epistemological frameworks we use to shape research questions and design to collecting and analyzing data and to deriving subsequent conclusions and interventions—we must center voices at the margins by redistributing power to communities whose stories we purport to convey.62 Research that is community-led and conducted in partnership with researchers can help temper the existing problems and provide labels that may more accurately reflect the realities, pains, inspirations, dreams, and reflections of the populations being studied. For example, researchers may consider collecting a range of identity subgroups, including open-ended write-in sections in questionnaires to allow respondents to provide identities that may not conform with the labels provided. Although this recommendation seems simplistic and straightforward, a surprisingly large number of data systems still only have limited options for the reporting of race and ethnicity. Additionally, in a recent study, the term “African descendant” was used instead of “Black,” “African American,” and other descriptors, because the collaborators wanted to be inclusive and respectful of the communities engaged.63 We can also take a page from other disciplines’ innovative methodologies. A recent qualitative study from critical education scholars, for instance, investigated how Asian American and Chicanx college students consider the ways their relative ethno-racialization shapes their understandings of inequality and opportunity and vice versa.64 Such an eye to the experiences of the cyclicality of racialization, racism, and their material consequences can begin to move our role as researchers away from that of curator to purveyor of health equity.61
Moreover, health equity research needs to situate analyses within historical and geographic contexts. We have shown that the geopolitical boundaries play a key role in racialization. Studies are increasingly attending to these issues by studying disparities across smaller geographic units (eg, census tracts), but these analyses are often not contextualized in the local histories that explain how these places (and, therefore, races) came to be.65 By remaining ahistorical in our place-based analyses, we restigmatize and pathologize places.66
Garnering such historical contexts requires expertise and training. To facilitate this, public health training programs must commit to (1) a transdisciplinary curriculum that integrates departments such as history, ethnic studies, and public policy; and (2) embedding a critical perspective throughout the pedagogic fabrics of their curriculum and institutional practices that seeks to reverse the historical misuse of the role of power and privilege in the production, dissemination, and use of knowledge.67
Conclusion
Although many have recognized that race is constructed and adapted to sociopolitical needs, much health research continues to naturalize these categories. Although the conceptualizations of race have long been contested in other social sciences, epidemiologic research has yet to fully take seriously the notion that racial labels have reproduced a social order in service of White supremacy. This racial hierarchy is problematic, but it can help us, so long as we reject ahistoricism, advance research with stories of how these places came to be, and show how social groups have been uniquely racialized on the global front. If we see disparities across nationalities in certain outcomes, the danger lies in continuing to attribute disparities to nationality, to essentializing the biology of a people from a certain nation. As demonstrated in our case studies in this article, even our attempts to unsettle notions of race lead us back to making assumptions about what race is. However, we argue that appreciating the nuances across units of time and place can lead to richer historical, localized analyses and truths. Perhaps by adopting a more relational framework, we can study race as “co-produced and co-constitutive, and always dependent on constructions of gender, sexuality, labor, and citizenship.”60,, p. 3 By doing so, we respond to what Jean Kim has called for in a new “sociometry of race”68 to more fully recognize the unstable and shifting ladder through which groups of people of a certain “race” make race relationally. In short, we seek to advance Thomas LaVeist’s call to move “beyond dummy variables”69 in our research to more fully grasp the power relationships that shape health inequities. And, of course, we advocate for our work as a sort of middle word, and we invite scholars who are struggling with the same questions and challenges at this moment to join us.70
In this article, we have provided examples of how epidemiology may begin to unravel these complicated, local, and intersectional histories across time and space in ways that enrich our understanding of how, exactly, race affects health. In particular, our analyses and recommendations highlight a unique perspective for this issue, highlighting the difficulties faced by people who are regarded as Asian, Pacific Islander, and Middle Eastern.
Supplementary data
Supplementary data are available at Epidemiologic Reviews online.
Funding
G.C.G. is supported by funding from National Institutes of Health (grants R01MD012755 and R01HD083574). We are grateful to the California Center for Population Research (CCPR) at the University of California, Los Angeles, for general support. CCPR receives population research infrastructure funding (grant P2C-HD041022) from the Eunice Kennedy Shriver National Institute of Child Health and Human Development (NICHD). The content is solely the responsibility of the authors and does not necessarily represent the official views of the NICHD or the National Institutes of Health.
Conflict of interest
The authors declare no conflicts of interest.
Disclaimer
The views expressed in this article are those of the authors and do not reflect those of the National Institutes of Health.
Data availability statement
Not applicable.
