


Abstract
Although the literature on the differences between Black people and White people in terms of differences in major depressive disorder and related self-reported symptoms is robust, less robust is the literature on how these outcomes are patterned within the US Black population and why differences exist. Given increased ethnic diversity of Black Americans due to increases in immigration, continued aggregation may mask differences between Black ethnic-immigrant groups and Black Americans with more distant ancestral ties to Africa (African Americans). The purpose of this narrative review was to comprehensively synthesize the literature on depression and related symptoms within the US Black population across immigration- and ethnicity-related domains and provide a summary of mechanisms proposed to explain variation. Findings revealed substantial variation in the presence of these outcomes within the US Black population by nativity, region of birth, age at immigration, and Caribbean ethnic origin. Racial context and racial socialization were identified as important, promising mechanisms for better understanding variations by region of birth and among those born or socialized in the United States, respectively. Findings warrant data collection efforts and measurement innovation to better account for within-racial differences in outcomes under study. A greater appreciation of the growing ethnic-immigrant diversity within the US Black population may improve understanding of how racism differentially functions as a cause of depression and related symptoms within this group.
Introduction
Across nationally representative studies of diagnostic psychiatric disorders, the prevalence of major depressive disorder (MDD) is markedly lower among Black Americans relative to White Americans.1,–5 This finding is inconsistent with observed racial patterns in self-reported measures of depressive symptoms and psychological distress.6 Between-racial patterns of MDD are also inconsistent with theories of social stress, the predominant framework linking social status to mental health, positing individuals with disadvantaged social statuses are exposed to more stressors than those of advantaged social statuses, and such stress exposure leads to worse mental health.7,–9 Consequently, numerous investigations have sought to explain this apparent, paradoxical between-racial pattern.6,10,–14 Although the literature on between-group differences between Black people and White people in terms of depression and related self-reported symptoms is robust, fewer investigations have explored potential heterogeneity within the US Black population.
Aggregating the US Black population is standard practice in health research, despite increased ethnic diversity due to increasing numbers of Black immigrant populations. As of 2019, an estimated record 4.6 million Black immigrants live in the United States, nearly double the population since 2000.15 Although Black immigrants in the United States come from several regions, nearly half were born in the Caribbean and 42% were born in sub-Saharan Africa.15 Also as of 2019, 12% of the Black population were foreign-born immigrants, and an additional 9% were second-generation (ie, those with at least 1 foreign-born parent).16 Increasing numbers of both first- and second-generation immigrants signify increasing ethnic diversity within the US Black population. Despite this growing diversity, Black ethnicities, nativity, and immigrant generation status are rarely studied in health research.17,–21 Instead, in both US public discourse and in health research, “African American” is often used interchangeably with Black, yet the former refers to an ethnic group and the latter to a racial category. African American typically refers to Black Americans with distant ancestral ties (ie, more than 3 generations removed) to Africa,22 nearly all being descendants of enslaved Africans forced into the United States. Culturally and historically, African Americans are distinct from the US Black population with more recent immigrant origins.22 Few data sources contain sufficient samples to disaggregate Black respondents. Subsequently, few investigations exist of prevalence patterns in mental health outcomes within the US Black population and causes underlying potential within-racial differences. Studies following an intersectional perspective whereby Black race and immigration are theorized as uniquely contributing to depression risk are limited.
In studies of depression among US Black populations, distinctions between depression-related outcomes and measures are salient. The presence of diagnostic depression outcomes, like MDD, is defined by the Diagnostic and Statistical Manual of Mental Disorders (DSM) and based on the presence of a cluster of symptoms for at least 2 weeks, causing clinically significant distress.23 Measures of self-reported depressive symptoms are conceptually distinct yet overlap with diagnostic depression.24 Scales such as the Center for Epidemiological Studies Depression (CES-D) and the Patient Health Questionnaire have been validated as screening tools for diagnostic depression.25,–27 Psychological distress is characterized by symptoms of depressed mood in addition to symptoms of anxiety28; it has also been described as a normal emotional reaction to stressors that does not necessarily rise to the level of disorder.29 Together, measures of depressive symptoms and psychological distress fall short of meeting DSM criteria for depression.6 Although it follows that these self-reported symptom scales ought to be positively correlated with MDD, data have repeatedly shown Black Americans have a lower prevalence of MDD relative to White Americans, yet they have higher levels of both self-reported measures of depressive symptoms and psychological distress across a range of nationally representative studies.6 These discrepant patterns may suggest etiologies of diagnostic depression and related self-reported symptoms (ie, depressive symptoms and psychological distress) vary for Black Americans. A better understanding of how diagnostic depression and these related symptoms are patterned within the US Black population could provide insight into the extent to which etiologies underlying these constructs may vary.
To our knowledge, only 1 review exists characterizing the prevalence of depression within the US Black population across immigration-related domains and identifies potential mechanisms underlying differences.30 The authors cited studies of diagnostic depression that disaggregated by nativity and drew from 1 of 2 large, nationally representative studies: the National Study of American Life (NSAL) or the National Epidemiologic Survey on Alcohol and Related Conditions (NESARC). NSAL and NESARC data showed foreign-born Black immigrants generally had a lower prevalence of MDD (both in the past year and during their lifetime) compared with US-born Black Americans. Comparisons within the US-born group were limited to NSAL data, which showed those of recent Caribbean origin had a substantially higher prevalence of MDD compared with African Americans. And although the authors included a discussion of mechanisms that may protect the foreign-born Black immigrant population, there was no discussion of potential mechanisms underlying differences within the US-born Black population.30 A synthesis of prevalence patterns and mechanisms across a wider range of depression outcomes and immigration-related domains, such as region of birth, immigrant generation, or ethnic origin beyond Caribbean, does not exist, to our knowledge.
The present narrative review has 2 objectives. First, we sought to comprehensively synthesize the limited literature on depression and related symptoms within the US Black population, which disaggregates by immigration- and ethnicity-related domains. And second, within the literature captured by this synthesis, we sought to summarize mechanisms proposed to explain any differences in observed prevalence patterns. The present review was not restricted to nationally representative studies, which may provide additional insight into prevalence patterns beyond nativity or Caribbean origin and mechanisms beyond nativity. We focused on adults (aged 18 years or older) and youth (younger than 18 years) separately.
Methods
Search strategy
In October 2021, we comprehensively searched for peer-reviewed studies in the PsycINFO, PubMed, and Web of Science databases without imposing date restrictions, and used the following search string across all fields: (“Black” OR “Africa*” OR “Caribbean”) AND (“Immigra*” OR “Migrant” OR “Nativity” OR “Foreign”) AND (“Depress*” OR “Distress” OR “Mood disorder”). The search was limited to studies written in English. Studies were included in the narrative review if they provided quantitative data on the prevalence of diagnostic measures of depression (MDD, major depressive episode, dysthymia) or related self-reported symptoms (eg, depressive symptoms, psychological distress) among Black subgroups in the United States disaggregated by a domain related to ethnic or immigrant origin (eg, Caribbean ethnicity, nativity, immigrant generation). Comparative studies of Black people and White people were not eligible unless they further disaggregated race by domains of interest.
Studies were excluded for the following reasons: data on major depression or related symptoms were not provided, data were not disaggregated by domains of interest, or the study sample was from a non-Black or non-US population. Unpublished manuscripts, conference abstracts, case reports, and studies without quantitative data were ineligible. Considering the limited extant literature, we did not attempt to perform a systematic review with a formal quality assessment process.
We deposited search results into the reference management program, Endnote (Clarivate), where duplicate records were deleted. Then, we screened titles and abstracts of the remaining records to exclude irrelevant studies. Next, we retrieved full text of articles for screening. Finally, we screened reference lists of retained articles to identify additional articles. From the final set of articles, we extracted study characteristics, depression measure characteristics, subgroup characteristics, and a summary of findings. In addition, we scanned the introduction and discussion sections of included articles to identify proposed mechanisms underlying reported differences within the US Black population and to determine if the basis of the proposed mechanism was a priori or a posteriori. A mechanism was classified as a priori if it was a clear hypothesis of a given study, raised in the introduction section, regardless of whether it was formally tested. A mechanism was classified as a posteriori if it was clearly raised only in the discussion section.
Results
Study selection
Figure 1 summarizes the study selection. The initial search yielded 1 404 articles across 3 databases; from the original total, 389 duplicates were removed. Next, 1 015 titles and abstracts were screened, and 937 additional records were removed because they were deemed ineligible. The full text of the remaining 78 records was sought for retrieval; of these, 3 were unavailable. The full text was assessed on the remaining 75 articles and 44 were excluded because either the authors did not disaggregate by the domains under study (n = 28) or they did not provide the distribution of depression or related symptoms (n = 16). Nine additional records were identified from other sources (n = 8 from reference lists and 1 from expert consultation). In total, 40 studies were included in the review.
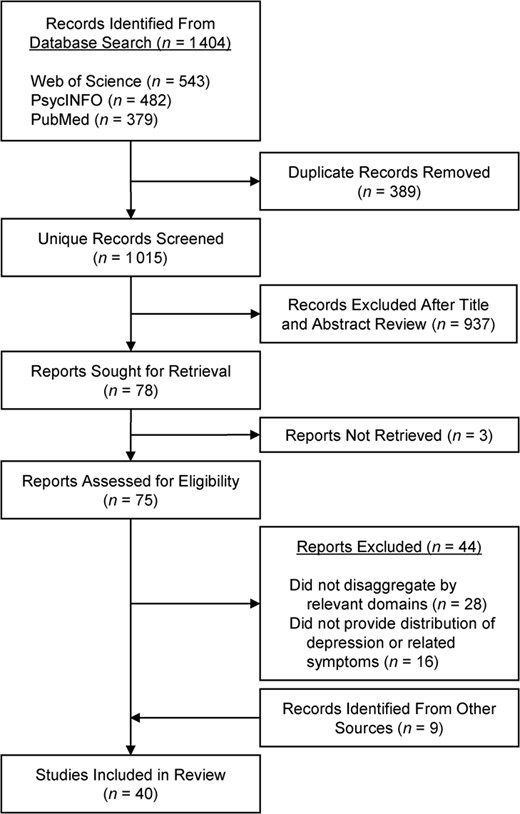
Study exclusion and inclusion flowchart.
Characteristics of studies included
Table 1 provides characteristics of studies included in the review. Of the 40 studies included, 33 used adult samples and 7 used youth samples. Additionally, 31 drew from national samples of the general (ie, noninstitutionalized) US population (n = 25 adults and 6 youth). Among adults, these national surveys were the first wave of the NESARC, the National Health Interview Survey (NHIS), mothers interviewed in the Early Childhood Longitudinal Study—Birth Cohort, and the Collaborative Psychiatric Epidemiology Surveys (CPES). The CPES combined data from 3 sister studies conducted during the same period (2001–2003): the National Comorbidity Survey (Replication) (NCS-R), the National Latino and Asian American Study, and the NSAL. The NSAL is the largest study to date of mental health of Black people, and most studies of adults (n = 20 of 33, including those labeled as CPES) drew from it. Estimates within the US Black population derived from the CPES combined NSAL and NCS-R data. Among youth, all studies except 1 were nationally representative (n = 6 of 7); these national surveys were the National Longitudinal Study of Adolescent to Adult Health, the adolescent supplement of the NCS-R, and the adolescent supplement of the NSAL (NSAL-A).
Characteristics of studies on depression and related symptoms within the US Black population disaggregating by immigration- and ethnicity-related domains (N = 40).
| Study characteristic | Overall (N = 40) | Adults (n = 33) | Youth (n = 7) |
|---|---|---|---|
| Data source | |||
| Nationally representative | 31 | 25 | 6 |
| CPES/NSAL | 20 | 20 | 0 |
| ECLS-B | 1 | 1 | 0 |
| NESARC | 2 | 2 | 0 |
| NHIS | 2 | 2 | 0 |
| Add Health | 1 | 0 | 1 |
| NCS-A | 1 | 0 | 1 |
| NSAL-A | 4 | 0 | 4 |
| Not nationally representative | 9 | 8 | 1 |
| Depression measures | |||
| Diagnostic depression | 18 | 15 | 3 |
| MDDa | 13 | 11 | 2 |
| MDE or dysthymia | 2 | 2 | 0 |
| Mood disorderb | 3 | 2 | 1 |
| Self-reported symptoms onlyc | 22 | 18 | 4 |
| Subgroups | |||
| US nativity | 8 | 8 | 0 |
| Region of birth | 3 | 3 | 0 |
| Age at immigration | 1 | 1 | 0 |
| Immigrant generation | 2 | 0 | 2 |
| Parent nativity | 1 | 0 | 1 |
| Caribbean ethnic origind | 25 | 21 | 4 |
Abbreviations: Add Health, National Longitudinal Study of Adolescent to Adult Health; CPES, Collaborative Psychiatric Epidemiological Studies; ECLS-B, Early Childhood Longitudinal Survey–Birth Cohort; MDD, major depressive disorder; MDE, major depressive episode; NCS-A, National Comorbidity Survey–Adolescent Supplement; NHIS, National Health Interview Survey; NSAL, National Survey of American Life; NSAL-A, National Survey of American Life–Adolescent Supplement.
a Refers to all studies with a separate measure of MDD. Studies that measured MDD and other depression measures separately are included.
b A broader measure that includes MDD.
c Refers to measures of depressive symptoms or psychological distress.
d Caribbean ethnic origin either alone or in combination with nativity.
Of the 33 studies using adult samples, 15 used fully structured, lay-administered diagnostic interviews to measure Diagnostic and Statistical Manual of Mental Disorders, Fourth Revision (DSM-IV) outcomes; 11 included a measure of MDD alone (lifetime or past-year recall), 2 included MDD in a measure of mood disorders broadly (lifetime recall), and 2 used a measure of major depressive episode or dysthymia (lifetime or past-year recall). All studies using DSM-IV criteria drew from either the NESARC or the CPES (including NSAL studies). The remaining 22 studies of adults used instruments capturing self-reported depressive symptoms or psychological distress, such as the CES-D and the Kessler Psychological Distress Scale. Of the 7 studies using youth samples, 3 used structured interviews to measure lifetime or past-year MDD according to DSM-IV criteria. Of these 3 studies, 2 measured MDD alone and used the NSAL-A, whereas 1 included MDD in a measure of mood disorders broadly using the adolescent supplement of the NCS-R. The remaining 4 studies used instruments capturing depressive symptoms (eg, CES-D).
Among studies estimating diagnostic measures of depression, data were collected from surveys conducted between 2001 and 2003. Among studies estimating levels of self-reported depressive symptoms, studies took place between 2001 and 2015. Last, studies estimating psychological distress collected data between 1998 and 2018.
Subgroups identified
Subgroups identified in studies using adult samples were defined by US nativity alone (US-born, foreign-born; n = 8), region of birth (ie, US-born, Caribbean-born, African-born; n = 3), or age at immigration (<13 years, ≥13 years, or US-born; n = 1), and most studies characterized subgroups by Caribbean origin (Caribbean, non-Caribbean; n = 21), with some additionally disaggregating Caribbean immigrants by nativity (foreign-born Caribbean, US-born Caribbean, non-Caribbean). All studies disaggregating by Caribbean origin drew from the NSAL (including the broader CPES) or NESARC.
Among youth samples, the subgroups identified were defined by immigrant generation (first, second, third or more [hereafter referred to as “third+”]; n = 2), parent nativity (at least 1 foreign-born parent, 2 US-born parents; n = 1), and Caribbean origin (n = 3). Of the 3 studies disaggregating by Caribbean origin, all drew from the NSAL-A, and 1 further disaggregated by parent nativity (non-Caribbean, Caribbean with at least 1 foreign-born parent, Caribbean with 2 US-born parents).
Depression and related symptoms among Black adults
The following results pertain to the 33 included studies using samples of Black adults (Table 2).
Findings from studies on depression and related symptoms within the US Black population disaggregating by immigration- and ethnicity-related domains among adults (n = 33 studies).
| First author, yearreference no. | Data source (collection period) | Depression measure | Recall | Instrument | Cutoff score or description | Black subgroups (no.) | Non-Black subgroups | Summary of findings | Proposed mechanismsa | Mechanism reasoninga |
|---|---|---|---|---|---|---|---|---|---|---|
| Domain: Nativity and region of birth (n = 11 studies) | ||||||||||
| Dey, 200631 | NHIS (1998–2003) | SPD | Past 30 days | K6 | ≥13 | US-born (NR);foreign-born (NR) | White, Latinx, Asian; each group was additionally disaggregated by nativity | Prevalence: US-born, 3.3%; foreign-born, 1.9% | Healthy immigrant effectc | A posteriori |
| Doe, 201732 | Community sample of mothers, New York City, NY (2015) | Probable postpartum depression | NR | EPDS | ≥9 | US-born (NR); foreign-born (NR) | US-born Latinx, foreign-born Latinx | Prevalence: US-born, 22.81%; foreign-born, 23.81% | None | N/A |
| Donovan, 201333 | Multisite study of college students (2008–2009) | Depressive symptoms | Past 7 days | 20 items adapted from CES-D | Continuous; range: 1–100 | US-born (NR); foreign-born (NR); N = 896 | Asian, Latinx, and White; each group was additionally disaggregated by nativity | Mean (NS): US-born, 51.81; foreign-born, 49.81 | None | N/A |
| Elo, 201038 | Community sample of pregnant women, Philadelphia, PA (1999–2004) | Probable depression | NR | CES-D | ≥23 | US-born (2816); foreign-born African (106); foreign-born Caribbean (179) | None | Prevalence (P < 0.05): US-born, 21.7%; foreign-born, 25.6%; foreign-born African, 22.6%; foreign-born Caribbean, 27.4%. Adjusted ORs: US-born (ref); foreign-born African, 1.52 (NS); foreign-born Caribbean, 1.61 (P < 0.05) | None | N/A |
| Henning-Smith, 201334 | Random sample of enrollees in Minnesota Health Care Programs (2008) | Probable depression | Past 2 weeks | PHQ-2 | ≥3 | US-born (242); Somali-born (288) | White | Prevalence (P < 0.05): US-born, 31.6%; Somali-born: 9.1% | Measurement error | A posteriori |
| Huang, 200735 | ELCS-B; mothers (2001–2002) | Depressive symptoms | NR | 12 items adapted from CES-D | Categorical; severe, ≥15; moderate, 10–14; mild, 5–9; no depression, 0–4 | US-born (NR); foreign-born (NR) | White, Latinx, Asian, Pacific Islander, Native American; each group was additionally disaggregated by nativity, when possible | Severe depression prevalence: US-born, 10.7%; foreign-born, 4.9%. Moderate depression prevalence: US-born, 15.2%; foreign-born, 16.9% Mild depression prevalence: US-born, 30.6%; foreign-born, 20.7% | None | N/A |
| Kreiger, 201136 | Community sample, Boston (2003–2004) | SPD | Past 30 days | K6 | ≥ 13 | US-born (193); foreign-born (275) | None | Prevalence: US-born: 14.2%; foreign-born: 16.2% | None | N/A |
| Krieger, 201136 | Community sample, Boston, MA (2003–2004) | Psychological distress | Past 30 days | K6 | Continuous; range: 0–24 | US-born(193); foreign-born (275) | None | Mean US-born, 6.6; foreign-born, 8.3 | None | N/A |
| Marquez-Velarde, 202139 | NHIS (2000–2018) | Psychological distress | Past 30 days | K6 | Categorical; severe: ≥13 moderate: 5–12; low or no distress: 0–4 | US-born (216 538); foreign-born Mexican/Central American/Caribbean (14 725); foreign-born South American (1386); foreign-born European (857); foreign-born African (7537) | None | Moderate to severe distress prevalence: US-born, 14.3%; foreign-born Mexican/Central American/Caribbean, 14.9%; foreign-born South American, 9.1%; foreign-born European, 15.6%; foreign-born African, 13.2%. Moderate to severe distress ORs: US-born (ref); foreign-born Mexican/Central American/Caribbean, 0.795 (P < 0.05); foreign-born South American, 0.499 (P < 0.05); foreign-born European, 1.034 (NS); foreign-born African: 0.810 (P < 0.05) | Racial context hypothesis | A priori |
| Miranda, 200540 | Community sample of low-income mothers; Washington, DC, Maryland, Virginia area (1997–2001) | Probable depression | Past month | PRIME-MD | NR | US-born (7965); foreign-born African (913); foreign-born Caribbean (273) | None | Prevalence (P < 0.05): US-born, 10.5%; foreign-born African, 3.9%; foreign-born Caribbean, 4.8% Adjusted ORs: US-born (ref); foreign-born African, 0.34 (P < 0.05); foreign-born Caribbean, 0.42 (P < 0.05) | None | N/A |
| Schwarz, 201237 | New York City Community Health Survey; women only (2002, 2003, 2005, 2006, 2008) | Probable depression | Past 30 days | K6 | ≥7 | US-born (NR); foreign-born (NR); N = 7655 | White, Latinx; each group was additionally disaggregated by nativity | Prevalence (NS): US-born, 24.2%; foreign-born: 23.6%. Adjusted OR: US-born (ref); foreign-born, 1.01 (NS) | None | N/A |
| Zick, 201941 | Community sample of women, Utah (2012–2015) | Depressive symptoms | Past 2 weeks | PHQ-2 | Continuous; range, 0–6 | US-born (96); foreign-born African (79) | Latina, Native Hawaiian/Pacific Islander, American Indian/Alaskan Native, and White | Mean US-born, 1.04; foreign-born African, 2.02 | Measurement error | A posteriori |
| Domain: Age at immigration (n = 1 study) | ||||||||||
| Breslau, 200942 | NESARC (2001–2002) | MDD, dysthymia or bipolar disorder | Lifetime | AUDADIS DSM-IV version | DSM-IV criteria | US-born (7541); immigrated at <13 years of age (153); immigrated at ≥13 years of age (613) | Latinx: Mexico, Cuba, Puerto Rico, Central/South America; White: Western Europe, Eastern Europe. Each group was additionally disaggregated by age at immigration. | Prevalence (P < 0.05): US-born, 16.28%; immigrated at <13 years of age, 12.67%; immigrated ≥13 years of age, 7.72%. Adjusted ORs: US-born (ref); immigrated at <13 years of age: 0.98 (NS); immigrated at ≥13 years of age, 0.43 (P < 0.05) | Childhood socialization in the United States | A priori |
| Domain: Caribbean ethnic origin (n = 21 studies) | ||||||||||
| Anglin, 201443 | NSAL (2001–2003) | MDD | Past year | WMH-CIDI | DSM-IV criteria | Non-Caribbean (3464); US-born Caribbean (373); foreign-born Caribbean (1114) | None | Prevalence (P < 0.05): US-born non-Caribbean, 5.3%; US-born Caribbean, 13.4%; foreign-born Caribbean, 5.6% | Subgroup variation in main effects | A priori |
| Assari, 201444 | NSAL (2001–2003) | MDD | Past year | WMH-CIDI | DSM-IV criteria | Non-Caribbean (3570); Caribbean (1621) | None | Prevalence: non-Caribbean, 5.4%; Caribbean, 7.8% | None | N/A |
| Boyd, 201145 | NSAL; mothers (2001–2003) | MDE | Lifetime | WMH-CIDI | DSM-IV criteria | Non-Caribbean (2019); Caribbean (799) | White | Prevalence: non-Caribbean, 14.51%; Caribbean, 15.22% | None | N/A |
| Boyd, 201145 | NSAL; mothers (2001–2003) | MDE | Past year | WMH-CIDI | DSM-IV criteria | Non-Caribbean (2019); Caribbean (799) | White | Prevalence: non-Caribbean: 7.95%; Caribbean: 6.77% | None | N/A |
| Brewton-Tiayon, 201546 | NSAL (2001–2003) | MDD | Lifetime | WMH-CIDI | DSM-IV criteria | Non-Caribbean (3434); US-born Caribbean (432); foreign-born Caribbean (1141) | None | US-born Caribbean people generally had a higher MDD prevalence relative to both foreign-born Caribbean and non-Caribbean people | Acculturation | A posteriori |
| Brewton-Tiayon, 201546 | NSAL (2001–2003) | MDE | Lifetime | WMH-CIDI | DSM-IV criteria | Non-Caribbean (3433); US-born Caribbean (432); foreign-born Caribbean (1141) | None | US-born Caribbean people generally had a higher MDE prevalence relative to both foreign-born Caribbean and non-Caribbean people | Acculturation | A posteriori |
| Brewton-Tiayon, 201546 | NSAL (2001–2003) | Depressive symptoms | Past 7 days | 12 items adapted from CES-D | Continuous; range: 0–36 | Non-Caribbean (3578); US-born Caribbean (432); foreign-born Caribbean (1141) | None | US-born Caribbean people generally had a higher mean CES-D score relative to both foreign-born Caribbean and non-Caribbean people | Acculturation | A posteriori |
| Doyle, 201247 | NSAL; fathers (2001–2003) | MDD | Lifetime | WMH-CIDI | DSM-IV criteria | Non-Caribbean (1254); US-born Caribbean (175); foreign-born Caribbean (458) | None | Prevalence (P < 0.05); non-Caribbean: 6.9%; US-born Caribbean, 20.2%; foreign-born Caribbean: 8.3% | Acculturation | A posteriori |
| Erving, 202148 | NSAL; adults aged ≥40 years (2001–2003) | Depressive symptoms | Past 7 days | 12 items adapted from CES-D | Continuous; range: 0–36 | Non-Caribbean (1616); Caribbean (601) | None | Mean (NS): non-Caribbean, 6.17; Caribbean: 5.90 | Noneb | N/A |
| Gibbs, 201363 | NESARC (2001–2002) | MDD | Lifetime | AUDADIS DSM-IV version | DSM-IV criteria | Non-Caribbean (7529); Caribbean (469) | White | Prevalence: non-Caribbean, 9.10%; Caribbean, 4.27%. Adjusted OR: non-Caribbean (ref); Caribbean, 0.57 (P < 0.05) | Measurement error | A posteriori |
| Gibbs, 201363 | NESARC (2001–2002) | MDD | Past year | AUDADIS DSM-IV version | DSM-IV criteria | Non-Caribbean (7529); Caribbean (469) | White | Prevalence: non-Caribbean, 4.58%; Caribbean, 2.22% Adjusted OR: non-Caribbean (ref); Caribbean, 0.58 (NS) | Measurement error | A posteriori |
| González, 201049 | CPES (2001–2003) | MDD | Lifetime | WMH-CIDI | DSM-IV criteria | Foreign-born Caribbean (66.6%); US-born Caribbean (33.4%); Caribbean total = 1476. Foreign-born non-Caribbean (2.3%); US-born non-Caribbean (97.1%); non-Caribbean total = 4249 | Chinese, Filipino, Vietnamese, Cuban, Mexican, Puerto Rican, and White; each group was additionally disaggregated by nativity | Prevalence Foreign-born Caribbean, 9.1%; US-born Caribbean, 24.1%; foreign-born non-Caribbean, 13.4%; US-born non-Caribbean, 13.1% | Healthy immigrant effectc | A posteriori |
| González, 201049 | CPES (2001–2003) | MDD | Past year | WMH-CIDI | DSM-IV criteria | Foreign-born Caribbean (66.6%); US-born Caribbean (33.4%); Caribbean total = 1476. Foreign-born non-Caribbean (2.3%); US-born non-Caribbean (97.1%); non-Caribbean total = 4249 | Chinese, Filipino, Vietnamese, Cuban, Mexican, Puerto Rican, and White; each group was additionally disaggregated by nativity | Prevalence: foreign-born Caribbean, 4.8%; US-born Caribbean, 13.4%; foreign-born non-Caribbean, 8.0%; US-born non-Caribbean, 7.2% | Healthy immigrant effect c | A posteriori |
| Griffith, 201150 | NSAL (2001–2003) | Depressive symptoms | Past 7 days | 12 items adapted from CES-D | Continuous; range: 0–36 | Non-Caribbean (3570); US-born Caribbean (440); foreign-born Caribbean (1166) | None | Mean: non-Caribbean, 6.70; US-born Caribbean, 7.45; foreign-born Caribbean, 5.81 | Nonee | N/A |
| Head, 201751 | NSAL (2001–2003) | Psychological distress | Past 30 days | K6 | Continuous; range: 0–4 | Non-Caribbean (3414); US-born Caribbean (446); foreign-born Caribbean (1114) | None | Mean (P < 0.05): non-Caribbean, 0.521; US-born Caribbean, 0.635; foreign-born Caribbean, 0.417 | Noneb | N/A |
| Ida, 201252 | NSAL (2001–2003) | Depressive symptoms | Past 7 days | 12 items adapted from CES-D | Continuous; range: 0–36 | Non-Caribbean (2953); Caribbean (1140) | None | Mean (P < 0.05): non-Caribbean, 6.60; Caribbean: 6.25 | Noneb | N/A |
| Jimenez, 201053 | CPES; adults aged ≥60 years (2001–2003) | MDE, dysthymia | Lifetime | WMH-CIDI | DSM-IV criteria | Non-Caribbean (671); Caribbean (163); within Caribbean ethnicity US-born Caribbean (34); foreign-born Caribbean (159) | White, Latinx, Asian; each group was additionally disaggregated by nativity | Prevalence: non-Caribbean, 5.4%; Caribbean, 8.1%; within Caribbean ethnicity (NS) US-born, 13.6%; foreign-born, 5.7% | None | N/A |
| Jimenez, 201053 | CPES; adults aged ≥60 years (2001–2003) | MDE, dysthymia | Past year | WMH-CIDI | DSM-IV criteria | Non-Caribbean (671); Caribbean (163); within Caribbean ethnicity US-born Caribbean (34); foreign-born Caribbean (159) | White, Latinx, Asian Each group was additionally disaggregated by nativity. | Prevalence: non-Caribbean, 2.3%; Caribbean, 4.6%; within Caribbean ethnicity (NS) US-born, 9.2%; foreign-born, 2.6% | None | N/A |
| Jones, 202054 | NSAL; women only (2001–2003) | MDD | Lifetime | WMH-CIDI | DSM-IV criteria | Nativity and Caribbean ethnicity: US-born non-Caribbean (2242); US-born Caribbean (264); foreign-born Caribbean (705) | None | Prevalence (P < 0.05): US-born non-Caribbean, 14.4%; US-born Caribbean, 22.6%; oreign-born Caribbean, 11.2% | Healthy immigrant effectc | A posteriori |
| Jones, 202054 | NSAL; women only (2001–2003) | MDD | Past year | WMH-CIDI | DSM-IV criteria | Nativity and Caribbean ethnicity: US-born non-Caribbean (2242); US-born Caribbean (264); foreign-born Caribbean (705) | None | Prevalence: US-born non-Caribbean, 8.2%; US-born Caribbean, 7.5%; foreign-born Caribbean, 7.0% | Healthy immigrant effectc | A posteriori |
| Lincoln, 200755 | NSAL (2001–2003) | Depressive symptoms | Past 7 days | 12 items adapted from CES-D | Continuous; range: 0–36 | Non-Caribbean (3361); Caribbean (1554) | None | Mean: non-Caribbean, 6.78; Caribbean: 6.07 | Healthy immigrant effectc | A posteriori |
| Mays, 201856 | NSAL; men only (2001–2003) | MDD | Lifetime | WMH-CIDI | DSM-IV criteria | US-born non-Caribbean (1222); US-born Caribbean (176); foreign-born Caribbean (461) | None | Prevalence (P < 0.05): US-born non-Caribbean, 8.8%; US-born Caribbean, 21.1%; foreign-born Caribbean, 8.9% | None | N/A |
| Mays, 201856 | NSAL; men only (2001–2003) | MDD | Past year | WMH-CIDI | DSM-IV criteria | US-born non-Caribbean (1222); US-born Caribbean (176); foreign-born Caribbean (461) | None | Prevalence (P < 0.05): US-born non-Caribbean, 4.6%; US-born Caribbean, 16.4%; foreign-born Caribbean, 4.9% | None | N/A |
| Mereish, 201657 | NSAL; men (2001–2003) | Depressive symptoms | Past 7 days | 12 items adapted from CES-D | Continuous; range: 0–3 | Non-Caribbean (1201); Caribbean (545) | None | Mean: non-Caribbean, 0.51; Caribbean, 0.49 | Noned | N/A |
| Molina, 201658 | NSAL (2001–2003) | MDD | Past year | WMH-CIDI | DSM-IV criteria | Non-Caribbean (3570); Caribbean (1418) | None | Prevalence (NS): non-Caribbean, 6.76%; Caribbean, 6.70%; Adjusted OR: non-Caribbean (ref); Caribbean, 1.58 (NS). Effect modification: for Caribbean immigrants, but not African Americans, internalized racism was associated with decreased odds of MDD. | Noned | N/A |
| Taylor, 202062 | NSAL (2001–2003) | Depressive symptoms | Past 7 days | 12 items adapted from CES-D | Continuous; range: 0–36 | Non-Caribbean (3570); Caribbean (11) | None | Mean (NS): non-Caribbean, 6.70; Caribbean, 6.40 | None | N/A |
| Taylor, 202062 | NSAL (2001–2003) | Psychological distress | Past 30 days | K6 | Continuous; range: 0–24 | Non-Caribbean (3570); Caribbean (11) | None | Mean (NS): non-Caribbean, 3.81; Caribbean: 3.52 | None | N/A |
| Williams, 200759 | NSAL (2001–2003) | MDD | Lifetime | WMH-CIDI | DSM-IV criteria | Non-Caribbean (3570); Caribbean (1621); within Caribbean ethnicity US-born Caribbean (440); foreign-born Caribbean (1166) | White | Prevalence (NS): non-Caribbean: 10.4%; Caribbean: 12.9%; within Caribbean ethnicity (P < 0.05) US-born Caribbean, 19.8%; foreign-born Caribbean, 8.9% | None | N/A |
| Williams, 200759 | NSAL (2001–2003) | MDD | Past year | WMH-CIDI | DSM-IV criteria | Non-Caribbean (3570) Caribbean (1621); within Caribbean ethnicity US-born Caribbean (440); foreign-born Caribbean (1166) | White | Prevalence (NS): non-Caribbean, 5.9%; Caribbean, 7.2%; within Caribbean ethnicity (NS) US-born Caribbean, 10.9%; foreign-born Caribbean, 2.0% | None | N/A |
| Woodward, 201261 | CPES; adults aged ≥55 years (2001–2003) | MDD or dysthymia | Lifetime | WMH-CIDI | DSM-IV criteria | Non-Caribbean ≥55 years old (780); Caribbean ≥55 years old (262) | White, Latinx, Asian | Prevalence: non-Caribbean ≥55 years old, 5.4%; Caribbean aged ≥55 years, 11.2%. Adjusted OR: non-Caribbean aged ≥55 years (ref); Caribbean aged ≥55 years, 3.17 (P < 0.05) | Measurement error, religiosity | A posteriori |
| Woodward, 201360 | NSAL; adults aged ≥50 years (2001–2003) | MDD | Lifetime | WMH-CIDI | DSM-IV criteria | Non-Caribbean aged ≥50 years (1074); Caribbean aged ≥50 years (415) | White | Prevalence (P < 0.05): non-Caribbean aged ≥50 years, 8.8%; Caribbean aged ≥50 years, 11.2% | None | N/A |
| Woodward, 201360 | NSAL; adults aged ≥50 years (2001–2003) | MDD | Past year | WMH-CIDI | DSM-IV criteria | Non-Caribbean aged ≥50 years (1074); Caribbean aged ≥50 years (415) | White | Prevalence (NS): non-Caribbean aged ≥50 years, 4.0%; Caribbean aged ≥50 years, 8.1% | None | N/A |
Abbreviations: AUDADIS, Alcohol Use Disorder and Associated Disabilities; CES-D, Center for Epidemiological Studies Depression; CPES, Collaborative Psychiatric Epidemiological Studies; DSM-IV, Diagnostic and Statistical Manual of Mental Disorders, Fourth Edition; ECLS-B, Early Childhood Longitudinal Survey–Birth Cohort; EPDS, Edinburgh Postnatal Depression Scale; K6, Kessler Psychological Distress Scale; MDD, major depressive disorder; MDE, major depressive episode; N/A, not applicable; NESARC, National Epidemiologic Survey on Alcohol and Related Conditions; NHIS, National Health Interview Survey; NR, not reported; NS, nonsignificant; NSAL, National Survey of American Life; OR, odds ratio; PHQ-2, Patient Health Questionnaire containing the first 2 questions of the 9-item PHQ-9; ref, referent; PRIME-MD, Primary Care Evaluation of Mental Disorders; SPD, serious psychological distress; WMH-CIDI, World Mental Health version of the Composite International Diagnostic Interview.
a Mechanism basis reasoning about whether the listed mechanism was a clear hypothesis in the given study raised in the introduction section (a priori) or if it was raised in the discussion section alone (a posteriori).
b The focus of these studies was to test hypotheses related to subgroup variation in main effects (ie, effect modification).
c Proposed mechanism(s) refers to within-Black racial differences in prevalence or mean levels.
d The healthy immigrant effect is technically not a mechanism but rather an observed pattern of better health outcomes among the foreign-born immigrants compared with the US-born group.
eDepression measure was treated as a covariate rather than as an outcome.
Nativity and region of birth
All 7 studies in which subgroups were defined by US nativity alone31,–37 measured symptoms related to diagnostic depression. Two studies were nationally representative, using the NHIS and ELCS-B.31,35 Three studies (2 using national data and 1 based on a random sample of enrollees in Minnesota health care programs) indicated symptoms were higher in the US-born group compared with the foreign-born group.31,34,35 Four studies indicated estimates were roughly equivalent between the 2 groups.32,33,36,37
Four studies defined subgroups by region of birth38,–41; 3 used community-based samples and assessed probable depression, using depressive symptom scales,38,40,41 and 1 assessed psychological distress in a national sample through the NHIS.39 One study used the United States and Africa as regions of birth41; 2 studies used the United States, Africa, and the Caribbean38,40; and 1 study used 5 regions of birth: United States, Mexico/Central America/Caribbean, South America, Europe, and Africa.39
In their study of a community sample of women, Zick et al.41 found African-born participants had a higher mean level of depressive symptoms compared with US-born participants. Similarly, Elo and Culhane38 drew from a community sample of pregnant Black women and found foreign-born participants, overall, had a higher prevalence of probable depression compared with US-born participants. Results further revealed variation by region of birth such that Caribbean-born women had a higher prevalence of probable depression compared with African-born women (27.4% vs. 22.6%), and US-born women had the lowest prevalence (21.7%).
Heterogeneity within foreign-born adults was consistent in other studies. Using a community sample of low-income mothers, Miranda et al.40 found the prevalence of probable depression was highest among US-born mothers (10.5%); Caribbean-born mothers (4.8%) had a higher prevalence than African-born mothers (3.9%). Marquez-Velarde et al.39 used 19 years of data from the NHIS to disaggregate Black foreign-born adults in the United States into regions of origin around the globe. The authors found considerable heterogeneity of moderate to severe depression across ethnic groups—European immigrants had the highest prevalence (15.6%) followed by Mexican/Central American/Caribbean immigrants (14.9%), African immigrants (13.2%), and South American immigrants (9.1%)—compared with 14.3% among US-born Black adults. In adjusted models with the US-born group as the reference, only Black European immigrants had a comparable odds of moderate to severe distress (odds ratio [OR] = 1.03); all other immigrant groups had a lower odds of moderate to severe distress.
Age at immigration
One study defined subgroups by age at immigration.42 Using NESARC data, authors found the prevalence of any lifetime mood disorder (MDD, dysthymia, or bipolar disorder), was highest among the US-born subgroup (16.28%), followed by those who immigrated when they were younger than 13 years (12.67%), and was lowest among those who immigrated when they were 13 years old or older (7.72%). In models adjusted for age and sex, there was no difference between those who immigrated when they were younger than 13 years compared with the US-born group (OR = 0.98), and there was a substantially lower odds of lifetime mood disorder for those who immigrated when they were 13 years old or older compared with the US-born group (OR = 0.43).
Caribbean ethnic origin
All 20 studies based on the NSAL (including 3 from the broader CPES) defined subgroups by Caribbean ethnic origin, either alone or in combination with nativity.43,–62 One additional NESARC study defined subgroups by Caribbean origin.63 Comparisons between Caribbean people and non-Caribbean people yielded mixed findings.
Thirteen studies disaggregated Black respondents into subgroups by Caribbean ethnic origin alone (ie, Caribbean vs. non-Caribbean).44,45,48,52,53,55,57,–63 Of these, 8 used DSM-IV criteria depression measures.44,45,53,58,–61,63 Four studies using NSAL data found either Caribbean immigrants had a slightly higher (yet nonstatistically significant) prevalence of depression relative to non-Caribbean people or estimates were roughly equivalent.44,45,58,59 However, using NSARC data, Gibbs et al.63 found lifetime MDD was significantly lower among Caribbean people relative to non-Caribbean people (4.27% vs. 9.10%; adjusted OR = 0.57). Three studies drawing from a subset of older adults in the NSAL found Caribbean people had a higher prevalence of MDD relative to non-Caribbean people, and these results were robust to adjustment.53,60,61 For example, Woodward et al.61 found older Caribbean people had more than 3 times the odds of MDD or dysthymia compared with older non-Caribbean people (OR = 3.17). In the remaining 5 studies that used symptom-based measures, each found levels of depressive symptoms were slightly lower among Caribbean people relative to non-Caribbean counterparts.48,52,55,57,62
Ten studies additionally disaggregated participants by nativity, including 2 previously mentioned.43,46,47,49,–51,53,54,56,59 All used NSAL data, and all but 1 used the following Caribbean ethnicity and nativity categorizations: US-born Caribbean, foreign-born Caribbean, and non-Caribbean (1 study additionally disaggregated non-Caribbean people by nativity). In all studies using diagnostic measures of depression, relative to non-Caribbean people, US-born Caribbean people had a substantially higher prevalence of depression, and foreign-born Caribbean immigrants had a lower prevalence; patterns were similar for depression-related symptoms. For example, although Williams et al.59 found minimal differences in depression-related symptoms between Caribbean people and non-Caribbean people (12.9% vs. 10.4%), disaggregating by ethnicity alone obscured the heightened prevalence among US-born Caribbean people (19.8%) and the lowered prevalence among foreign-born Caribbean immigrants (8.9%). Likewise, for depressive symptoms and psychological distress, studies also found US-born Caribbean people had the highest levels, followed by non-Caribbean people, and foreign-born Caribbean immigrants had the lowest levels.50,51
Potential mechanisms among adults
In 12 studies using samples of Black adults, authors proposed mechanisms underlying expected or observed differences within the US Black population in the prevalence of depression and its levels of related symptoms across subgroups. Proposed mechanisms underlying prevalence variation were either artefactual (ie, due to systematic bias) or etiologic, with the former being invoked only a posteriori. In addition, 6 studies discussed etiologic mechanisms that may underlie observed Black subgroup differences in the effects of exposures of interest on depression outcomes.
Artefactual explanations
Measurement error
In 4 studies, authors speculated findings may be related to measurement error.34,41,61,63 Although in the in Henning-Smith et al.34 study, the US-born group had higher levels of depressive symptoms but lower levels in the Zick et al.41 study, compared with foreign-born participants, both studies cited the possibility of cultural differences in the way questions were answered. Relatedly, Woodward et al.61 suggested the lower prevalence of MDD among older non-Caribbean people (relative to older Caribbean people) to these individuals being more likely to minimize symptoms of depression and thus answer questions differently. Gibbs et al.63 produced estimates of the prevalence of MDD by Caribbean origin using NESARC data, which differed from NSAL data collected during the same period. The authors speculated these differences may be due to either the NESARC underestimating or the NSAL overestimating the prevalence of MDD among Caribbean people in the United States, but they did not further specify why these studies may have produced different estimates.
Selection bias
Although not a mechanism itself, the “healthy immigrant effect” refers to the phenomenon that upon arrival to the United States, immigrants have better health profiles than their US-born counterparts.64 The healthy immigrant effect may be an artifact of selective migration,65,–67 whereby individuals able to migrate may, on average, have better health, thus leading to the appearance of a health advantage among immigrants relative to the native born. In the present review, we consider the healthy immigrant effect a form of selection bias. We identified 4 studies in which authors attributed the pattern of lower levels of depression or related symptoms among the foreign-born immigrants (relative to the US-born group) to the healthy immigrant effect.31,49,54,55 One study measured psychological distress and disaggregated participants by nativity,31 2 measured lifetime MDD and disaggregated by Caribbean origin and nativity,49,54 and the fourth study measured depressive symptoms and disaggregated by Caribbean ethnicity alone.55 In the latter study, which disaggregated by Caribbean ethnicity alone, authors characterized depressive symptoms using a 2-class latent profile model: a high symptoms class, and a low symptoms class. More recent foreign-born Caribbean immigrants (those who have resided in the United States for 10 years or less) were more likely to be in the low symptoms class than all US-born respondents, as well as all other Caribbean immigrants.55
Etiologic explanations
Acculturation and childhood socialization in the United States
Evidence suggests the initial immigrant health advantage declines over time, with health outcomes among the foreign-born immigrants converging to levels similar to US-born counterparts. This pattern is frequently attributed to acculturative processes, whereby immigrants increasingly adopt the native population’s values and behaviors over time, with important health implications.64 Although formal scales exist, studies in the health research literature often approximate acculturation through variables such as nativity, generational status, and length of stay in the United States.68 In the present review, in 2 studies in which lower prevalence among the foreign-born immigrants was observed, researchers attributed these findings to acculturation a posteriori.46,47
Consistent with the hypothesis that acculturation among immigrants is detrimental for mental health, authors reported the lower prevalence of lifetime mood disorders among immigrants (compared with the US-born group) was limited to those who immigrated at 13 years of age or older, in a third study using NESARC data.42 The authors hypothesized (a priori) that these findings may be due to the detrimental mental health effects of childhood socialization in the United States. Of note, this finding of variation within immigrants was not limited to Black participants; it was also observed for those of Mexican origin and Eastern European origin in the same study, as well as Asian Americans in a separate study conducted by the same first author.42,69 However, there was no formal evaluation of the role of childhood socialization in the United States beyond a descriptive assessment of differences by immigrant generation.
Religiosity
One study proposed religiosity as a mechanism to explain differences between Black Caribbean people and non-Caribbean people in the NSAL a posteriori. Woodward et al.61 postulated the lower prevalence of mood disorders among non-Caribbean people in their study of older adults (aged ≥50 years) in the CPES may be due to increased religious involvement, which may be linked to increased levels of social support, leading to lower levels of mood disorders.
Racial context hypothesis
In 1 study, authors disaggregated Black adults in the United States by region of birth and found variation in levels of psychological distress, consistent with their a priori hypothesis.39 The purpose of the study was to test the “racial context hypothesis,”39 which suggests people from contexts where Black people are a racial minority would have worse mental health outcomes relative to those from contexts where Black people are a racial majority, due to higher exposures to racism and its detrimental effects on mental health.70 Indeed, Black European immigrants were the only foreign-born group without a significantly lower odds of moderate or severe distress compared with the US-born group.39 However, the authors did not evaluate racial context hypothesis beyond a descriptive assessment.
Ethnic-group variation in causal mechanisms
Six studies also tested for and found evidence of ethnic group variation in hypothesized causes of depression via effect modification, each using NSAL data.43,48,51,52,57,58 In 4 studies, authors hypothesized ethnic differences in childhood socialization between Black participants with and without recent immigrant origins underlie observed, significant, ethnic-group differences in observed associations.43,52,57,58 For instance, whereas Ida and Christie-Mizell52 found no difference in levels of depressive symptoms between Caribbean people and non-Caribbean people, the protective function of racial identity on depressive symptoms was markedly weaker for Caribbean people than for non-Caribbean people. The authors attributed differences in observed associations to differences in racial socialization. Similarly, Molina and James58 found no substantive difference between Caribbean people and non-Caribbean people in past-year MDD, yet “internalized racism,” a measure that other NSAL studies have operationalized in its inverse as a racial identity indicator—the extent to which one positively evaluates Black people in the United States52,71,72—was associated with a lower prevalence of MDD for Caribbean people alone. Therefore, these results suggest higher levels of racial identity may be associated with a higher prevalence of MDD among Caribbean immigrants.
Depression and related symptoms among Black youth
The following results pertain to the 7 studies using samples of Black youth (Table 3).
Findings from studies on depression and related symptoms within the US Black population disaggregating by immigration- and ethnicity-related domains among youth (n = 7 studies).
| First author, yearreference no. | Data source (collection period) | Depression measure | Recall | Instrument | Cutoff score or description | Black subgroups (no.) | Non-Black subgroups | Summary of findings | Proposed mechanismsa | Mechanism reasoninga |
|---|---|---|---|---|---|---|---|---|---|---|
| Domain: Immigrant generation (n = 2 studies) | ||||||||||
| Georgiades, 201873 | NCS-A (2001–2004) | Mood or anxiety disorderc | Lifetime | WMH-CIDI | DSM-IV criteria | First generation (33); second generation (57); third+ generation (999) | White, Latinx, Asian Each group was disaggregated by immigrant generation. | Prevalence: first generation, 30.71%; second generation, 37.16%; third+ generation, 36.76% | None | N/A |
| Harker, 200174 | Add Health (wave 2; 1996) | Depressive symptoms | Past week or past year (varied by item) | 23 items adapted from the CES-D and Beck inventory | Continuous summary index reflecting mean item score; range: 1–4 | First generation (59); second generation (135); third+ generation (2582) | Mexican, Cuban, Central/South American, Puerto Rican, Chinese, Filipino, other Asian/Pacific Islander, White Each group was disaggregated by immigrant generation. | Mean: first generation, 1.54; second generation, 1.55; third+ generation, 1.61 | None | N/A |
| Domain: Parent nativity (n = 1 study) | ||||||||||
| Kim, 201875 | Mental health screening of sixth-grade students in Seattle, WA, public schools (2001–2004) | Depressive symptoms (continuous) | NR | 30 items from MFQ | Continuous; range: NR | At least 1 foreign-born parent (145); 2 US-born parents (320) | Asian/Pacific Islander, White, Latinx Each group was disaggregated by parent nativity. | Mean (NS): at least 1 foreign-born parent, 11.0; 2 US-born parents, 10.0 | None | N/A |
| Domain: Caribbean ethnicity (n = 4 studies) | ||||||||||
| Assari, 201776 | NSAL-A (2001–2003) | MDD | Lifetime | WMH-CIDI | DSM-IV criteria | Non-Caribbean (810); Caribbean (360) | None | Prevalence (NS): non-Caribbean, 6.25%; Caribbean, 6.63%. Adjusted OR: non-Caribbean (ref); Caribbean, 0.86 (NS). Effect modification: variation present in the relationship between perception of neighborhood safety and MDD across Caribbean ethnicity and sex | Noned | N/A |
| Pachter, 201877 | NSAL-A (2001–2003) | MDD | Lifetime | WMH-CIDI | DSM-IV criteria | Non-Caribbean (810); Caribbean (360) | None | Prevalence (NS): non-Caribbean, 6.3%; Caribbean, 6.6% | None | N/A |
| Pachter, 201877 | NSAL-A (2001–2003) | MDD | Past year | WMH-CIDI | DSM-IV criteria | Non-Caribbean (810); Caribbean (360) | None | Prevalence (NS): non-Caribbean, 4.2%; Caribbean, 5.2% | None | N/A |
| Seaton, 200878 | NSAL-A (2001–2003) | Depressive symptoms | Past 7 days | 12 items adapted from CES-D | Continuous; range: 0–36 | Non-Caribbean (810); Caribbean (360) | None | Mean (NS): non-Caribbean, 9.08; Caribbean, 8.29. Effect modification: the association between perceived discrimination and depressive symptoms was strongest for Caribbean adolescents (vs. non-Caribbean adolescents) | Noneb | N/A |
| Smith, 202079 | NSAL-A (2001–2003) | Depressive symptoms | Past 7 days | 12 items adapted from CES-D | Continuous; range: 0–36 | Non-Caribbean (783); Caribbean with US-born parents (216) Caribbean immigrants with foreign-born parents (144) | None | Mean (NS): non-Caribbean, 9.09; Caribbean with US-born parents, 8.80; Caribbean immigrants with foreign-born parents, 7.36. Effect modification: the association between perceived discrimination and depressive symptoms was strongest for Caribbean adolescents with immigrant parents (vs. non-Caribbean adolescents) | Noned | N/A |
Abbreviations: Add Health, National Longitudinal Study of Adolescent to Adult Health; CES-D, Center for Epidemiological Studies Depression; DSM-IV, Diagnostic and Statistical Manual of Mental Disorders, Fourth Edition; MDD, major depressive disorder; MFQ, Mood and Feelings Questionnaire; N/A, not applicable; NCS-A, National Comorbidity Study (Replication)–Adolescent Supplement; NR, not reported; NS, non-significant; NSAL-A, National Survey of American Life–Adolescent Supplement; OR, odds ratio; Third+, third or more generations; WMH-CIDI, World Mental Health version of the Composite International Diagnostic Interview.
a Mechanism basis reasoning about whether the listed mechanism was a clear hypothesis in the given study raised in the introduction section (a priori) or if it was raised in the discussion section alone (a posteriori).
b The focus of these studies was to test hypotheses related to subgroup variation in main effects (ie, effect modification).
c Proposed mechanism(s) refers to within-Black racial differences in prevalence or mean levels.
d Mood disorders: MDD, dysthymia, or bipolar disorder; anxiety disorders: panic disorder, agoraphobia, social phobia, specific phobia, generalized anxiety disorder, posttraumatic stress disorder, separation anxiety disorder.
Immigrant generation and parent nativity
Two studies defined groups by immigrant generation similarly found third+ generation youth had a heightened prevalence of depression or levels of related symptoms, relative to first-generation youth.73,74 Using NCS-R data, Georgiades et al.73 found the prevalence of any lifetime mood or anxiety disorder was heightened for third+ generation youth (36.76%) and second-generation youth (37.16%), relative to first-generation youth (30.71%). Using the second wave of National Longitudinal Study of Adolescent to Adult Health data, Harker74 found differences in depressive symptoms such that levels were highest among third+ generation youth, followed by similar levels between first- and second-generation youth. Yet in a third study using parent nativity, Kim et al.75 drew from a sample of sixth-grade students in Seattle, WA, and found no substantive difference in levels of depressive symptoms between students with at least 1 foreign-born parent (ie, first- and second-generation youth combined) and those with 2 US-born parents (ie, third+ generation youth).
Caribbean ethnic origin
As with studies using NSAL data among adults, all 4 studies drawing from the NSAL-A used an ethnic group defined by Caribbean origin either alone76,–78 or with parent nativity.79 In all 3 studies using Caribbean origin alone, authors found similar results under their respective measures; there was no substantive difference between Caribbean and non-Caribbean youth in lifetime or past-year MDD76,77 or depressive symptoms in the past 7 days.78 Smith79 additionally disaggregated Caribbean origin by parent nativity and found statistically significant group differences in levels of depressive symptoms such that non-Caribbean youth had the highest mean, followed by Caribbean youth with 2 US-born parents, and the lowest mean was among Caribbean youth with at least 1 foreign-born parent.
Potential mechanisms among youth
In none of the 7 studies did the authors discuss potential mechanisms to explain anticipated or observed subgroup differences in depression-related outcomes among Black youth. However, in 3 of the studies on Black youth, researchers proposed mechanisms related to ethnic group differences in hypothesized causal mechanisms leading to depression through analyses of effect modification, each using NSAL data.76,78,79 In 2 of those reports, the authors examined whether Caribbean ethnicity modified the relationship between perceived discrimination and depressive symptoms. Seaton et al.78 found this relationship was stronger for Caribbean youth compared with non-Caribbean youth. Smith79 expanded upon this work by additionally disaggregating by parent nativity and found the relationship was significantly stronger for Caribbean youth with at least 1 foreign-born parent compared with non-Caribbean youth. In both studies, the authors further attributed their findings of effect modification to ethnic differences in racial socialization and to the possibility of less protective preparation for racial bias experienced by Caribbean immigrant youth as part of their upbringing.
Discussion
Drawing from nationally representative studies and community-based samples, we found in this review substantial variation in the prevalence of depression and related symptoms within the US Black population. Across studies disaggregating by nativity, heightened levels of both depression and related symptoms among those born in the United States relative to the foreign-born group were most consistent in nationally representative samples. Studies disaggregating by region of birth found foreign-born African immigrants consistently had lower levels of depression-related symptoms relative to foreign-born Black immigrants from other regions. We also found 1 study suggesting the apparent protective effect of being foreign-born is limited to those who immigrated to the United States at age 13 years or older. Additionally, this review confirmed that most of what is known about variation in outcomes within the US Black population comes from a single data source—the NSAL—and thus, Caribbean ethnic origin was the most used disaggregation domain. NSAL data revealed comparisons between Caribbean people and non-Caribbean people alone obscured both the heightened prevalence of depression among US-born Caribbean people and the lower prevalence among foreign-born Caribbean immigrants, findings that were consistent across measures of both diagnostic depression and related symptoms.
In this review, we avoided “African American” in favor of “non-Caribbean” in referencing studies that dichotomize Caribbean origin. Regarding Caribbean origin subgroups, several studies categorized Black non-Caribbean people as “African American” by default. One consequence of such categorization is that non-Caribbean Black immigrants who arrived in the United States more recently (ie, during the 20th and 21st centuries) would be categorized as African American. Likewise, the second (and third, to an extent) generation of Black immigrants would also be conflated with African American. As an ethnic group with several generations in the United States, African Americans are a nonimmigrant ethnic group. And whereas Caribbean immigrants are the largest Black immigrant ethnic group, collapsing all non-Caribbean immigrants as “African American” renders other Black immigrant groups (eg, those of African origin) invisible.
The NSAL is the only nationally representative epidemiologic survey on psychiatric disorders designed to disaggregate the Black US population.80 Though it was conducted 20 years ago, the NSAL remains the largest study of Black mental health. Although NSAL data can be disaggregated by nativity (ie, foreign-born, US-born), the survey focused on 2 ethnic subgroupings of the Black population: those with recent Caribbean origin (first-, second-, and third-generation immigrants) and those without. NSAL data are unable to address whether patterns within Caribbean immigrants extend to other Black immigrant origins (eg, sub-Saharan Africa, Latin America). And because the NSAL has not been replicated, it is unclear whether these patterns would hold using more recent data. Similarly, wave 1 of the NESARC, which is the other data source captured in this review that estimated diagnostic depression, was conducted from 2001 to 2002. The most recent version of NESARC was conducted from 2012–2013, yet this review captured no study using these data. Given recent increases in Black immigrant populations, including those from regions beyond the Caribbean, funding priorities supporting collecting more recent data are an important prerequisite for future research.
By categorizing studies by domains of disaggregation, we identified Black subgroups that have received no attention. Namely, there appears to be no study among adults disaggregated by immigrant generation; thus, the patterning of depression among second-generation immigrant adults is unclear. The closest approximation identified was US-born Caribbean people in NSAL studies, who comprise both second- and third-generation immigrants. To determine whether results among US-born Caribbean people apply to second-generation immigrants broadly, studies that include and distinguish second- and third-generation Black ethnic-immigrant groups from regions beyond the Caribbean are needed.
Also of note, no study identified in this review further disaggregated Black race by Hispanic/Latinx ethnicity; thus, it is possible there is further variation, particularly in MDD within Black Americans of Caribbean origin. A quarter of the US Hispanic/Latinx population identifies as “Afro-Latino, Afro-Caribbean or of African descent with roots in Latin America.”81 Relatedly, about a quarter of the total population of Latin America are people of African descent, with the largest numbers residing in Brazil, Venezuela, and the Dominican Republic.82 To illustrate the possibility of additional variation, studies using NSAL data included Black Hispanic/Latinx Caribbean immigrants, whereas Gibbs et al.63 used NESARC data collected during the same period and excluded Black Hispanic/Latinx Caribbean immigrants. If MDD is heightened among Black Hispanic/Latinx Caribbean immigrants, this may explain discrepant findings by Caribbean ethnicity between NSAL and NESARC data. Namely, relative to non-Caribbean Black Americans, Caribbean immigrants in the NSAL had a similar prevalence of MDD yet Caribbean immigrants in the NESARC had a lower prevalence of MDD. Indeed, 1 NSAL study suggests, at least among Black Caribbean women, those originating from Spanish-speaking countries had a heightened odds of any mood disorder relative to those originating from English-speaking countries.83
In this review, we identified potential mechanisms underlying differences within the US Black population. Some artefactual explanations, such as selective migration and measurement error, are similar to those frequently proposed to explain patterns observed for all immigrant groups. Others, however, highlight the potential uniqueness of Black immigrants and their offspring, simultaneously experiencing mental health–relevant stressors related to both racism and immigration. For example, regarding differences across region of birth, 1 study tested the racial context hypothesis that those born a racial minority are expected to be at increased risk for depressive symptoms due to greater exposures to racism and its detrimental effects on mental health. Similarly, differences by age at immigration and Caribbean origin were attributed to the potential effects of childhood racial socialization in the United States functioning as a causal factor for depression among Black adults. Studies drawing from youth samples found no substantial variation in depression outcomes. Some, however, found substantial effect modification by ethnicity and attributed patterns to differences in racial socialization. Therefore, although speculative to date, proposed etiologic explanations point to the notion that there exists heterogeneity within the US Black population in factors related to racialization that may contribute to variation in depression and related symptoms.
By summarizing potential mechanisms, this review reveals at least 2 promising areas of future research accounting for ethnic differences in outcomes under study. The first concerns the importance of racial context in explaining variation by region of origin. Selective migration may be at play, whereby healthier immigrants are more likely to migrate from majority Black countries. Alternatively, variation may be explained by the long-term negative mental health effects of racism and discrimination due to being born and raised as a member of a racialized minority.84
A second, related promising area of work involves exploring variation in the relationship between racial socialization experiences and depression and its related outcomes. The findings of a recent literature review84 indicate numerous studies support the notion that parental racial socialization messages lead to the development of strong racial identities among children of color. Among Black respondents, other studies find support for racial identity leading either directly to lower levels of poor mental health outcomes or functioning as a buffer against the negative effects of discrimination on poor mental health outcomes.85,–90 Related, additional work supports the claim that among Black adolescents, racial socialization may result in positive coping strategies when faced with racialized stressors.91
Using NSAL data, we found that although studies of youth revealed no substantive differences in depression or related symptoms by Caribbean ethnic origin, these data showed the relationship between discrimination and depression-related symptoms was stronger for Caribbean youth. Likewise, among adults in the NSAL, studies suggest variation in the association between racial identity and depression where it is either not protective or not as protective for Caribbean people relative to non-Caribbean people. Consistent with the theory that racial identity may have varying effects on depression, an increasing body of qualitative, ethnographic research suggests racial socialization experiences during adolescence relevant to mental health, such as racial identity formation, differ between Black youth with and without foreign-born parents.92,–102
Qualitative and quantitative studies are needed to clarify how such differences in racial socialization and racial identity formation affect depression within the US Black population. Existing measures of racial socialization are not designed to capture the unique and complex messages that Black youth with immigrant parents (or grandparents) may receive.92,103,–105 As such, there is a need for measurement innovation to better capture quantitatively ethnic variation in racial socialization. Research addressing whether racial identity functions as a protective factor for Black Americans without recent immigrant origins may help elucidate the apparent paradoxical Black and White racial patterns in the prevalence of MDD. Another line of work could include cross-national comparative studies to better understand if and how processes of immigrant adaptation vary in contexts beyond the United States.
Immigration is an important sociocultural factor associated with variations in depression and related symptoms within the US Black population. This review contributes to the scant literature recognizing Black ethnic diversity, by providing additional insight into patterns of depression and its related symptoms within the US Black population, as well as mechanisms that may explain subgroup differences. Though data are limited, extant evidence suggests substantial heterogeneity across immigration- and ethnicity-related domains. Given identified differences, it is important to determine whether these patterns are consistent, using more recent data. This review also points to the need for more measures capturing heterogeneity within Black Americans (eg, ethnic origin, region of birth, immigrant generation) and measurement innovation in terms of domains of racialization that may be relevant to Black immigrants and their US-born offspring. Efforts that fail to conceptualize Black Americans as ethnically diverse have the potential to conceal meaningful differences in depression prevalence and hinder progress toward understanding mechanisms unique to the Black population.
Acknowledgements
The authors thank Dr. Katherine M. Keyes and Dr. Adina Zeki Al Hazzouri for their thoughtful feedback on previous drafts of this work.
Funding
None declared.
Conflict of interest
The authors declare no conflicts of interest.
Data availability statement
The data set is available from the corresponding author.
