


Abstract
Improving race and ethnicity (hereafter, race/ethnicity) data quality is imperative to ensure underserved populations are represented in data sets used to identify health disparities and inform health care policy. We performed a scoping review of methods that retrospectively improve race/ethnicity classification in secondary data sets. Following the Preferred Reporting Items for Systematic Reviews and Meta-Analyses guidelines, searches were conducted in the MEDLINE, Embase, and Web of Science Core Collection databases in July 2022. A total of 2 441 abstracts were dually screened, 453 full-text articles were reviewed, and 120 articles were included. Study characteristics were extracted and described in a narrative analysis. Six main method types for improving race/ethnicity data were identified: expert review (n = 9; 8%), name lists (n = 27, 23%), name algorithms (n = 55, 46%), machine learning (n = 14, 12%), data linkage (n = 9, 8%), and other (n = 6, 5%). The main racial/ethnic groups targeted for classification were Asian (n = 56, 47%) and White (n = 51, 43%). Some form of validation evaluation was included in 86 articles (72%). We discuss the strengths and limitations of different method types and potential harms of identified methods. Innovative methods are needed to better identify racial/ethnic subgroups and further validation studies. Accurately collecting and reporting disaggregated data by race/ethnicity are critical to address the systematic missingness of relevant demographic data that can erroneously guide policymaking and hinder the effectiveness of health care practices and intervention.
Introduction
The use of big data sources, such as electronic health records (EHRs) and insurance claims data, are increasingly being used to monitor disease, identify health disparities, and guide health policy development in the United States.1,–4 Of concern is the quality of race and ethnicity (hereafter, race/ethnicity) data collected and reported in these big data sources and secondary health care data sets, including national administrative surveys and disease surveillance systems.5
Poor data infrastructure for collecting and reporting race/ethnicity is a form of systemic racism that perpetuates inequitable access to key health resources. Two primary factors that drive low-quality race/ethnicity data are (1) data aggregation and (2) high levels of missing data. These 2 elements are illustrated through COVID-19 data collection and reporting throughout the pandemic, which underscore the crucial role of collecting relevant demographic data (e.g., race/ethnicity) in responding to population health needs as well as key gaps in public health data infrastructure.6,–8
Race/ethnicity data aggregation conceals disparities among smaller race/ethnicity groups that may have little in common with one another.5 For example, during the first year of the pandemic, a review of COVID-19 academic and gray literature found there was limited to no COVID-19 outcome information for 3 of the 6 largest Asian American subgroups (i.e., Asian Indian, Korean, and Japanese Americans) because their data were primarily collected and reported under the aggregate racial category of Asian American.9 The limited availability of disaggregated race/ethnicity data applies not only to Asian Americans but to all racial/ethnic subgroups (e.g., Caribbean vs African Black, Latinx subgroups, Arab Americans).5,10
High levels of missing race/ethnicity data are especially problematic because previous research has shown racial/ethnic minority communities are more likely to be categorized as “missing” or “other” in EHRs and administrative data sets. Howland and Tsao11 found Asian, Pacific Islander, and Hispanic patients were often misclassified as “other” or “unknown” in an evaluation of New York State hospital discharge data. Similarly, Klinger et al.12 found that race/ethnicity for Black and Hispanic patients was frequently underreported in primary clinic EHR data. During the COVID-19 pandemic, race/ethnicity data were missing for 50% of COVID-19 cases and 22% of COVID-19 deaths at the national level in November 2020.13 As of September 2022, the proportions of missing race/ethnicity data were still high at 35% for COVID-19 cases and 15% for COVID-19 deaths13 and may be contributing to an underestimation of the COVID-19 burden among racial/ethnic minority groups.
Improving race/ethnicity data quality is imperative to ensure populations are appropriately represented in data sets used to identify and monitor health disparities and inform complex ethnical decisions about health care, policy, and resource allocation. A systematic review by Mateos14 determined that name-based methods to derive and improve race/ethnicity data were highly reliable and valid. New methods capitalizing on advances in computing (e.g., machine learning) and the availability of measures relevant to race/ethnicity identification (e.g., geocoded addresses) represent potential solutions. A similar review by Golder et al.15 recently looked exclusively at methods predicting Twitter (now called X) users’ race/ethnicity, finding minimal guidelines of when and how to best use these methods. The purpose of this scoping review is to provide an update on the available methods to predict the race/ethnicity of individuals and populations in secondary data sources. The results from this review can guide best practices for retrospective classification as well as new data collection efforts related to race/ethnicity.
Methods
We followed the Preferred Reporting Items for Systematic Reviews and Meta-Analyses (PRISMA) guidelines for scoping review.16 Whereas a traditional systematic review draws from a narrow range of quality-assessed studies to answer a precise question, a scoping review is a broader systematic method that can leverage multiple types of study designs to assess the literature and gaps in research on a given topic or question.17 For this scoping review, we aimed to identify studies describing methods that improve classification of race/ethnicity in secondary data sets. Methods for improving race/ethnicity classification were defined as any way of analyzing previously collected data that provided additional race/ethnicity information for an individual or population.
In July 2022, a trained medical librarian (T.R.) performed searches for studies without language or date restrictions in the MEDLINE, Embase, and the Web of Science Core Collection databases (Ovid Medline search strategy available in Appendix S1). Articles identified from our search were uploaded to Covidence systematic review management software. Abstracts and full-text articles were dually screened by coauthors (M.K.C., L.D., E.H., S.P., L.F., K.Y.K.), with each article receiving 2 votes, and conflicts resolved through consensus. All geographies and races/ethnicities, including components of race/ethnicity (e.g., nationality, preferred language, religion), were included. Validation studies that evaluated methods described by other articles in the review were also included.
Additional studies were identified via citations found in the introduction and discussion sections of included studies in the review as well as via citations found in studies excluded from the review for having an insufficient methods description. Additional citations were also identified via a directory website of relevant studies mentioned in an included article and through suggested citations from an expert in the field. Figure 1 shows our full PRISMA search and review flowchart. See Appendix S2 for exclusion criteria.
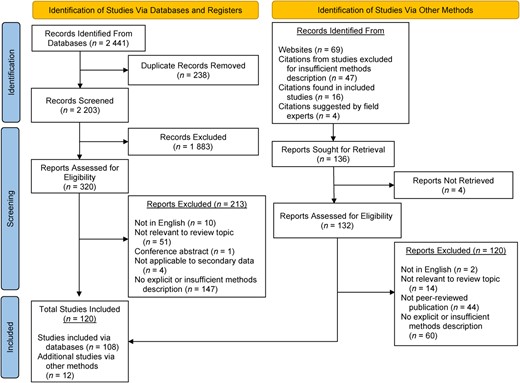
Preferred Reporting Items for Systematic Reviews and Meta-Analyses (PRISMA) flow chart. A total of 2 441 abstracts were identified via database search, and 108 articles were determined to be eligible for extraction and analysis. An additional 133 articles identified via websites and citations were assessed for eligibility and, from these, 12 more articles were added. Thus, a total of 120 articles were included in the review.
Data analysis
Data were extracted by 6 reviewers. For each article, 2 different reviewers each entered relevant extraction information into a premade REDCap survey form with designated fields of interest. Discrepancies in extraction entries were reviewed and resolved through group discussion. Extraction information included type of method used for race/ethnicity classification; races/ethnicities targeted for improvement; publication year; method inputs; reference population data (if applicable); reference population size; target population data set; target population size; and whether the article included a validation process. If a validation component was included, the gold standard measurement of race/ethnicity was documented, as well as the metrics used to evaluate the method.
Race/ethnicity reporting, which included a category for Middle Eastern or North African (MENA) populations, was informed by the Institute of Medicine’s guide for race/ethnicity standardization as well as by policy recommendations for data collection and data disaggregation, which were funded by the Robert Wood Johnson Foundation and created in partnership with the Asian & Pacific Islander American Health Forum the Arab Community Center for Economic and Social Services, the National Congress of American Indians, the National Urban League, and Unidos US.18,19
Results
Our initial search identified 2 441 abstracts. After removing duplicates (n = 238) and irrelevant abstracts (n = 1883), 320 full-text articles were assessed for eligibility. We determined that 108 articles were eligible for extraction and analysis. An additional 133 articles identified via websites and citations were assessed for eligibility, and 12 articles from these were added. Thus, a total of 120 articles were included in our review.
Method types
Table 1 describes characteristics of included literature. Method types for improving race/ethnicity classification were organized into 6 main categories: expert review, name lists, name algorithms, machine learning, data linkage, and other. Four of these 6 categories—expert review, name lists, name algorithms, and machine learning—rely on evaluating an individual’s surname and, less frequently, first name, middle name, maiden name, or name morphology, to predict or assign race/ethnicity.
Characteristics of included literature (n = 120).
| Characteristic | No. of articles | Total articles, % |
|---|---|---|
| Method type | ||
| Expert review | 9 | 8 |
| Name list | 27 | 23 |
| Name algorithm | 55 | 46 |
| Machine learning | 14 | 12 |
| Data linkage | 9 | 8 |
| Other | 6 | 5 |
| Race/ethnicity improveda | ||
| American Indian/Alaska Native | 14 | 12 |
| Asian | 56 | 47 |
| Black | 42 | 35 |
| Hispanic, Latino, or Spanish origin | 49 | 41 |
| Middle Eastern or North African | 14 | 12 |
| Native Hawaiian or Pacific Islander | 7 | 6 |
| White | 51 | 43 |
| Multiracial | 9 | 8 |
| Other | 35 | 29 |
| Publication year range | ||
| 1970–1979 | 1 | 1 |
| 1980–1989 | 3 | 3 |
| 1990–1999 | 16 | 13 |
| 2000–2009 | 37 | 31 |
| 2010–2019 | 45 | 38 |
| 2020–2022 | 18 | 15 |
| Geographic context | ||
| United States | 65 | 54 |
| United Kingdom | 16 | 13 |
| Canada | 13 | 11 |
| Australia | 5 | 4 |
| Multiple countries | 10 | 8 |
| Other | 11 | 9 |
| Reference population size | ||
| 0–99 | 0 | 0 |
| 100–999 | 0 | 0 |
| 1000–9999 | 2 | 2 |
| 10 000–99 999 | 8 | 7 |
| 100 000–999 999 | 8 | 7 |
| >1 000 000 | 10 | 8 |
| Not applicable | 92 | 77 |
| Target population size | ||
| 0–99 | 0 | 0 |
| 100–999 | 11 | 9 |
| 1000–9999 | 17 | 14 |
| 10 000–99 999 | 20 | 17 |
| 100 000–999 999 | 26 | 22 |
| >1 000 000 | 30 | 25 |
| Not applicable | 16 | 13 |
| Method validated | ||
| Yes | 86 | 72 |
| No | 34 | 28 |
a Not mutually exclusive.
Expert review
Expert-review articles (n = 9, 8%) entail methods whereby a person or group of people with expertise regarding a given race/ethnicity review an individual’s name and determine whether they belong to that race/ethnicity group. Experts frequently self-identified with the given race/ethnicity,20,–24 had scholarly expertise of the group, or had experience regularly engaging with the group.25,–27
Name list
In name-list articles (n = 27, 23%), authors classified an individual’s race/ethnicity through the use of reference lists that directly translate an individual’s surname to a corresponding race/ethnicity category. In the majority of name-list articles, race/ethnicity was assigned as a 1-to-1 translation of a designated name. Lauderdale and Kestenbaum28 and Choi et al.29 provided different surname lists based on different acceptable sensitivity, specificity, or probability likelihood cutoffs. In several name-list articles, methods were described as name algorithms or programs but fit our review’s definition of a name list.30,–32
Name algorithm
Name-algorithm articles (n = 55, 46%) improved race/ethnicity classification through a multistep sequence of instructions predetermined by the researcher, using not only surname information but other additional secondary data set variables as well. Inputs for name algorithms included first name,33,–50 maiden name,43,51 age,36,39,49,52,53 sex,36,49,54 gender,43,53,55 place of birth,34,43,51,54,56,57 parental place of birth,56,58 place of residence,36,39,41,49,52,53,55,59,–70 parental surname,56 grandparent ethnic identity,56 place of medical school graduation,71 language preference,39,40,49 and political party.72 Several studies incorporated multiple name elements such as name substrings, name morphology, first and last name character length, name consonant to vowel ratio, or surname phonemes.33,35,38,45,73,–75 Other studies used the combination of name, residential address, and conditional probabilities of a race/ethnicity group being within a given geographic boundary to estimate race/ethnicity.39,41,52,53,59,–66,68,–70,76,77
Although most articles described ways to impute race/ethnicity at an individual level, in a few, authors attempted to describe race/ethnicity at the population level.39,53,55,59,62,–64,68,–70,76,–79 For example, Grofman et al.77 described methods of using the ratio of the name “Garcia” to the name “Anderson” in a city’s telephone directory to estimate the percentage of Hispanic city residents. The Bayesian Improved Surname Geocode (BISG) method59 calculates the probability of an individual belonging to each of 6 race/ethnicity categories and then aggregates those probabilities to describe race/ethnicity distribution at a population level. More advanced evolutions of the BISG method use multinomial logistic regression models to allow for interactions between additional data elements such as age, sex, or insurance.36,39,49,80,81
Machine learning
Machine-learning articles (n = 14, 12%) reported on use of models that automatically analyzed patterns in data to infer race/ethnicity. Machine-learning methods were typically built on a training data set used to calibrate their model and then applied to a real-world data set for race/ethnicity prediction. A variety of machine-learning methods were encountered, including naïve Bayes classifiers,82,–87 C-support vector machines,82 recurrent neural network,88 decision-tree learning,89 bidirectional long short term memory,90 and network clustering analysis.91,–94 All machine-learning models used name information as the primary input variable. Machine-learning models also included name elements such as name character length, name phonemes, and name substrings.82,84,87,95 Two less common inputs included residential address82 and mother tongue.85
Data linkage
Data linkage articles (n = 9, 8%) connected individuals from 1 data set with missing race/ethnicity information to another data set with complete information. Data linkage could occur through matching variables such as name, age, gender, date of birth, social security numbers, address, and identification numbers specific to the given data system.96,–98 In some articles, probabilistic linkage algorithms calculated match probabilities for individuals with specific cutoffs.99,–101
Other
Other category articles (n = 6, 5%) included 3 articles about studies in which authors used only geocoding to assign race/ethnicity102,–104; 2 articles in which multiple imputation was used, where logistic regression modeling is used to predict missing race/ethnicity data105,106; and 1 article reporting on a study in which researchers used mother tongue and birth country to classify race/ethnicity.107
Reference population
Reference population describes the data used to develop the article’s method for predicting race/ethnicity. Table S1 provides individual article data detail. For name-based methods (excluding expert review), the reference population was frequently preexisting administrative or secondary data sets with name and race/ethnicity information.28,29,60,108,–112 In some cases, country of birth was used if race/ethnicity information was not available.28,44,58,113,114 Name-based methods were developed through sources such as ethnic telephone directories,108,115,–117 published ethnic surname dictionaries,33,35,45 baby-name books,37 and lists provided by community organizations that engaged the targeted race/ethnicity group.37,110 Several articles used name data that were created by authors combining or supplementing previously developed name lists31,37,109,110,115,–120; some name lists were cross-checked by expert reviewers with knowledge of the given race/ethnicity.27,109,110,115
There were several reference data sets consistently sourced by multiple studies in this review, including the Spanish Census Surname list, US Census, Social Security Administration data, and Medicare Beneficiary Records. The Spanish Census Surname list, which has been published every decade since 1970, was frequently used or adapted to identify Hispanic race/ethnicity.59,61,119,–124 Similarly, a surname list developed by the US Census in 2000 and 2010 for 6 aggregate race/ethnicity groups (Asian, Black, White, American Indian/Alaska Native [AI/AN], Hispanic, multiracial) was commonly cited.36,40,43,46,49,52,–55,59,62,–64,66,–70,76,80,81,125 Last, an Asian surname list for 6 Asian subgroups (Chinese, Asian Indian, Filipino, Vietnamese, Korean, Japanese) developed by Lauderdale and Kestenbaum28 referenced 1995 Social Security Administration and 1998 Medicare Master Beneficiary Records data.39,44,54,58,59,116
The majority of articles (n = 92, 77%) did not document the size of the reference data population. Ten articles (8%) reported on studies with reference population of more than 1 000 000; 8 studies (7%) had a reference population between 100 000 and 9 999 999; 8 studies (8%) had a reference population between 10 000 and 99 999; and 2 studies (2%) had reference populations between 1000 and 9999. The mean and median reference populations were 16 808 275 and 302 182, respectively, and a respective range of 1784 and 222 316 554. There were no studies with reference populations of fewer than 1000 people.
Target population
The target population included description of the data set to which the study’s method for race/ethnicity assignment was applied. The vast majority of target populations were related to public health and included cancer registries24,32,33,43,51,54,57,94,96,99,106,109,–111,117,120,126,127; population health survey samples20,21,35,39,45,49,56,63,64,73,104,116,122,124,128,129; surveillance data26,47,68,74,93,105; vital records27,29,–31,34,41,81,91,97,119,121,130,–132; health care data36,40,42,52,53,55,58,60,61,71,102,108,112; and EHR data.23,37,42,44,65,66,80,98,100,101,115,118,133,134 In several studies, researchers applied methods to internet-based sources such as email databases, Wikipedia, or Twitter.38,50,84,89 Other methods were applied to targeted voter,69,72,90,125,135 economic,22,25,76,83 telephone directory,75,136 or census data.28,82,85,92,137
We reviewed 30 articles (25%) reporting on studies in which classification improvement methods were applied to data set populations of 1 000 000 people or more; 26 articles (22%) reported on populations between 100 000 and 9 999 999 people; 20 articles (17%) on populations between 10 000 and 99 999 people; 17 articles (18%) on populations between 1000 and 9999 people; and 11 articles (9%) reported on populations between 100 and 999 people. The median and mean target population sizes were 137 632 and 7 276 199, respectively, with a range of 109 to 222 316 554. Sixteen articles (14%) did not describe the target population size.
Race/ethnicity
Among aggregate race/ethnicity categories, the most frequently targeted grouping was Asian (n = 56, 47%), followed by White (n = 51, 43%); Hispanic, Latino, or Spanish origin (n = 49, 41%); Black (n = 42, 35%); Native Hawaiian or Pacific Islander (n = 7, 6%); AI/AN (n = 14, 12%); MENA (n = 14, 12%); multiracial (n = 9, 8%); and other (n = 35, 29%).
Publication year
Articles in the review were published between 1972 and 2020. The majority of articles were published between 2010 and 2019 (n = 45, 38%), followed by 2000–2009 (n = 37, 34%), 2020–2022 (n = 18, 15%), 1990–1999 (n = 16, 14%), 1980–1989 (n = 3, 3%), and 1970–1979 (n = 1; 1%).
Geographic context
Studies in the reviewed articles predominantly applied improved classification methods to secondary data sets from the United States (n = 65, 55%), United Kingdom (n = 16, 14%), Canada (n = 13, 11%), and Australia (n = 5, 4%). Other data sets were from Germany and the Netherlands (referenced in 2 studies each [1%]), and New Zealand, Peru, Kenya, Nepal, Brazil, Malaysia, and France, all referenced in 1 study (1%) each. Ten articles (8%) used data sets sourced from multiple countries.
Validation
Table 3 summarizes characteristics of studies with a validation process. A total of 86 articles (72%) reported some form of validation evaluation in the study method. Among studies that included a validation process, the majority used self-report race/ethnicity as their gold standard (n = 63, 73%). Other gold standard measures included country of birth (n = 9, 11%), race/ethnicity reported by a second party (n = 8, 9%), parent’s race/ethnicity (n = 4, 5%), parent’s country of birth (n = 4, 4%), preferred language (n = 2, 2%), nationality (n = 2, 2%), self-reported religion (n = 2, 2%), grandparent’s country of origin (n = 1, 1%), or panel review of surname (n = 1, 1%). Three articles (3%) reported use of databases with affiliated race/ethnicity or nationality but were not clear about how those values were assessed. Some articles used more than 1 gold standard measure for validation.
Table 2 delineates the 102 unique race/ethnicity categories targeted for classification improvement in the reviewed articles. In most studies on improving classification for Asian race/ethnicity categories, researchers attempted to classify Asian subgroups (n = 44 of 56 articles), whereas studies targeting other aggregate race/ethnicity categories frequently did not classify subgroups. Notably, the majority of unique, targeted, White subgroup categories were from 1 article.115
Unique target race/ethnicity categories.a
| Unique target race/ethnicity category | No. of articlesb |
|---|---|
| American Indian/Alaska Native | |
| American Indian/Alaska Native | 13 |
| Quechua | 1 |
| Asian | |
| Chinese | 24 |
| South Asian | 17 |
| Japanese | 11 |
| Asian | 10 |
| Indian | 10 |
| Vietnamese | 9 |
| Korean | 8 |
| Filipino | 5 |
| East Asian | 4 |
| Pakistani | 4 |
| Bangladeshi | 3 |
| Southeast Asian | 3 |
| Indo-Caucasian | 1 |
| Malaysian | 1 |
| Nepali | 1 |
| Sri Lankan | 1 |
| Tibeto-Mongolian | 1 |
| West Asian | 1 |
| Black | |
| Black | 30 |
| African | 6 |
| African American | 2 |
| Kalenjin | 2 |
| Kikuyu | 2 |
| Caribbean | 1 |
| Kisii | 1 |
| Luo | 1 |
| Hispanic/Latino/Spanish origin | |
| Hispanic/Latino | 42 |
| Cuban | 1 |
| Mexican | 1 |
| Portuguese/Spanish | 1 |
| Puerto Rican | 1 |
| South and Central American | 1 |
| Middle Eastern/North African | |
| Arab | 8 |
| Middle Eastern/North African | 5 |
| Israeli | 1 |
| Iranian | 1 |
| Native Hawaiian/Pacific Islander | |
| Aboriginal | 3 |
| Indigenous | 1 |
| Maori | 1 |
| Moluccan | 1 |
| Pacific Islander/Native Hawaiian | 1 |
| White | |
| White | 31 |
| Italian | 7 |
| Irish | 5 |
| German | 5 |
| Polish | 4 |
| Russian | 4 |
| European | 4 |
| Nordic | 3 |
| French | 3 |
| Celtic/English | 3 |
| British | 2 |
| Czech | 2 |
| Dutch | 2 |
| Estonian | 2 |
| Greek | 2 |
| Hungarian | 2 |
| Latvian | 2 |
| Lithuanian | 2 |
| Scottish | 2 |
| Slovak | 2 |
| Slovene | 2 |
| Swedish | 2 |
| Armenian | 1 |
| Bosnian/Macedonian | 1 |
| Bulgarian | 1 |
| Danish | 1 |
| Dutch/Flemish | 1 |
| Finnish | 1 |
| Iberian | 1 |
| Norwegian | 1 |
| Portuguese | 1 |
| Romanian/Moldavian | 1 |
| Romany | 1 |
| Serbian | 1 |
| Slavic | 1 |
| Swiss/Romansch/Tyrolean | 1 |
| Ukrainian | 1 |
| Welsh | 1 |
| Other | |
| Asian/Pacific Islander | 19 |
| Other | 12 |
| Multiracial | 11 |
| Turkish | 3 |
| Jewish | 2 |
| Surinamese | 1 |
| Native vs foreign-bornc | 1 |
| Languages | |
| Punjabi | 3 |
| Bengali | 2 |
| Gujarati | 2 |
| Hebrew | 2 |
| Hindi | 2 |
| Urdu | 2 |
| Ashkenazi/Yiddish | 1 |
| Spanish | 1 |
| Religion | |
| Muslim | 7 |
| Sikh | 5 |
| Christian | 1 |
| Ismaili | 1 |
| Greek Orthodox | 1 |
a The 77 target nationality categories from Jun et al.88 not included.
b Not mutually exclusive.
c Native vs Foreign Born in the United States.
Validation studies (n = 86).
| Validation characteristic | No. of articles | Total validation articles, % |
|---|---|---|
| Gold standard characteristica | ||
| Race/ethnicity (self-report) | 63 | 73 |
| Country of birth | 9 | 10 |
| Parents’ country of birth | 3 | 3 |
| Race/ethnicity (second-party report) | 8 | 9 |
| Language | 2 | 2 |
| Other | 13 | 15 |
| Evaluation metrica | ||
| Sensitivity | 54 | 63 |
| Specificity | 46 | 53 |
| Positive predictive value | 41 | 48 |
| Negative predictive value | 23 | 27 |
| Race/ethnicity distribution comparison | 14 | 16 |
| Area under the curve for receiving operating characteristic | 12 | 14 |
| κ Statistic | 13 | 15 |
| Correlation coefficient | 10 | 12 |
| F score | 5 | 6 |
| Accuracy | 9 | 10 |
| Other | 12 | 14 |
a Not mutually exclusive.
The most common evaluation metric for validation studies was sensitivity (n = 54, 63%) followed by specificity (n = 46, 53%), positive predictive value (n = 41, 48%), and negative predictive value (n = 23, 27%). In 14 articles (16%), researchers compared population distributions between method-assigned race/ethnicity and gold standard race/ethnicity. In 12 articles (14%), researchers calculated area under the curve for the receiving operating characteristic, and in 13 articles (15%), κ statistics were calculated. In 10 articles (12%), the average correlation coefficient between predicted race/ethnicity probability and self-reported race/ethnicity was measured. Bias was calculated in 5 articles (6%). Five articles (6%) reported F-score statistics and another 9 (10%) articles reported accuracy. Less common evaluation metrics included average squared error ratios (n = 1, 1%), precision (n = 5, 6%), recall (n = 5, 6%), false-positive rate (n = 1, 1%), false-negative rate (n = 1, 1%), and positive likelihood ratio (1, 1%).
Discussion
In this scoping review, we investigated the literature published on methods to improve classification of race/ethnicity in secondary data sets. We identified 6 main method types for classifying race/ethnicity data: expert review, name lists, name algorithms, machine learning, and data linkage. Each of the 5 main method types identified in our review had advantages and disadvantages (Table 4).
Method type strengths and limitations.
| Method type | Method type strengths | ||||
|---|---|---|---|---|---|
| Development requires minimal technical expertise | Appropriate for large data sets | Targets smaller race/ethnicity groups | Transferrable to other populations | Targets multiple race/ethnicity groups | |
| Expert review | +a | –b | + | − | − |
| Name lists | + | + | − | + | − |
| Name algorithms | − | + | − | + | + |
| Machine learning | − | + | + | − | + |
| Data linkage | − | + | + | − | + |
a + The described Strength is applicable to the given Method Type.
b – The described Strength is not applicable to the given Method Type.
Strengths and limitations by method
Expert review
Expert review requires minimal technical expertise to apply to data sets, which may make this approach ideal for smaller race/ethnicity groups that lack validated name lists or name algorithms and for projects with limited funding to develop their own name list or algorithm. Expert-review methods also include validation components with moderate to high sensitivities for improving race/ethnicity.20,21,45 A major disadvantage is it requires time for individual coders to review the population of interest and may only be appropriate for smaller or mid-sized data sets.
Name list
Name-list methods can be developed from the simple compilation of names from ethnic phone books and baby-name dictionaries to the more complex calculation of each listed name’s predicted race/ethnicity probability.28,29 Name lists can be programmed to assign race/ethnicity for large data sets and require fewer resources to develop than more advanced name algorithms. With a few exceptions,28,113,115 a disadvantage of name-list methods is they are often designed to improve race/ethnicity classification for 1 target race/ethnicity.
Name algorithms
Name algorithms frequently require more technical expertise to incorporate additional variables when predicting race/ethnicity. Name algorithms using Bayes theorem to estimate the conditional probability of a race/ethnicity, when given name and geocoded location data, perform with higher accuracy and better coverage than either variable alone.59,60 Evidence suggests using smaller geocode units in name algorithms, such as census block code versus zip codes, improves race/ethnicity prediction accuracy.70 Notably, Bayesian name algorithms that impute race/ethnicity probabilistically at the population level vs deterministically at the individual level are more accurate and less biased.46,60,70,138 The BISG method is a Bayesian name algorithm endorsed by the National Academy of Medicine, the National Committee for Quality Assurance, and National Quality Forum, and is used by health plans like Kaiser Permanente, Cigna, Aetna, and the Centers for Medicaid and Medicare Services.60 When compared with traditional multiple imputation methods, the BISG method further reduces bias in nonrandom missing race/ethnicity data,66 and incorporation of first names into the BISG improves prediction accuracy.76 A few studies have found that BISG-informed multinomial logistic regression models that use additional variables such as age, sex, and insurance perform better than BISG alone.36,39,80,81 There is also some evidence that models trained on state-specific name data perform better than models built on nationwide census surname lists.80 A limitation of the BISG method is it targets only 6 aggregate race/ethnicity groups: Asian/Pacific Islander, Black, White, AI/AN, Hispanic, and multiracial, and must be applied to a large population to accurately predict race/ethnicity distributions.60
Machine learning
In contrast, machine-learning approaches frequently target a more diverse set of race/ethnicity subgroups. For example, Jun et al.88 trained their algorithm to impute data for 77 nationalities. Machine-learning methods are frequently developed from and applied to large data sets drawn from multiple countries, providing wider coverage and potentially more accurate prediction of different race/ethnicity groups. Nonetheless, a disadvantage to machine-learning methods is they are less flexible than name lists or name algorithms to being updated to changing demographic name trends, because they require their entire structure to be rebuilt for pattern detection.92 Machine-learning approaches may also have limited transferability to other populations if the model is overfit to training data; this is particularly notable because many machine-learning methods are developed from scraped internet data sources, such as Twitter or Wikipedia.84,86,87,89 The applicability of machine-learning methods developed from large web-based sources to more localized data sets remains unclear.
Data linkage
Data linkage methods can connect individual-level data with limited or missing race/ethnicity to gold standard, self-reported race/ethnicity measures. However, these methods are only relevant when a linkable data set with race/ethnicity information are available. Interestingly, 5 of the 8 data linkage articles targeted AI/AN or Aboriginal populations for race/ethnicity improvement.97,99,–101,137 This may be related to the structure of Indigenous or Native data systems in the United States and Australia but is notable because name-list and name-algorithm methods have been reported to be poor at predicting race/ethnicity for this population.60,76
Potential harms of reviewed methods
Across all methods for predicting race/ethnicity, there is potential for harm, particularly against communities of color, related to implicit and explicit biases from the reclassification of race/ethnicity. Among name-based methods (i.e., expert review, name lists, name algorithms, machine learning), not all race/ethnicity groups are equally distinguishable from name information alone. In the United States, AI/AN, Black, and multiracial names are particularly challenging to differentiate.60,139 As noted by Kozlowski et al.,46 using name methods that attempt to predict race/ethnicity for multiple groups can lead to underestimation of groups with poor prediction, particularly among Black populations. This is exacerbated for name-based methods assigning race/ethnicity at the individual level using probability threshold cutoffs. Because some names are associated with more than 1 race/ethnicity group, such as “Lee”, deterministically assigning a name to a race/ethnicity above a given probability threshold or to the race/ethnicity group with the highest probability underestimates other race/ethnicity groups that may be associated with that name but to a lesser degree.46,60,138 Methods that indirectly estimate the distribution of multiple race/ethnicity groups at the population level can mitigate bias by aggregating the probabilities of each individual in the given cohort population being classified into each potential race/ethnicity group.46,60,70 Factors such as cultural integration, intermarriage, adoption, and name change can also further confound name-based race/ethnicity predictions.14,28,139
Another source of bias could be related to the dynamic nature of how race/ethnicity categories are defined. At both individual and institutional levels, race/ethnicity groupings are not static. How individuals self-identify their race/ethnicity changes over a 10-year period, particularly among Al/AN, Native Hawaiian, Pacific Islanders, and multiracial persons.140 Similarly, since its inception, the US Census race/ethnicity categories have evolved, influenced by political attitudes, advocacy, and immigration, and can influence how individuals choose to self-identify.141 Methods included in this review assume that patterns of racial/ethnic self-identity and classification are consistent across both the reference populations used to develop the method and target populations to which the method is being applied. Both underestimation and overestimation of predicted race/ethnicity groups can occur depending on how trends of self-identification vary.
The nature of racial/ethnic groups is also rooted in a history of racial/ethnic stratification.142 The categorization of people into US Census race/ethnicity groups, originally developed to scientifically reinforce the dominance of the White racial/ethnic class, carries the potential of reinforcing and perpetuating inequities through stigmatizing and pathologizing racial/ethnic minority groups.142 There is an increasing amount of literature calling on researchers to move beyond the documentation of racial/ethnic health disparities, to antiracist praxis that emphasizes the examination of the effects and pervasiveness of racial structures within oppressive systems like health data systems143 and the operationalization and measurement of structural racism.144 Racial/ethnic disparities in health and health care use manifest as a result of inequitable access to social and economic resources and experiences of racism at the individual and structural levels. Contextualizing health data with respect to these determinants rather than race/ethnicity may better represent the underlying mechanisms that drive disparities and help minimize theories of biological inferiority and discriminatory behavior.
Last, across all methods, identification of race/ethnicity can be sufficient to reveal an individual’s identity, particularly among racial/ethnic minority groups. Researchers must be cautious when reporting race/ethnicity for small population cohorts. Recent computer science research has also raised concerns of how machine-learning models memorize training data.145,146 Findings have suggested machine-learning models trained on health care data sets can be made to reveal individual-level health information, particularly among patients with outlier characteristics among the trained population data.145,146
Looking forward
In the United States, the widely adopted BISG algorithm could be further adapted to improve race/ethnicity classification for racial/ethnic subgroups. The release of updated Census surname lists for disaggregated race/ethnicity categories from the 2020 Census provides an opportunity to improve the BISG. However, it is unclear when the Census plans to release the updated disaggregated name list; prior lists have been released 6 to 7 years after a decennial Census. Another method would be to leverage other race/ethnicity name lists such as those for Asian or MENA subgroups.28,30,126 Name lists for these populations have been validated and may be able to provide similar race/ethnicity probability estimates.
Although this review provides guidance regarding the strengths and limitations of extant methods for improving race/ethnicity data quality in secondary data sets, there is still a need for more validation studies to quantitatively assess which methods are best and under what circumstances. There is especially limited research on how name algorithms compare with machine-learning methods. Kandt and Longley92 compared their name algorithm’s performance with the machine-learning project Onomap, analyzing 2011 UK Census data, and they found each performed best for different race/ethnicity groups. Research evaluating name-algorithm and machine-learning methods’ performance could provide insight to the tradeoffs between the 2 methods.
This review focused on how to retrospectively improve racial/ethnic data quality; however, future work should also focus on the prospective improvement of data collection and reporting of racial/ethnic and other demographic information at the local, state, and national levels, and should interrogate other measures of personal and structural racism’s influence on health. Racial/ethnic disparities exist even if data do not; improving race/ethnicity data quality, both retrospectively and prospectively, while also exploring the intersectional effects of race/ethnicity, socioeconomic status, and racism, is important.
Study limitations
We did not contact the primary researchers of studies that were excluded, because they provided limited or no descriptions of their race/ethnicity classification method. There may be studies with race/ethnicity classification methods that were not included. We also only included articles that were in English and this may undercount methods to improve race/ethnicity used in other countries. Additionally, our search did not specifically include “Twitter” in our keywords and did cover the same articles as the review by Golder et al.15; notably, we did not include articles that inferred race/ethnicity on the basis of an individual’s photograph or physical appearance.
Conclusion
We provide an overview of ways to improve race/ethnicity data quality in administrative and secondary data sets that can aid researchers in selecting the best method based on resource and data input availability. Findings emphasize the need for innovative methods to better identify race/ethnicity subgroups and additional validation research comparing more advanced approaches. This information is critical to addressing the systematic missingness of relevant demographic data and perpetual failure to accurately and efficiently collect and report disaggregated data by race/ethnicity that can erroneously guide policy decisions on funding and resource allocation and hinder the effectiveness of health care practices and intervention.
Acknowledgments
Presented in part at the American Public Health Association 2022 Annual Meeting and Expo, Boston, Massachusetts, November 6–9, 2022.
Supplementary material
Supplementary material is available at Epidemiologic Reviews online.
Funding
The research described in this article is supported by grants U54MD000538 from the National Institutes of Health (NIH) National Institute on Minority Health and Health Disparities; R01HL141427 from the NIH National Heart, Lung and Blood Institute; and NU38OT2020001477 from the Centers for Disease Control and Prevention (CDC) and New York State (NYS).
Conflict of interest
The authors declare no conflicts of interest.
Disclaimer
The contents of this publication are solely the responsibility of the authors and do not necessarily represent the official views of the NIH, the CDC, or NYS.
Data availability statement
The data set is available from the corresponding author.
References
Brown A.“
