


Abstract
Physiologic stress elicits impairment of reproductive function, in part, by the suppression of luteinizing hormone (LH) secretion. Two populations of kisspeptin-synthesizing neurons in the hypothalamus play essential roles in controlling the pulsatile and surge modes of LH secretion and are potential direct targets of stress-activated neural circuits; however, the mechanism(s) for impairment of kisspeptin cells during stress remain unclear. Here, we conducted 4 experiments to test the hypothesis that corticotropin-releasing hormone receptor 2 (CRHR2) signaling contributes to impaired pulsatile and surge LH secretion via direct actions on kisspeptin cells. First, we observed that cells expressing a specific ligand of CRHR2, urocortin 2 (UCN2), show enhanced c-Fos in the paraventricular nucleus (PVN) following acute hypoglycemia, a metabolic stressor that rapidly suppresses LH pulses by impairing arcuate kisspeptin neuron activation. Second, we determined that central injection of UCN2 rapidly inhibits LH pulses. Furthermore, UCN2 disrupts evening expression of the estradiol-induced LH surge and reduces kisspeptin cell activation in the rostral periventricular hypothalamic region (RP3V). Next, we identified CRHR2 in a majority of both arcuate and RP3V kisspeptin cells. Finally, we observed that UCN2 cells in the PVN are activated following chemogenetic stimulation of catecholamine neurons in the nucleus of the solitary tract. Together these data demonstrate that UCN2-CRHR2 signaling disrupts the pulsatile and surge modes of LH secretion via direct suppression of kisspeptin cells. Furthermore, these findings suggest UCN2 cells in the PVN are regulated by metabolic stress and brainstem norepinephrine signaling pathways that convey stress cues to the hypothalamus.
A common response to stress both in males and females is a temporary suppression of reproductive function, mediated in part by impaired pulsatile luteinizing hormone (LH) secretion (1). One population of neurons in the arcuate nucleus (ARC) responsible for organizing the secretion of LH pulses, termed KNDy neurons (2, 3), has been implicated as a neural site conveying inhibition of LH during stress (4, 5). These cells are named for the coexpression of 3 neuropeptides: kisspeptin, neurokinin B, and dynorphin (6). Another population of kisspeptin cells reside in the rostral periventricular area of the third ventricle (RP3V) and are critical for responding to elevated estradiol and inducing the preovulatory LH surge in female mice (7). In parallel to KNDy neurons being a stress-sensitive node, suppressed RP3V kisspeptin expression or cell activity is associated with blockade of the estradiol-induced LH surge in response to chronic undernutrition (8). The pathways by which KNDy or RP3V kisspeptin cells become inhibited in response to stress, however, remain a substantial outstanding question.
Over the past several decades numerous central signaling molecules have been identified as playing a mediatory role in the suppression of LH secretion during stress. One such molecule that has received considerable attention is corticotropin-releasing hormone (CRH), which binds to CRH receptor type 1 (CRHR1), likely due to its role in enhanced activity of the hypothalamic-pituitary-adrenal axis, a key component of stress responses (9). Beyond CRH and CRHR1, mounting evidence suggests the role of additional CRH-like ligands. For instance, CRH receptor type 2 (CRHR2) is a closely related G protein–coupled receptor, encoded by a separate gene, yet sharing approximately 70% homology with CRHR1 (10). The ligands for CRHR1 and CRHR2 comprise the CRH family of peptides, which include CRH and 3 urocortin (UCN) peptides, termed UCN1, UCN2, and UCN3. Importantly, CRHR1 and CRHR2 are selective for different members of this peptide family; CRH binds CRHR1 exclusively, whereas UCN1 binds both CRHRs with approximately equal affinity, and UCN2 and UCN3 are highly selective for CRHR2 (11).
A few lines of evidence suggest the importance of CRHR2 in regulation of reproductive neuroendocrine function during stress. First, a CRHR2 antagonist, but not an antagonist for CRHR1, was shown to ameliorate the suppressive effect of either insulin-induced hypoglycemia or lipopolysaccharide (reactive stress types) on pulsatile LH secretion in female rats; interestingly, either a CRHR1 or CRHR2 antagonist blunted the suppression in LH in response to psychosocial stress via restraint (12). Additionally, Ucn2 messenger RNA (mRNA) has been shown to be upregulated in the paraventricular nucleus (PVN) following psychosocial or reactive stress types (13) and central infusion of UCN2 was sufficient to suppress LH pulses in female rats (14). Although these studies demonstrate a putative role for UCN2-CRHR2 signaling to inhibit LH, several substantial questions about the anatomy and functionality of this neuroendocrine circuit remain.
Here, we conducted a series of studies in ovariectomized (OVX) female mice (pulse model) or OVX mice administered a surge-inducing estradiol stimulus (surge model) to investigate the possibility that UCN2-CRHR2 signaling contributes to stress-induced suppression of gonadotropin secretion. First, we examined activation of UCN2 neurons in the PVN (PVNUCN2) during acute metabolic stress, modeled with insulin-induced hypoglycemia, a stressor that potently inhibits arcuate kisspeptin cell activation and reduces LH pulsatile secretion (4). Second, we tested the sufficiency of UCN2 to suppress either pulsatile or surge LH secretion in nonstressed mice. Then, to determine if UCN2 could act directly on kisspeptin cells, we assessed the expression of CRHR2 protein or Crhr2 mRNA within arcuate or RP3V kisspeptin cell populations. Finally, to explore a putative mechanism by which PVNUCN2 cells become engaged during stress, we assessed activation of these neurons following chemogenetic stimulation of catecholamine neurons in the nucleus of the solitary tract (NTS), a cellular population responsive to acute and chronic models of metabolic stress (15-17).
Materials and Methods
Animals
Adult (aged >12 weeks) female mice (wild-type C57BL6 [Envigo] as well as 3 transgenic lines: Kiss1CreGFP (18), Kiss1hrGFP (19), and dopamine β-hydroxylase [DBH] Cre (20), all on the C57BL6 background) were maintained under a 12:12-hour light/dark photocycle (lights on at 6 Am) in a vivarium at UC San Diego. Animals had free access to water; feed (irradiated chow No. 2920X, Harlan) was also freely available, except during 5-hour fasting periods described in experiment 1. Mice were OVX via mid-lumbar laparotomy under isoflurane anesthesia with sterile technique. In experiment 2, a subset of mice received a subcutaneous implant containing estradiol (paradigm known to induce an LH surge; see experiment 2) at time of OVX. Analgesia was provided with buprenorphine. For experiment 2, mice were handled daily for acclimatization to blood sampling procedures, as described previously (21). All animal procedures were approved by the UC San Diego Institutional Animal Care and Use Committee and in accordance with the National Institutes of Health guidelines for the care and use of research animals.
Experimental Design
Experiment 1: Does acute hypoglycemia induce activation of urocortin 2 cells in the paraventricular nucleus?
Tissue containing the PVN, collected during recently published work (4), was used here. As detailed in McCosh et al (4), female C57B6 mice were randomly assigned to 3 groups: free access to feed with intraperitoneal (i.p.) saline injection (fed + saline), 5-hour fast followed by i.p. saline injection (fasted + saline), and 5-hour fast followed by i.p. insulin injection (fasted + insulin; 0.75mU/g, Humilin R, NDC 0002-8215-01). Fixed neural tissue was collected 2 hours after saline or insulin injection; n = 6-9 for each group.
One series of tissue containing the PVN was processed for dual-label immunohistochemistry (IHC) for UCN2 and c-Fos. Since both antibodies were produced in rabbit, we used a tyramide amplification approach for the first label (ie, UCN2) (22). All steps were performed at room temperature with gentle rocking, unless noted otherwise. First, tissue was rinsed in phosphate buffer and phosphate-buffered saline (PBS), and then incubated in heated antigen retrieval solution (Citra buffer, Fisher NC9935936) for 10 minutes, twice. The tissue was then rinsed 4 times in PBS, 5 minutes each (standard washing step), and placed in 1% hydrogen peroxide in PBS for 10 minutes and rinsed again. The tissue was then placed for 1 hour in protein block solution, PBS + 0.4% triton X-100 with 4% normal goat serum (Jackson Immunolabs), and then incubated in rabbit anti-UCN2 (Thermo; PA5-76952, RRID: AB_2720679) diluted 1:2000 in protein block solution for 18 hour at 4°C. The tissue was then incubated in each of the following, with wash steps between: biotinylated goat anti-rabbit immunoglobulin G (IgG) (1:500 in protein block solution for 1 hour, Vector Labs, BA-1000), ABC-elite kit (1:500 in PBS for 1 hour, Vector Labs, PK-6100), biotinylated tyramide (1:250 in PBS with 0.003% H2O2 for 10 minutes, Akoya Biosciences, SAT70001EA), and streptavidin-conjugated Alexa 647 (1:200 in PBS for 30 minutes, Invitrogen, S21374). Tissue was transferred to protein block solution for 1 hour, and then into rabbit anti-c-Fos (Cell Signaling, Clone 9F6, No. 2250, RRID: AB_2247211) diluted 1:1000 in protein block solution for 18 hour at 4°C. Finally, tissue was incubated in goat anti-rabbit IgG conjugated to DyLight 488 (Invitrogen, 35552) for 18 hour at 4°C, rinsed in PB, and then mounted on glass slides and cover-slipped with gelvatol (23). The c-Fos antibody has been used extensively in mouse neural tissue, by our group and others (15, 24, 25). Validation of the UCN2 antiserum included 1) confirmation of a product with apparent molecular weight of approximately 26 kDA by Western blot, as documented previously (26); 2) demonstration of staining within the PVN and ARC, similar to previous reports (27); and 3) demonstration that preadsorption of the antibody with UCN2 peptide (provided by the manufacturer) eliminated staining (Fig. 1A and 1B). Moreover, spurious secondary antibody staining can be ruled out by the lack of cytoplasmic (UCN2-like) staining in the Green/DyLight 488 channel (Fig. 2).
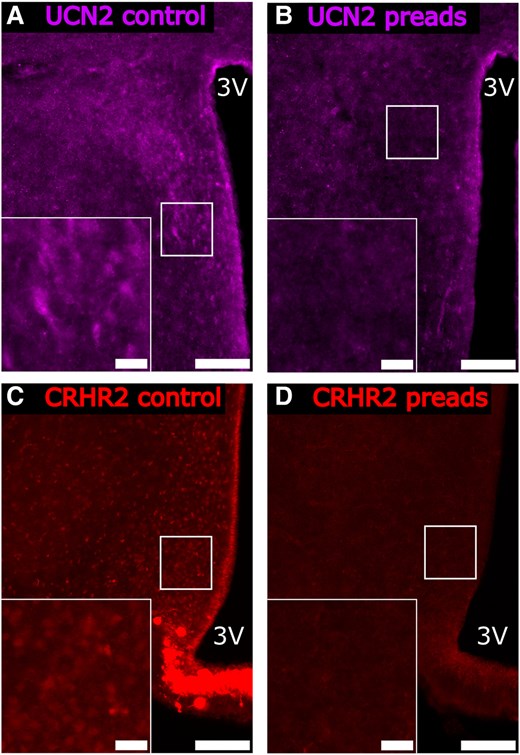
Representative photomicrographs of preadsorption control experiments for the (A and B) anti-UCN2 and (C and D) anti-CRHR2 antibodies. Antiserum samples were incubated for 24 hours with (A and C) phosphate-buffered saline or with (B and D) the corresponding control peptide according to manufacturer's suggestions at 4°C, before proceeding with immunostaining. Main panel scale bar: 50 µm, Inset panel scale bar: 10 µm, 3 V, third ventricle.

Representative photomicrographs of dual-labeled UCN2 and c-Fos cells in the PVN of OVX mice that were (A to C) fed and i.p. injected with saline; (D to F) fasted and i.p. injected with saline; or (G to I) fasted and i.p. injected with insulin. Panels represent (A, D, and G) UCN2-labeled cells; (B, E, and H) c-Fos-labeled cells; and (C, F, and I) merged images in fixed neural tissue collected 2 hours following saline or insulin. Arrows denote single-labeled UCN2 cells. Arrowheads denote dual-labeled UCN2 cells with c-Fos. White box indicates location of zoomed panels. Main panel scale bar: 50 µm, inset panel scale bar: 10 µm, 3 V, third ventricle. Bar graphs represent average values across hemisections per animal (mean ± SEM, n = 6-9/group) for J, number of PVN UCN2 cells; K, number of PVN c-Fos cells; and L, percentage of PVN UCN2 cells that contain c-Fos. Unique letters signify statistically significant differences between values (P < .05).
Experiment 2: Does intracerebroventricular urocortin 2 suppress luteinizing hormone pulses or the estradiol-induced luteinizing hormone surge?
Luteinizing hormone pulses
Female C57B6 mice were randomly assigned to receive a free-hand i.c.v. injection (28) (3 µL) of saline, or 1 of 3 doses of UCN2: 0.0723 nmol, 0.723 nmol, or 7.23 nmol (UCN2 in saline; Bachem, 4048157.1000). Free-hand i.c.v. injection involves piercing a small hole in the skull the day prior to the experiment, then passing a needle through the hole to make the injection the day of the experiment. Tail-tip blood samples (3.2 µL) were collected at 6-minute intervals for 54 minutes before and from 30 to 84 minutes after i.c.v. injection. The 30-minute pause in blood sampling after i.c.v. injection allowed mice to recover from isoflurane anesthesia before the resumption of blood sampling. Fresh-frozen neural tissue was collected after the cessation of blood sampling and sectioned to confirm the injection site targeted the lateral ventricle. Animals with missed injections or that had one or fewer pulses in the preinjection sampling period were excluded from analysis. Final analysis included 5 animals for each group.
Luteinizing hormone surge
At time of OVX, female C57BL6 or Kiss1hrGFP mice were implanted subcutaneously with a silastic capsule (0.125 in. I.D.×0.078 in. O.D.) filled with 1.0-µg 17-β estradiol dissolved in sesame oil (29). Under this hormonal milieu, female mice will produce a daily circadian-timed LH surge, occurring each evening exclusively around the time of lights off (6 Pm in our vivarium) (30). Forty-eight hours later (∼10 Am), mice received a free-hand i.c.v. injection of saline or 7.23 nmol UCN2. Preceding lights off, a single tail-tip blood sample (6.4 µL) was collected followed by the collection of frozen or fixed neural tissue (in the cohort of Kiss1hrGFP mice) to confirm the injection site. Final analysis included 7 to 9 animals/group for LH analysis and 4 or 5 animals/group for Kiss1(GFP) and c-Fos IHC.
For IHC detection of Kiss1(GFP) and c-Fos, one series of tissue containing the RP3V was processed from Kiss1hrGFP female mice, in which green fluorescent protein (GFP) is expressed under the Kiss1 promoter, per our published methods (8, 15). Following antigen retrieval and washing (described earlier), the tissue was placed in protein block solution for 1 hour, followed by incubation in blocking solution containing rabbit anti-c-Fos (1:1000, Cell Signaling, Clone 9F6, No. 2250, RRID: AB_2247211) for 18 hours at 4°C. Tissue sections were washed and incubated in goat anti-rabbit conjugated to Alexa 647 (Life, A-21245) for 30 minutes at room temperature. Tissue was washed, placed in blocking solution for 1 hour, and then in rabbit anti-GFP conjugated to Alexa 488 (Life, A21311, RRID:AB_221477) in blocking solution for 18 hours at 4°C. Tissue was then washed in 0.1 M PB, mounted on SuperFrost slides, and cover-slipped with ProLongGold (Invitrogen).
Experiment 3: Do kisspeptin cells contain corticotropin-releasing hormone receptor 2?
Fixed neural tissue was collected from female Kiss1CreGFP mice, in which Cre-recombinase is driven by Kiss1 regulatory elements and allows Kiss1 neurons to be identified by Cre-mediated expression of GFP, per our published methods (4). One series of tissue containing the ARC (n = 4) or RP3V (n = 3) was processed through antigen retrieval and washing (described earlier). The tissue was then placed in protein block solution for 1 hour and incubated in rabbit anti-CRHR2 (Thermo; 720291, RRID: AB_2633243) diluted 1:800 in protein block solution for 18 hour at 4°C. The tissue was then incubated in goat anti-rabbit IgG conjugated to Alexa 555 (Invitrogen A32732) diluted 1:200 in protein block solution for 30 minutes. The tissue was then washed, placed in protein block solution, and then in rabbit anti-GFP conjugated to Alexa 488 (1:1000 in protein block solution) for 18 hours at 4°C. Finally, tissue was rinsed in PB, mounted on glass slides, and cover-slipped with gelvatol. The CRHR2 antibody identified a single band in the range of approximately 48 to 63 KDa (a molecular weight previously confirmed (31)), yielded a distribution of staining in the brain as expected (ie, PVN and ARC) (32, 33), and preadsorption of the antibody with the peptide (provided by the manufacturer) blocked specific staining (Fig. 1C and 1D).
RNAscope was used to confirm detection of Kiss1 and Crhr2 in the ARC of C57BL6 female mice (n = 4). For fresh-frozen tissue collection, mice were anesthetized with isoflurane and decapitated. The brain was rapidly dissected and collected onto dry ice, then stored at −80°C. Tissue was cut at 20 µm in 5 series directly onto SuperFrost slides and stored at −80°C until RNAscope. The RNAscope Multiplex Fluorescent Reagent Kit v2 (Advanced Cell Diagnostics, 323100) was used following the manufacturer's instructions. Probes for Kiss1 (500-141) and Crhr2 (413201-C2) were used. Slides were cover-slipped with ProLongGold (Invitrogen). All slides were processed in a single assay.
Experiment 4: Does chemogenetic activation of catecholamine neurons in the nucleus of the solitary tract induce activation of urocortin 2 cells in the paraventricular nucleus?
Tissue containing the PVN, collected during recently published work (15), was used here. Briefly, OVX DBH-Cre mice received bilateral stereotaxic injections of AAV1-hSyn-DIO-hM3D(Gq)-mCherry (stimulatory designer receptors activated by designer drugs [DREADD] virus) into the NTS (NTSDBH; full details available in McCosh et al (15)). Approximately 6 weeks later, mice received an i.p. injection of saline or clozapine-N-oxide (CNO, 1 mg/kg), and fixed neural tissue was collected 2 hours later. Dual-label IHC for UCN2 and c-Fos was performed on one series of tissue, as described in experiment 1. Final analysis included 5 or 6 mice for each group.
Fixed Neural Tissue Collection and Processing
For fixed neural tissue collection for IHC, mice were deeply anesthetized with pentobarbital (FatalPlus) and perfused with 10 mL heparinized saline and 20 mL of 4% paraformaldehyde in phosphate buffer via cardiac puncture. The brain was dissected and stored in 4% paraformaldehyde overnight then transferred to 30% sucrose for at least 2 days. Brains were sectioned at 40 µm into 3 series (each section 120 µm apart) and stored at −20°C in cryopreservative solution until IHC.
Luteinizing Hormone Assay
Whole blood samples were diluted into assay buffer (1:20 for 3.2 µL samples; 1:10 for 6.4 µL samples) on ice and then transferred to −20°C until assay. LH concentrations were determined in singleton with an enzyme-linked immunosorbent assay (ELISA) validated in our laboratory (8, 34), based on the methods of Steyn et al (35). The assays for the analysis of LH pulses in experiment 2 used anti-LH antiserum from the National Hormone and Peptide Program (AFP240580Rb, RRID:AB_2665533) and from UC Davis (518B7, RRID:AB_2665514); the functional sensitivity was 0.2 ng/mL and the intra-assay and interassay coefficients of variation were 2.9% and 4.1%, respectively. A single assay was used to measure surge LH concentrations in experiment 2 and used anti-LH antiserum from Medix Biochemica (SPRN-5, RRID:AB_2784503) UC Davis (518B7, RRID:AB_2665514); the functional sensitivity was 0.0333 ng/mL, and the intra-assay coefficient of variation was 5.1%. An LH surge was defined as greater than 0.5 ng/mL, as measured in this whole-blood ELISA (morning LH values in this estradiol paradigm average 0.125 ng/mL; data not shown).
LH pulses were identified using PULSAR Otago (36) with the following parameters for OVX LH values determined by the Steyn et al (35) assay: G1: 2.2, G2: 2.7, G3:1.9, G4: 1.5, G5: 1.2, peak split: 2.5, smoothening: 0.7, amplitude distance: 2, and assay variability was quadratic: 0, linear: 2.98, constant: 0.02. Following PULSAR Otago analysis of separate pre and post sampling periods, one additional criterion was applied to identify a pulse, which included confirmation that pulse amplitude was greater than 2 times assay sensitivity. Pulse amplitude was defined as the difference between peak value and preceding nadir and calculated for each sampling period in which pulses were detected. If no pulses were detected in the post period (typical following UCN2 injection), animals were removed from the analysis of amplitude (in experiment 2, 1-3 animals were omitted in each UCN2 group). Mean LH was calculated by averaging all LH values.
Microscopy
Microscopy was performed at the Nikon imaging Center at UC San Diego. An inverted Ti-E2 microscope with a DS-Qi2 monochrome camera and 20× objective was used to capture images. The number of cells per hemisection was determined by an observer (R.B.M.) blinded to treatment using ImageJ software. IHC values represent an average of 4 hemisections per animal; RNAscope values represent an average of 6 hemisections per animal. Minor adjustments to brightness and contrast were applied equally to all images within each experiment.
Statistical Analysis
Statistical analysis was performed with JMP Pro, version 17 (SAS institute). P values less than .05 were considered statistically significant. For experiment 1, the number of UCN2 cells, c-Fos cells, and percentage of UCN2 cells that contained c-Fos were compared between groups (fed + saline, fasted + saline, fasted + insulin) with one-way analysis of variance following Box-Cox transformation (necessary due to unequal variances among groups). Data presented in Fig. 1 are the nontransformed, raw values. For experiment 2 (LH pulses), mean LH, number of pulses per 60 minutes, and average LH pulse amplitude were determined and compared among groups with 2-way analysis of variance with repeated measures (the model included dose of UCN2 [0, 0.0723 nmol, 0.723 nmol, and 7.23 nmol] and time [before vs after i.c.v. injection]). Post hoc analysis was conducted with Tukey honestly significant difference test where appropriate. For experiment 2 (LH surge), mean surge LH concentrations and the percentage of Kiss1(GFP) cells that contained c-Fos were compared between groups (saline vs UCN2) with t tests. For experiment 4, the number of UCN2 cells, c-Fos cells, and percentage of UCN2 cells that contained c-Fos was compared between groups (saline vs CNO) with t tests.
Results
Experiment 1: Does Acute Hypoglycemia Induce Activation of Urocortin 2 Cells in the Paraventricular Nucleus?
Fig. 2 shows representative images of UCN2 and c-Fos IHC within the PVN of mice from 1 of 3 treatment groups: A to C, fed + saline; D to F, fasted + saline; or G to I, fasted + insulin. The average number of UCN2 cells per hemisection within the PVN did not differ among groups (F2,20 = 1.9; P = .166; Fig. 2J); however, the number of c-Fos cells within the PVN was significantly greater in fasted + insulin mice compared to the other groups (F2,20 = 5.8; P = .010; Fig. 2K). A similar 3-fold increase in the percentage of UCN2 cells that contained c-Fos was observed in fasted + insulin mice (25.3 ± 5.1%, F2,20 = 6.6; P = .006, Fig. 2L) compared to coexpression in fed + saline or fasted + saline mice, 5.8 ± 2.8% or 7.1 ± 1.7%, respectively.
Experiment 2: Does Intracerebroventricular Urocortin 2 Suppress Luteinizing Hormone Pulses or the Estradiol-induced Luteinizing Hormone Surge?
Luteinizing hormone pulses
Fig. 3 shows representative LH pulse profiles from mice that received an i.c.v. injection of 0 (saline control), 0.0723, 0.723, or 7.23 nmol of UCN2. Group means for mean LH, number of pulses per 60 minutes, and LH pulse amplitude are shown in Fig. 4. Control mice demonstrated a robust pattern of pulsatile LH secretion that was unchanged following saline administration via i.c.v. injection. In contrast, UCN2 significantly altered LH pulsatile secretion assessed in a 54-minute window 30 minutes following i.c.v. administration. For mean LH concentrations, the analysis revealed a statistically significant time by dose interaction (F3,16 = 23.9; P < .0001), with post hoc tests confirming a significant decrease in LH concentrations following all doses of UCN2 compared to the preinjection values (Fig. 4A). For number of pulses, although a significant time by dose interaction was detected (F3,16 = 3.89; P = .029), post hoc tests revealed a significant difference between preinjection and postinjection values for only the highest dose of UCN2 (Fig. 4B). For LH pulse amplitude, no significant effect of time, dose, or interaction between variables was observed (P > .05 for each; Fig. 4C).
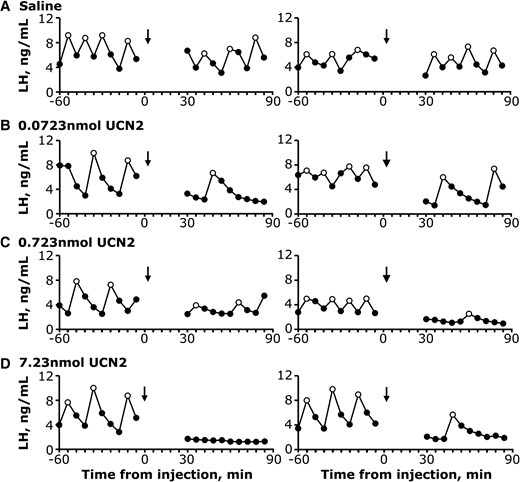
Representative LH pulse profiles measured in serial tail-tip blood samples before and after i.c.v. injection from each group of OVX mice: A, saline; B, 0.0723 nmol UCN2; C, 0.723 nmol UCN2; and D, 7.23 nmol UCN2. Time of i.c.v. injection occurred under brief isoflurane anesthesia and is indicated by the arrow. Open data points designate LH pulses identified by PULSAR Otago.
![Effect of central UCN2 on LH secretion. Pulses were identified by PULSAR Otago and values (mean ± SEM) for A, mean LH; B, number of pulses per 60 minutes; and C, pulse amplitude were calculated across time (Pre [−60 to −6 minutes], white bars vs post [30 to 84 minutes], gray bars) and between treatment groups by 2-way analysis of variance with time and treatment as factors (n = 5/group). For amplitude calculations, 1 to 3 UCN2 animals per group were excluded from the analysis due to the absence of pulses detected in the posttreatment period. Unique letters signify statistically significant differences between values (P < .05).](https://oup.silverchair-cdn.com/oup/backfile/Content_public/Journal/endo/166/5/10.1210_endocr_bqaf042/3/m_bqaf042f4.jpeg?Expires=1750195570&Signature=DM7~keunCdoAJhs2pgW0NTrCZ2~nMCZlS7M3-gC~bhmYkORw02RB3RajJUxfyu4qnOiaHS6ekzPIcU5Dk8qHsN1khIOefOrJBRNJB1QfPaKkP2DlnjVf5P4f5ORsmFYLqiaM2YvDRnyn7NXBwcK83TY6jNScxPpzDuUhu10FWZQR5Y4QC7RpbV0Zi7UYDM8iSMbUu1ogfUEjePK6cAjofItHH0xYVUI6gLPeFdofzz5X1J096Yv22NlF8Y8ah11IZ4Y-coEqMsl5QXt5CYtI-Cspd1CqJjyFSrcF5svN0sOtGVEoto3fU2QevdiSSd0jNrwUuzOuO6Bhlzj1g4Rdkw__&Key-Pair-Id=APKAIE5G5CRDK6RD3PGA)
Effect of central UCN2 on LH secretion. Pulses were identified by PULSAR Otago and values (mean ± SEM) for A, mean LH; B, number of pulses per 60 minutes; and C, pulse amplitude were calculated across time (Pre [−60 to −6 minutes], white bars vs post [30 to 84 minutes], gray bars) and between treatment groups by 2-way analysis of variance with time and treatment as factors (n = 5/group). For amplitude calculations, 1 to 3 UCN2 animals per group were excluded from the analysis due to the absence of pulses detected in the posttreatment period. Unique letters signify statistically significant differences between values (P < .05).
Luteinizing hormone surge
Fig. 5 shows estradiol-induced LH surge responses and quantification of c-Fos and Kiss1(GFP) IHC within the RP3V in mice that received an i.c.v. injection of 7.23 nmol UCN2 or saline the morning of the expected LH surge. Average LH concentrations in saline-treated controls the evening of the surge exceeded 1 ng/mL with 8 of 9 (89%) controls expressing a surge greater than 0.5 ng/mL (Fig. 5A). In contrast, i.c.v. UCN2 robustly blunted surge LH concentrations (T[8] = 0.371; P = .0092) and prevented the surge in all 7 UCN2-treated females. In addition, UCN2 significantly reduced the percentage of RP3V Kiss1(GFP) cells that expressed c-Fos compared to controls (4.0% vs 46.7%, UCN2 vs saline, respectively, T[3] = 23.069; P = .005; Fig. 5B). Representative images of RP3V Kiss1(GFP) cells, c-Fos staining, and coexpression is shown for a saline-treated control vs a UCN2-treated female in Fig. 5C to 5H.
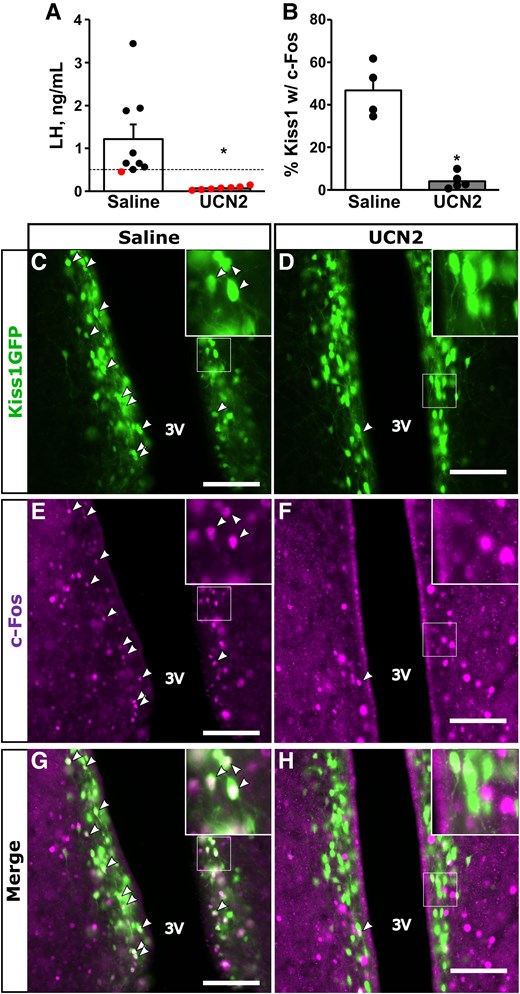
Effect of central UCN2 on the estradiol-induced LH surge and RP3V cell activation. A, Mean ± SEM LH concentrations and B, percentage RP3V Kiss1(GFP)/c-Fos coexpression in samples collected at the time of the anticipated LH surge (6 Pm) from OVX plus estradiol-treated females that either received saline (white bars) or 7.23 nmol UCN2 via i.c.v. injection in the morning (10 Am); n = 7-9/group. Dashed line in panel A represents LH surge threshold of 0.5 ng/mL; data points below this threshold are not considered a surge. Panels illustrate (C and D) immunostaining for Kiss1(GFP); (E and F) c-Fos; or (G and H) merged images in fixed neural tissue collected from OVX plus estradiol-treated females administered (C, E, and G) saline; or (D, F, and H) UCN2; n = 4-5/group. Arrowheads denote dual-labeled Kiss1(GFP) cells with c-Fos. White box indicates location of zoomed panels. Scale bar: 100 µm, 3 V, third ventricle. *P less than .05.
Experiment 3: Do Kisspeptin Cells Contain Corticotropin-Releasing Hormone Receptor 2?
Representative images of CRHR2 and Kiss1(GFP) are shown in Fig. 6A to 6C. The majority of Kiss1-expressing GFP cells contained CRHR2 across the rostral ARC (77.7 ± 7.0), middle ARC (78.0 ± 1.8), and caudal ARC (85.2 ± 5.4%), as well as RP3V (81.8 ± 2.1%), as detected by IHC (Fig. 6D). RNAscope was used to confirm expression of Kiss1 and Crhr2 mRNAs in the middle ARC (representative image Fig. 7), and the quantification revealed 89.0 ± 2.2% of Kiss1 cells coexpressing Crhr2.
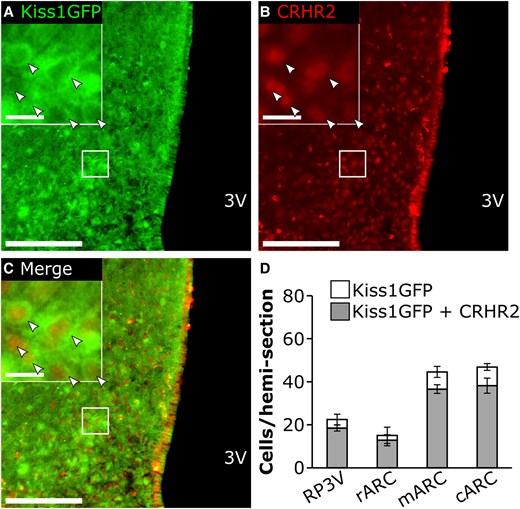
A to C, Representative photomicrographs of dual-labeled Kiss1CreGFP cells and CRHR2-immunostained cells from an OVX mouse. Panels illustrate immunostaining for A, Kiss1(GFP); B, CRHR2; or C, merged images. Arrows denote dual-labeled cells. White box indicates location of zoomed panels. Main panel scale bar: 50 µm, inset panel scale bar: 10 µm, 3 V, third ventricle. D, Bar graph represents average values across hemisections per animal (mean ± SEM; n = 3 for RP3V, n = 4 for ARC) for Kiss1(GFP) cells (white bars) and total Kiss1(GFP) cells expressing CRHR2 (gray bars) in the RP3V, as well as the rostral (r), middle (m), and caudal (c) aspects of the ARC.
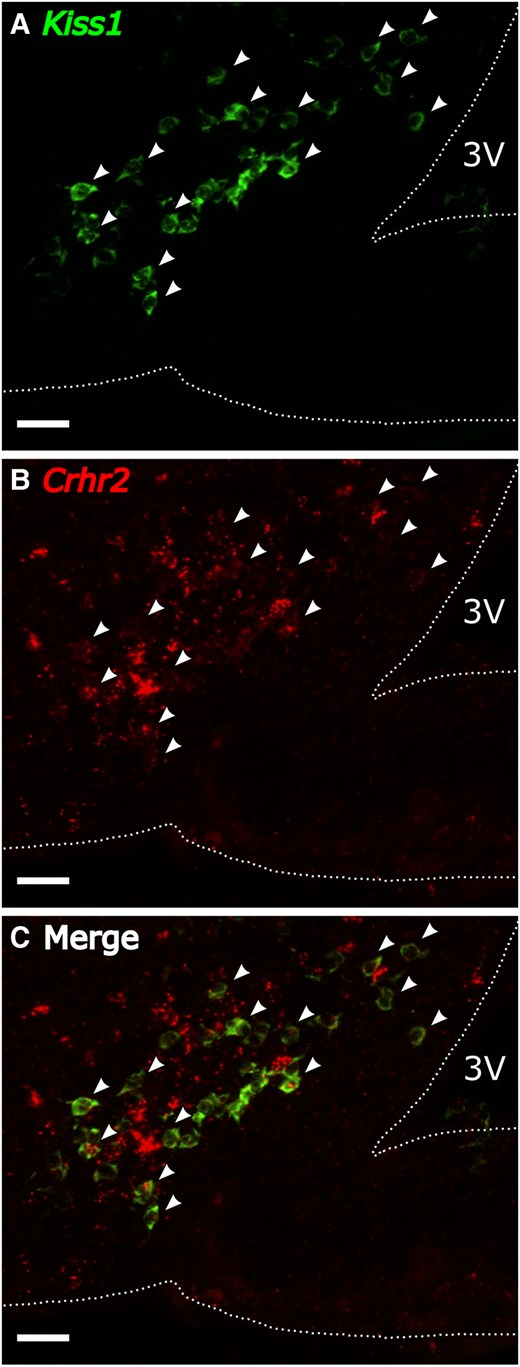
Representative photomicrographs of dual-labeled Kiss1 and Crhr2 cells via RNAscope in the (A to C) middle ARC of OVX female mice. Panels illustrate A, Kiss1; B, Crhr2; or C, merged image. Arrowheads denote dual-labeled Kiss1 cells with Crhr2. Scale bar: 50 µm, 3 V, third ventricle.
Experiment 4: Does Chemogenetic Activation of Catecholamine Neurons in the Nucleus of the Solitary Tract Induce Activation of Urocortin 2 Cells in the Paraventricular Nucleus?
Representative images of IHC for UCN2 and cFos in response to A, C, and E, i.p. saline; or B, D, and F, CNO administration in animals expressing stimulatory DREADDs in DBH cells within the NTS (Fig. 8). The number of UCN2 cells within the PVN was not different between animals that received saline or CNO (Fig. 8G). In contrast, the number of c-Fos cells (T[9] = 23.3; P = .0036; Fig. 8H) and the percentage of UCN2 cells that contained c-Fos (T[9] = 18.3; P = .009; Fig. 8I) were both significantly elevated in animals that received CNO compared to those that received saline.
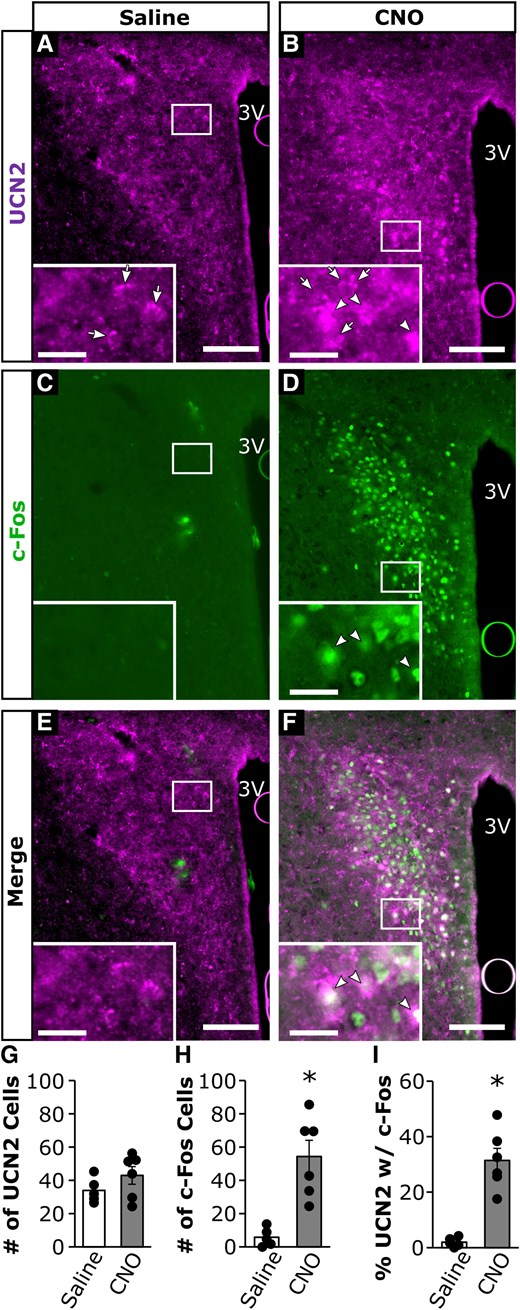
Representative photomicrographs of UCN2 and c-Fos cells from OVX DBH-cre mice administered a stimulatory DREADD virus into the NTS, followed 2 weeks later by treatment with (A, C, and E) intraperitoneal (i.p.) saline; or (B, D, and F) 1 mg/kg CNO. Panels illustrate immunostaining for (A and B) UCN2; (C and D) c-Fos; or (E and F) merged images in fixed neural tissue collected 2 hours following saline or CNO. Arrows denote single-labeled UCN2 cells. Arrowheads denote dual-labeled UCN2 cells with c-Fos. White box indicates location of zoomed panels. Main panels scale bar: 50 µm, inset panels: 10 µm, 3 V, third ventricle. Bar graphs represent average values across hemisections per animal (mean ± SEM, n = 5-6/group) for (G) number of PVN UCN2 cells; (H) number of PVN c-Fos cells; and (I) percentage of PVN UCN2 cells that contain c-Fos. *P less than .05.
Discussion
The data presented here survey the activation of PVNUCN2 cells during acute metabolic stress, the function of UCN2 on LH secretion, and explore the possibility of direct action of UCN2 on kisspeptin cells within the ARC or RP3V. First, we document that PVNUCN2 cells are activated during acute hypoglycemia, a model of stress shown to impair pulsatile LH secretion (37-39) and upstream ARC kisspeptin (ie, KNDy) cell activity (4). Next, we examined the function of UCN2 and show that this peptide suppresses pulsatile and surge secretion of LH. To determine if UCN2 can act directly on kisspeptin cells, we examined protein and mRNA for CRHR2 and identified this high-affinity receptor for UCN2 in the majority of ARC and RP3V kisspeptin cells. Finally, to better understand functional inputs to PVNUCN2 cells during stress, we confirmed that these neurons are activated by chemogenetic stimulation of NTSDBH cells.
Following such a clear suppression of LH pulses by UCN2 observed here and reported previously in rats (14), investigation of the precise site of action for UCN2 was an important and logical next step. We hypothesized that the suppression in LH pulse frequency by UCN2 indicated an action on KNDy neurons that forms the gonadotropin-releasing hormone (GnRH) pulse generator (2, 3) and tested this possibility by examining CRHR2 expression in kisspeptin cells. The presence of CRHR2 in the majority of KNDy cells raises the possibility that these pulse-generating cells are directly responsive to UCN2, though a functional blockade or disruption of the CRHR2 gene is needed to confirm the necessity of this signaling pathway. Another possibility is that UCN2 acts directly on GnRH neurons since an antibody against both CRHR1 and CRHR2 (nonselective) labeled approximately 30% of GnRH cells in mice (40); however, the analysis of mRNA has not been consistent. For instance, a microarray and single-cell reverse transcription polymerase chain reaction study releveled that GnRH neurons contained only Crhr1, and not Crhr2 (40); yet, other studies employing in situ hybridization or IHC for CRHR1 or CRHR2 of mouse reporter lines (41, 42) failed to detect either CRHR in GnRH neurons. Although bath application of UCN3 (a specific CRHR2 agonist) suppressed GnRH cell firing (and CRHR1 agonism enhanced GnRH firing), these GnRH responses may be mediated by CRHR actions on surrounding cells in the slice preparation (43). Taken together, the paucity of specific evidence for CRHR expression or action in GnRH neurons leads us to conclude the suppressive effect of UCN2 on LH pulses is mediated directly on or upstream of KNDy cells.
The mechanism for activation of PVNUCN2 cells during acute hypoglycemia remains an outstanding question; however, our data raise the possibility that NTSDBH neurons could play a role. Evidence from physical or neurotoxic lesioning studies of NTSDBH neurons suggest this brainstem region is necessary for conveying metabolic or immune stress signals to either the hypothalamic-pituitary-adrenal (44) or reproductive axes (16, 17). We recently demonstrated that chemogenetic activation of NTSDBH cells is sufficient to rapidly suppress LH pulses in OVX mice (15). In addition, activation of NTSDBH cells elicited enhanced glucocorticoid secretion; yet, the rise in corticosterone is not the mediator of suppressed LH suppression because a similar suppression of LH secretion was observed in adrenalectomized females. Here, we used tissue collected from that stimulatory DREADD study to demonstrate that chemogenetic activation of NTSDBH cells is sufficient to activate PVNUCN2 cells as well. Functional support for an inhibitory neural pathway via PVNUCN2 cells comes from data in rats in which a nonselective CRH antagonist delivered centrally blocked the inhibitory effect of intra-PVN delivery of norepinephrine on LH pulses (45). Collectively, these studies support the notion that brainstem neurons do not directly inhibit KNDy neurons, but instead require some intervening signaling pathway. KNDy neurons receive abundant innervation from the PVN and few inputs from the brainstem (46). Thus, an NTS → PVN → ARC neurocircuit may be important for the suppression of LH pulses during metabolic stress.
Another intriguing question is whether an NTS → PVNUCN2 circuit is involved in stress-induced suppression of the LH surge. In support of such a neural pathway, immunotoxic ablation of PVN-projecting NTS catecholamine neurons prevented lengthening of the estrous cycle in rats challenged with repeated glycoprivation (17). We administered UCN2 the morning of the anticipated LH surge in OVX animals administered a surge-inducing estradiol treatment, to avoid anesthesia administration in close proximity to the time of LH surge release. Tail-tip LH samples confirmed enhanced surge-like LH responses in control animals that were associated with approximately 50% of RP3V kisspeptin cells expressing c-Fos. The robust inhibition of both responses by UCN2, combined with the expression of CRHR2 in RP3V kisspeptin cells, raises the possibility that UCN2 acts directly on RP3V kisspeptin cells to block the positive feedback LH response. Although RP3V kisspeptin cells project to the PVN (47), the reciprocal connection has not been investigated (to our knowledge); therefore, a PVN → RP3V neurocircuit involving UCN2-CRHR2 signaling to suppress the LH surge remains speculative. Evidence that a layered psychosocial stress paradigm inhibited the estradiol-induced LH surge when applied hours before the expected rise in LH (48) supports the premise that early activation events necessary for LH surge generation are sensitive to stress or stress-induced intermediates, such as UCN2. An interesting question arising from the present work is whether UCN2-induced suppression of KNDy cell activity contributes to impaired RP3V cell activation during the surge model. Indeed, further work is necessary to decipher the neural circuits gating the LH surge (reviewed by Piet (49)) and the potential for inhibitory actions of stress-activated pathways on either KNDy and RP3V kisspeptin cell populations for generation of the LH surge.
Of final note, CRHR2 is expressed in many brain regions, including the amygdala (33), and recent evidence supports a role for CRHR2 activation within the amygdala in mediating predator and restraint stress-induced suppression of LH pulses (50). It is possible that this amygdaloid pathway may have been activated by our i.c.v. injections of UCN2; however, this pathway is unlikely to be important for suppression of LH pulses during acute metabolic stress, since ablation of the amygdala did not block the inhibitory effects of insulin-induced hypoglycemia in rats (51). These data further support the notion that different stress models (ie, reactive vs psychosocial) alter LH secretion via unique pathways and highlight the need for robust investigation of neural mechanisms underlying multiple stress types (1).
In summary, these data demonstrate that UCN2-CRHR2 signaling is sufficient to suppress both the pulse and surge modes of LH secretion. Moreover, the population of UCN2 cells in the PVN is responsive both to metabolic stress and to activation of brainstem catecholamine neurons. Together these data support the exciting hypothesis that PVNUCN2 cells form a functional link between activation of brainstem neurons responsive to homeostatic stress and the suppression of reproductive neuroendocrine function via KNDy and RP3V neurons.
Acknowledgments
We want to acknowledge Breen Church laboratory members for helpful discussions regarding this work, and we extend appreciation to Rebecca Gin for technical assistance with antibody validation. We thank Dr Carol Elias (University of Michigan) for her gracious gift of the Kiss1hrGFP mouse line. We acknowledge Dr Janet Roser (Department of Animal Science, University of California, Davis) for final characterization, preparation, and distribution of 518B7 antibovine LH antibody and Quidel CORP for initial development. We wish to acknowledge the contributions of Dr Al Parlow and the National Hormone and Peptide Program for the development of AFP240580Rb. Finally, we wish to thank the Nikon Imaging Center at UC San Diego for access to microscopes and technical assistance with imaging.
Funding
This work was supported by the National Institutes of Health (NIH grant Nos. R01 HD103725 and R21 HD105103). R.B.M. was supported by NIH grants K99/R00 HD104994, F32 HD096811, and T32 HD007203. H.F.B. was partially supported by an Endocrine Society REGMS fellowship.
Disclosures
K.M.B. is an editorial board member for Endocrinology and played no role in the journal's evaluation of the manuscript. The other authors have nothing to disclose.
Data Availability
Some or all datasets generated during and/or analyzed during the present study are not publicly available but are available from the corresponding author on reasonable request.
References
Abbreviations
- ARC
arcuate nucleus
- CNO
clozapine-N-oxide
- CRH
corticotropin-releasing hormone
- CRHR1
corticotropin-releasing hormone receptor type 1
- CRHR2
corticotropin-releasing hormone receptor type 2
- DBH
dopamine β hydroxylase
- DREADD
designer receptors exclusively activated by designer drugs
- ELISA
enzyme-linked immunosorbent assay
- GFP
green fluorescent protein
- GnRH
gonadotropin-releasing hormone
- i.c.v.
intracerebroventricular
- IgG
immunoglobulin G
- IHC
immunohistochemistry
- i.p.
intraperitoneal
- LH
luteinizing hormone
- mRNA
messenger RNA
- NTS
nucleus of the solitary tract
- OVX
ovariectomized
- PBS
phosphate-buffered saline
- PVN
paraventricular nucleus
- RP3V
rostral periventricular hypothalamic region
- UCN2
urocortin 2
