


Abstract
Breast cancer survivors treated with tamoxifen and aromatase inhibitors report weight gain and have an elevated risk of type 2 diabetes, especially if they have obesity. These patient experiences are inconsistent with, preclinical studies using high doses of tamoxifen which reported acute weight loss. We investigated the impact of breast cancer endocrine therapies in a preclinical model of obesity and in a small group of breast adipose tissue samples from women taking tamoxifen to understand the clinical findings. Mature female mice were housed at thermoneutrality and fed either a low-fat/low-sucrose (LFLS) or a high-fat/high-sucrose (HFHS) diet. Consistent with the high expression of Esr1 observed in mesenchymal stem cells from adipose tissue, endocrine therapy was associated with adipose accumulation and more preadipocytes compared with estrogen-treated control mice but resulted in fewer adipocyte progenitors only in the context of HFHS. Analysis of subcutaneous adipose stromal cells revealed diet- and treatment-dependent effects of endocrine therapies on various cell types and genes, illustrating the complexity of adipose tissue estrogen receptor signaling. Breast cancer therapies supported adipocyte hypertrophy and associated with hepatic steatosis, hyperinsulinemia, and glucose intolerance, particularly in obese females. Current tamoxifen use associated with larger breast adipocyte diameter only in women with obesity. Our translational studies suggest that endocrine therapies may disrupt adipocyte progenitors and support adipocyte hypertrophy, potentially leading to ectopic lipid deposition that may be linked to a greater type 2 diabetes risk. Monitoring glucose tolerance and potential interventions that target insulin action should be considered for some women receiving life-saving endocrine therapies for breast cancer.
Breast cancer is the second most common cause of death among women, and more than 70% of breast cancer patients are diagnosed with estrogen receptor (ER)–positive tumors (1). In premenopausal women, ER-positive cancers are often treated using selective ER modulators (SERMs) (2), the most common of which, tamoxifen (TAM), is prescribed at the time of diagnosis and is used for 5 to 10 years (until biological menopause) (3). After menopause or during ovarian function suppression, aromatase inhibitors are used to block peripheral estrogen production (4). SERMs and aromatase inhibitors significantly reduce the risk of breast cancer recurrence and have saved millions of lives (5). Notwithstanding the importance of ER-targeted therapies for breast cancer, use of these agents is linked to type 2 diabetes (T2D) development (6-9). A recent report suggested that up to 48% of T2D cases in breast cancer survivors are attributable to the effects of endocrine therapy (10). The mechanism of this increased T2D risk with endocrine therapies is not known; however, T2D is more prevalent in women with overweight or obesity, which is accompanied by adipose tissue dysfunction (11, 12). Adverse metabolic effects, such as ectopic lipid deposition in the liver, are also more likely to develop in this population (11, 12). These clinical data suggest that endocrine therapies interact with excess adiposity to increase T2D risk. Identifying the mechanism(s) of increased T2D in breast cancer survivors is critical because T2D is a leading cause of morbidity and premature mortality, and it is also a risk factor for breast cancer recurrence (13, 14).
Estrogen decreases energy intake, increases energy expenditure, attenuates visceral adipose storage, and supports “healthy” adipose tissue expansion in subcutaneous depots through preadipocyte recruitment (15-17). Disrupted ER signaling within adipose tissue may interfere with normal adipocyte biology and contribute to the elevated risk for diabetes, or potentially to weight gain, in women treated with endocrine therapy. In preclinical models, there are conflicting reports of metabolic consequences of endocrine therapy. Several metabolic studies employed supra-physiological doses of TAM to induce the expression of Cre-ER transgenes (reviewed in (18)). High-dose TAM over a short period of time leads to weight loss in mice, but this is not representative of the physiological response in breast cancer survivors (19-22). Importantly, few reports have considered the interaction with excess adiposity (overweight and obesity), which may accelerate adverse effects of breast cancer therapies. The rodent studies where TAM was administered at a clinically relevant dose focus on anticancer effects and have not reported whole-body metabolic outcomes (23, 24). Given that overweight and obesity impact over 70% of adult women, it is important to study whole-body effects of cancer therapies in this context (25).
To determine whether breast cancer treatments could cause metabolic disturbances associated with T2D risk, we evaluated effects of low-dose TAM or estrogen deprivation treatments in lean or obese female mice. TAM treatment increased fat gain in high fat/high sucrose (HFHS)-fed mice but had no effect on body mass or fat in low fat/low sucrose (LFLS)-fed mice. In contrast, estrogen deprivation promoted fat gain regardless of diet and adiposity. In the context of a HFHS diet, endocrine therapies inhibited expansion of adipose progenitor cells measured by fluorescence activated cell sorting (FACS) (Lin–/CD29+/CD34+/Sca1+/CD24+) and by single cell RNA sequencing, promoted adipocyte hypertrophy, and supported glucose intolerance and ectopic lipid deposition. Human breast adipose tissue from women prescribed TAM exhibited significantly greater adipocyte diameter only in women with obesity (body mass index [BMI] > 30 kg/m2). Understanding the metabolic impact of endocrine therapy is important for preventing T2D as well as breast cancer-specific adverse outcomes, such as metastasis- or shortened progression-free survival. Overall, our study demonstrates metabolic consequences of breast cancer endocrine therapy in obese female mice that are analogous to those observed in breast cancer survivors and highlights the need to consider close monitoring and adjunctive interventions to combat the negative metabolic effects of endocrine therapies.
Materials and Methods
Mice
Female C57BL/6J mice were purchased from Jackson Laboratories at 6 weeks of age (stock #000664). Mice acclimated for 1 week and were then given either low-fat/low-sucrose diet (LFLS; Research Diets D11092101) or high-fat (40%)/high-sucrose (292.5 g/3902 kcal) diet (HFHS; Research Diets D15031601) ad libitum. After 2 weeks in standard ventilated housing, mice were moved to warm water blankets set at 42°C, to maintain an internal cage temperature of ~30°C, as we have previously described (26). At 14 weeks of age, mature mice were ovariectomized under isoflurane anesthesia and immediately supplemented with 17β-estradiol (E2), provided in the drinking water at a final concentration of 0.5 µM. E2 supplementation continued for 2 weeks, at which time mice were randomized based on body fat percentage by qMR Echo (ECHO MRI) within diet groups to the following treatments: E2 maintenance (E2), E2 plus TAM (E2+TAM), or E2 withdrawal (EWD). A small group of LFLS- and HFHS-fed mice were treated with TAM in the absence of supplemental E2 (TAM). TAM-free base was delivered by subcutaneous pellet implant, with each mouse receiving a 5-mg, 60-day-release pellet (Innovative Research of America). Mice were treated for either 2 or 7 weeks, then fasted for 4 to 6 hours and euthanized according to approved AAALAC guidelines. At the end of study, blood and tissues were collected, and organs were weighed.
Whole-animal Calorimetry
Whole-body calorimetry was performed on a subset of LFLS- and HFHS-fed females during the second week after initiation of endocrine therapy. Mice were acclimated for 3 days and data were collected for an additional 24 hours. Total energy expenditure, resting energy expenditure, and spontaneous physical activity were measured in a metabolic monitoring system (Oxymax CLAMS-8M; Columbus Instruments, Columbus, OH). Individual metabolic cages included an animal activity meter (Opto-Max, Columbus Instruments, Columbus, OH) to allow for the calculation of total, ambulatory and nonambulatory activity by monitoring beam breaks within a 1-dimensional series of infrared beams. Metabolic rate was calculated from gas exchange measurements acquired every 18 minutes using the Weir (1949) equation: Metabolic rate = 3.941 × VO2 + 1.106 × VCO2– 2.17. Metabolic rate was averaged and extrapolated over 24 hours to estimate total energy expenditure. Energy intake was measured daily while the mouse was in the metabolic monitoring system. Energy balance was calculated as the difference between energy intake and expenditure (n = 4 per group).
Mouse Tissue Analysis
Tissues were fixed in 10% neutral buffered formalin, then processed and embedded using standard histology procedures. Five micrometer sections were stained with hematoxylin and eosin (H&E) to visualize tissue morphology and for quantification of adipocyte size distribution, which was performed using the Adiposoft plugin (27) and ImageJ software. For each group, 1 section from at least 3 mice (500-1800 cells per mouse) was analyzed. Liver sections were stained with H&E and hepatic steatosis scores (0-3) were assigned by a Board-Certified Liver Pathologist, blinded to experimental groups. For each group, sections from 3 to 7 mice were evaluated. Pancreas sections were stained using a guinea pig polyclonal anti-insulin antibody (Abcam ab7842) for 1 hour at room temperature, followed by incubation with anti-guinea pig secondary and DAB chromogen, and then counterstained with hematoxylin. Stained sections were scanned at 40× resolution using the Aperio Digital Pathology system (Leica Biosystems) and the positive pixel count algorithm was used quantified percent positive pixels of total pixels in full representative sections.
Adipose Tissue FACS
Whole inguinal subcutaneous adipose depots were excised, minced for 5 minutes with dissecting scissors, and digested for 75 minutes at 37°C in a collagenase solution (Collagenase type II, Worthington LS004177; Hanks’ Balanced Salt Solution with 3% bovine serum albumin, 0.8 mM ZnCl2, Mg, Ca, 0.8 mg/mL collagenase). Stromal pellets were incubated in red blood cell lysis buffer (Sigma Aldrich), washed, and stained with fluorescent-conjugated antibodies for CD45, CD31, Sca1, CD29, CD34, and CD24 as described (28). A full list of antibody dilutions, sources, and fluorophores are available in online supplemental materials (38).
Serum Analyses
One week prior to sacrifice, oral glucose tolerance tests were performed on a subset of mice from each group. Mice were fasted for 4 hours and then given 5 g/kg body mass dextrose from a 50% dextrose solution (VetOne, Boise, ID) by oral gavage. Blood glucose levels were measured using glucometers (Contour, Parsippany, NJ) with tail vein blood drawn at 0, 10, 20, 40, 60, 80, and 120 minutes post treatment. Serum was prepared from fasted blood collected at end of study. Insulin (Alpco Mouse Insulin ELISA; 80-INSMS-E01) and glucose (Cayman Chemicals Glucose Colorimetric Assay; 10009582) were measured in technical duplicates according to manufacturers’ protocols. The homeostatic model assessment of insulin resistance (HOMA-IR) was calculated according to the formula: fasting insulin (µU/L) × fasting glucose (mmol/L)/22.5.
Bioinformatics and Single Cell RNA Sequencing
Single cell RNA sequencing data were accessed from Tabula Muris (https://tabula-muris.ds.czbiohub.org/) in April 2020. Expression of Esr1, Esr2, and Cyp19a1 was examined and visualized in FACS processed cells from all tissues together, and from adipose (fat), limb muscle, liver, and mammary gland individually. Plots were exported from the website, and numeric data were used to generate a heatmap for Esr1 and Esr2 expression in Graph Pad Prism 8.
Subcutaneous adipose tissue was isolated and prepared as described for “Adipose Tissue FACS” above, from LFLS and HFHS mice after 7 weeks of treatment. The stromal fraction was subjected to FACS analysis, where CD45-positive and CD31-positive cells were removed, and CD29-positive cells were retained. Cells from 2 or 3 females per group were pooled (N = 2 for LFLS E2 and E2+TAM; N = 3 for LFLS EWD, HFHS E2, HFHS E2+TAM, and HFHS EWD) and 10 000 cells per lane were captured using the 10X Genomics Chromium Controller with 3′ v2 reagents and sequenced using the Illumina NovaSEQ 6000 platform at the University of Colorado Genomics and Sequencing Core Facility for a read depth of 50 000 reads/cell. Read mapping and expression quantification was performed using a combination of the kallisto-bustools pipeline (29) and Seurat (30). Briefly, single-cell reads were mapped to the mouse genome and assigned to genes using kallisto-bustools. Within Seurat, normalized, harmonized (31) gene expression was then used to produce a UMAP plot that provides cell clusters based on similarity of gene expression. Once cells were assigned to clusters, a t-test (false discovery rate < 0.05) within Seurat was used to statistically derive the gene expression differences within and between cell clusters, as well as within and between treatment groups. The proportions of cells were calculated as the number of cells in a given cluster in each treatment group divided by the total number of cells in that cluster. The heatmap, dot plots, UMAP, and violin plots were generated using the R Seurat package. Dot plots for each cluster were made by first generating differentially expressed gene lists comparing each treatment (E2+TAM or EWD) to E2-treated controls within each diet group. Then, the top 5 genes that were increased or decreased by each treatment were selected and the log2 expression values as well as the percent of cells expressing the gene were used for graphical representation. Data files from single cell sequencing analysis of mouse subcutaneous adipose tissue is available in the NCBI Gene Expression Omnibus GSE180880.
Human Tissue Analysis
Breast adipose tissue was collected by the Komen Tissue Bank and the IU Simon Cancer Center (https://virtualtissuebank.iu.edu/). Tissues were formalin fixed, processed, embedded, cut, and stained with H&E. Sections were scanned using the Aperio Digital Pathology system (Leica Biosystems). Images were accessed in May 2020 through the Aperio Digital Pathology system (Leica Biosystems) and adipocyte diameter was quantified using the Adiposoft plugin (27) and ImageJ software. Between 350 and 2000 cells were analyzed per tissue section to generate frequency distributions of adipocyte diameters. TAM-treated and -untreated samples were matched based on BMI and age.
Statistics
The purpose of this study was to determine the impact of endocrine therapies on metabolic health in the context of obesity. To address this objective, the statistical analyses were designed a priori to compare each endocrine therapy to the E2 alone condition, as that provides the most clinically relevant assessment of the data. Therefore, 2 separate 2-way analysis of variance (ANOVA) were used. The first ANOVA assessed the effect of diet (LFLS vs HFHS) and EWD treatment (EWD vs E2). The second ANOVA assessed the effect of diet (LFLS vs HFHS) and TAM treatment (E2 vs E2+TAM). Pairwise comparisons were performed using the Tukey test where appropriate. The level of statistical significance was set at P < .05. Data are expressed as mean ± SE.
Study Approval
All mouse studies were approved by the University of Colorado Institutional Animal Care and Use Committee. Collection of human breast adipose tissue was approved by the Indiana University Institutional Review Board for use in the Komen Tissue Bank.
Results
Modeling Breast Cancer Endocrine Therapy in Lean and Obese Mice
To determine how breast cancer therapies impact metabolism, and whether the effects are altered by excess adiposity (ie, obesity), we fed either LFLS or HFHS diets to female mice at thermoneutrality (26, 32) (~30°C) to promote fat gain (Fig. 1A). Mature, ovariectomized mice were given supplemental E2 and then randomized to endocrine treatments based on body fat percentage within diet groups to ensure that groups started at a similar weight (Fig. 1A). Mice were maintained on E2 or given TAM in the presence of E2 (E2+TAM; 5 mg pellet, 60-day release), or supplemental E2 was withdrawn (EWD). A small number of mice received TAM without E2 (TAM). The effectiveness of the hormonal manipulations in female mice was confirmed by measuring uterine mass after 2 weeks of treatment (Fig. 1B). Compared with control E2-supplemented mice, uterine masses were lower in the presence of E2+TAM (Fig. 1B; P = .0005) and after EWD (Fig. 1B; P < .0001). Compared with EWD-treated mice, the uteri from those given TAM without E2 were larger (Fig. 1B; P = .003), consistent with the agonist effects of TAM in the uterus (33). Importantly, uterine effects of TAM or EWD were not different between LFLS- and HFHS-fed mice. These data confirm that the preclinical mouse model is sufficient for determining the effects EWD and TAM in a relevant physiological setting.
Endocrine therapy promotes weight gain and glucose intolerance in HFHS-fed females. (A) Juvenile wild-type C57Bl/6 mice are fed a low-fat/low-sucrose (LFLS, blue lines) or high-fat/high-sucrose (HFHS, red lines) diet and housed at ~30°C. Mature females are ovariectomized (OVX) and supplemented with estradiol (E2) for 2 weeks. Mice are then randomized to 1 of 4 treatments within each diet group: E2 maintenance (E2), E2 plus tamoxifen (E2+TAM), withdrawal of supplemental E2 (EWD), or tamoxifen alone (TAM). Treatments continue for 7 weeks. (B) Representative images of uteri from 1 mouse in each diet/treatment group. Scale bar is 1 cm; and uterine mass presented as mg/g body mass for each group. Main effects of E2+TAM, EWD, and TAM only treatments (P < .001) by 2-way ANOVA. Main effect of TAM only vs EWD treatment (P < .01). (C) Body mass (grams) of mice in each treatment group beginning at the start of treatment and continuing for 7 weeks: LFLS E2 (n = 8), LFLS E2+TAM (n = 9), LFLS EWD (n = 10), LFLS TAM (n = 5), HFHS E2 (n = 9), HFHS E2+TAM (n = 12), HFHS EWD (n = 9), HFHS TAM (n = 5). For LFLS mice, EWD resulted in greater weight gain over time (P < 0.0001 for time × EWD interaction) but E2+TAM did not, compared with E2 alone. For HFHS mice body weight gain was greater over time with E2+TAM, EWD, and TAM (P = .001, P < .0001, P = .03 respectively); 2 × 3 ANOVA (factors: time, diet, and treatment) with interaction tests determined significance. (D) Fat mass in grams for each group. Fat mass was greater in HFHS mice with E2+TAM and EWD (P < .05; 2-way ANOVA (factors: diet and individual treatment). (E) Lean mass in grams for each group. Sample sizes are the same as for fat mass. (F,G) Serum insulin and glucose were measured in samples taken at sacrifice following a 4-hour fast. Effect of diet on insulin and glucose P < .05. Effect of EWD or TAM only on insulin P < .05. Effect of E2+TAM on glucose P = .02. (H) The homeostatic model assessment of insulin resistance (HOMA-IR) was calculated from fasting insulin and glucose. E2+TAM, EWD, and TAM administration resulted in greater insulin resistance relative to E2 in HFHS (P < .01 for interactions; 2 × 2 ANOVA; factors: diet and individual treatments). (I) Oral glucose tolerance tests were performed, and the glucose excursion is presented as the area under the curve. Both EWD and E2+TAM worsened glucose tolerance in HFHS (P = .04 and P = .06 respectively for the statistical interaction). LFLS E2 (n = 8), LFLS E2+TAM (n = 9), LFLS EWD (n = 10), HFHS E2 (n = 9), HFHS E2+TAM (n = 11), HFHS EWD (n = 9).
Tamoxifen and EWD Promote Fat Gain and Impair Glucose Tolerance
Suppression of ovarian function, which occurs during menopause or with ovariectomy, associates with adipose accumulation and redistribution in women and mice (34, 35). While weight gain is a potential and concerning anecdotal side effect of breast cancer therapy, clinical studies report inconsistent data due to differences in study design, group comparisons, and analysis timelines (36). We evaluated body mass and composition in female mice fed LFLS or HFHS diets. Overall, EWD-treated mice gained more weight than control E2-treated mice in each diet group over the 7-week treatment period (Fig. 1C both panels; P < .001). In contrast to several published studies (19-22, 37), E2+TAM treatment promoted rapid weight gain, but only in HFHS-fed mice (Fig. 1C, right; P = .001). There was no effect of TAM treatment, either with or without E2, in LFLS-fed mice (Fig. 1C, left). TAM alone promoted weight gain similar to E2+TAM in HFHS-fed mice (Fig. 1C, right; P = .03). Weight gain was due to fat accumulation after EWD in LFLS and HFHS-fed mice (Fig. 1D; P = .01 for LFLS, P < .0001 for HFHS), after E2+TAM treatment in HFHS mice (Fig. 1D; P = .01 for HFHS), and after treatment with TAM alone in HFHS mice (Fig. 1D; P = .01 for HFHS). Lean mass was unaffected by treatment (Fig. 1E).
To determine the physiological mechanisms driving excess weight gain, whole-body calorimetry was performed during the second week of endocrine therapy on 4 mice from each diet group treated with E2, E2+TAM, or EWD. This time frame marked the beginning of the body weight separation seen in both LFLS and HFHS mice and represents a dynamic phase where differences in energy intake and expenditure could be appreciated. E2+TAM treatment created a greater positive energy balance in the HFHS mice compared with the LFLS mice (Figure 1A (38); P = .007), while both diet groups experienced a positive energy balance during EWD (Figure 1A (38); P < .0001). In all cases, the positive energy balance was associated with greater energy intake (Figure 1B (38); EWD P < .0001; TAM P = .017). Greater energy expenditure was seen overall in the HFHS mice compared with LFLS mice (Figure 1C (38); P < .02) and during EWD in both diet groups compared with E2 controls (P = .004). Physical activity counts tended to be lower in HFHS than in LFLS mice (Figure 1D (38); P = .06) and were significantly lower during EWD (P = .012) but were unaffected by E2+TAM treatment. Overall, the weight gain following EWD in LFLS and HFHS mice, and from E2+TAM in HFHS mice is likely driven by increased energy intake during the early days of treatment.
Elevated T2D risk is a consistently reported adverse metabolic effect of breast cancer endocrine therapy (6-8, 18). Therefore, we evaluated fasting insulin and glucose, and calculated the HOMA-IR. By 7 weeks, insulin was elevated in HFHS vs LFLS mice (Fig. 1G; P < .01) and was higher during EWD (P = .029) and during treatment with TAM alone (Fig. 1G; P = .04); however, the effect of E2+TAM was not significant and there were no significant interactions between diet and treatment. Glucose was also higher in HFHS vs LFLS mice (Fig. 1H; P < .05) and was higher in both diet groups by E2+TAM (P = .02), but not by EWD or TAM alone. The distinct effects of endocrine therapies on insulin and glucose resulted in higher HOMA-IR in the HFHS E2+TAM-treated (P = .0004), EWD-treated (P = .009), and TAM-only–treated (P = .0004) mice (Fig. 1I). No treatment affected HOMA-IR in LFLS mice. Glucose tolerance was worse overall in HFHS mice (greater glucose area under the curve) during an oral glucose tolerance test (Fig. 1J; P < .001). Within this diet group, glucose tolerance tended to be worse with E2+TAM treatment (P = .06) and was significantly impaired during EWD (P = .04). Despite the observation that fasting insulin and glucose were greater with E2+TAM, particularly in HFHS mice, it did not appear to impair glucose tolerance at the same time point. Elevated fasting insulin can be a product of increased physical beta-cell mass and/or relative insulin hypersecretion. We estimated beta-cell content by quantifying insulin-positive area by immunohistochemistry in pancreas sections (39). With both E2+TAM and EWD treatments, the estimated proportion of insulin-positive cells was greater regardless of diet (Figure 2 (38); P < .05). However, at this time point only the HFHS mice showed elevated circulating insulin levels (Fig. 1G). These data indicate that, while blocking ER signaling is associated with more insulin-positive cells in the pancreas in female mice, elevated circulating insulin levels are only seen in the context of HFHS diet. Overall, endocrine therapies adversely affect glucose tolerance and insulin sensitivity in HFHS- but not LFLS-fed females. This effect did not appear to be a result of altered pancreatic insulin-positive cells, and instead may be linked to changes in peripheral insulin sensitivity that occur in the context of a HFHS diet. Because the effects of TAM treatment on body mass, composition, and insulin sensitivity were similar to those of E2+TAM treatment in LFLS and HFHS mice, the remaining analyses were conducted on mice treated with E2+TAM or EWD, each compared with E2 controls.
Estrogen Receptor Is Expressed in Progenitor Cells from Metabolic Tissues
To further understand what cells respond to changes in estrogen and ER signaling, we explored the Tabula Muris resource of single cell sequencing data from numerous murine tissues (without uterus, ovaries, and testes) (40). Interestingly, high expression of Esr1 (ERα), but not Esr2 (ERβ) was detected in cells from adipose (fat; stromal fraction), skeletal muscle, mammary tissue, and liver (Fig. 2A). Within adipose tissue, Esr1 was most highly expressed in a small population of unannotated, myeloid-derived cells that express CD45 (Ptprc), CD29 (Itgb1), Sca1 (Ly6a), and adipocyte progenitor markers Dpp4 and Pi16 (41), but lack Pdgfra, CD11b (Itgam), and Cd34 (Fig. 2A and 2B) (40). These cells may be similar to those previously described as a bone marrow–derived population of adipose progenitor cells (42-44). Esr1 was also highly expressed in mesenchymal stem cells from both adipose tissue (Fig. 2B) and skeletal muscle (Fig. 2C). Within skeletal muscle, the satellite cells (Fig. 2C), a self-renewing muscle cell that contributes to tissue repair (45), also highly expressed Esr1. In the mammary tissue, stromal cells and a subset of luminal epithelial cells demonstrated high Esr1 levels (Fig. 2D). The expression pattern of Esr1 in adipose, mammary stroma, muscle, and liver suggests that breast cancer endocrine therapy may target ERα in progenitor cell populations, particularly in tissues that impact whole-body metabolism.
Tamoxifen and EWD deplete adipocyte progenitors after 2 weeks of treatment. (A) Heatmap of Esr1 and Esr2 gene expression from the Tabula Muris single cell RNA sequencing resource. The cell type and tissue are listed. In red are (1) myeloid-derived adipose progenitor; (2) skeletal muscle satellite cell; (3) mesenchymal stem cell (MSC) from adipose; (4) stromal cell from mammary gland; (5) skeletal muscle satellite stem cell; (6) hepatocyte; and (7) MSC from skeletal muscle. (B-D) tSNE plots of Esr1 expression in FACS separated cells from adipose (B), skeletal muscle (C), and mammary gland (D) downloaded from the Tabula Muris website. (E) Fat mass in grams of mice in each group after 2 weeks of treatment. Fat mass was greater in HFHS mice compared with LFLS (diet effect, P = .01). (F) Average adipocyte diameter measured histologically after 2 weeks of treatment: n = 5 per group. Average adipocyte diameter was greater in HFHS mice and EWD mice (P < .0001 and P = .02 respectively). (G) FACS strategy to evaluate the proportion of adipose mesenchymal stem cells that were composed of preadipocytes and progenitor cells after 2 weeks of treatment. (H) Proportion of adipose mesenchymal stem cells that were composed of preadipocytes. E2+TAM and EWD treatment resulted in a greater proportion of preadipocyte cells irrespective of diet (P < .05 for each main effect). (I) Proportion of adipose mesenchymal stem cells that were composed of progenitor cells. E2+TAM treatment resulted in a smaller proportion of progenitor cells in HFHS mice (P = .02) while with EWD, the proportion of progenitor cells was greater in LFLS mice and unchanged in HFHS mice (P = .04). Significance represents the statistical interactions from 2 × 2 ANOVA (factors: diet and individual treatments).
TAM and EWD Differentially Impact Adipocyte Precursor Expansion in LFLS and HFHS Mice
Our previous study in a model of obesity and ER-positive breast cancer suggested a role for expanding subcutaneous adipose tissue and adipocyte hypertrophy in endocrine therapy resistance after menopause (26). Based on this work, and on our observations of predominant Esr1 expression in progenitor cells from adipose tissue, we evaluated adipocyte precursor cell types in the subcutaneous adipose from a cohort of mice after 2 weeks of treatment (46). At this time point, HFHS had greater fat mass than LFLS females, but there were no effects of E2+TAM or EWD treatments (Fig. 2E). The average adipocyte diameter was larger overall in HFHS-fed mice (Fig. 2F; P < .0001) and during EWD treatment (Fig. 2F; P = .02). Using previously established FACS methods (28), we evaluated the proportion of adipose stromal cells that were composed of preadipocytes and progenitor cells (Fig. 2G-2I; Table 1 (38)). The fraction of adipose precursor cells (Lin–/CD29+/CD34+/Sca1+) that contained preadipocytes (CD24–) in both diet groups was greater with E2+TAM and EWD treatments than in E2 controls (Fig. 2H; P = .017). In the progenitor population (CD24+; Fig. 2I), there was a significant interaction between diet and both E2+TAM (P = .02) and EWD (P = .04) treatments, where progenitors were greater in the LFLS mice, but lower (E2+TAM) or unchanged (EWD) in the HFHS mice. Regardless of diet, disrupting ER signaling appeared to stimulate an early burst in preadipocyte expansion; however, formation of new cells may not be sustainable in HFHS mice if the source of these preadipocytes (progenitor cells) is concomitantly being depleted.
Single Cell RNA Sequencing Reveals Multiple Clusters in Adipose Tissue from Female Mice
To validate and extend the results obtained by FACS analysis after 2 weeks of treatment, we performed single cell RNA sequencing analysis of all CD29+ cells in the stromal fraction of subcutaneous adipose tissue after 7 weeks of treatment in LFLS and HFHS mice (Fig. 3A). Adipose tissue was digested, then CD45+ and CD31+ cells were removed from the population using FACS. All CD29+ cells (mesenchymal stem cells) were collected and subjected to single cell RNA sequencing analysis, pooling cells from 2 or 3 females per treatment group to reduce bias from a single mouse. Seven clusters were identified (Fig. 3A). All clusters expressed genes previously defined as adipocyte precursor cells and that we used for FACS analysis of adipose stroma after 2 weeks of treatment (Fig. 2), including Itgb1 (CD29), Pdgfra, Ly6a (Sca1), and Cd34 (Fig. 3B). One of the 7 clusters (cluster 1) expressed genes previously described as adipocyte progenitor markers, including Pi16, Dpp4, Igfbp5, Anxa3, and Cd55 (Fig. 3C; Figure 3A-C (38)) (41). Cluster 3 expressed genes associated with committed preadipocytes, such as Fabp4, Pparg, Plin2, and Lpl (Fig. 3D; Figure 3D-F (38)). Cluster 5 expressed genes such as Clec11a, F3 (CD142), and Meox2 (Fig. 3E; Figure 3F (38)), which have previously been described to associate with a negative adipogenic regulatory cell type (AREGs) (47). Cluster 2 expressed Fabp4 and Plin2 (Fig. 3D) but also expressed fibrotic genes such as Tnc, Lox, and Jun (Figure 3G-I (38)). Cluster 4 expressed Pi16, Dpp4, and Fabp4 as well as high levels of mitochondrial genes (Fig. 3C and 3D). Finally, the smallest cluster (cluster 6) expressed Fabp4 and Pparg (Fig. 3D) and also Cd36 and Adipoq (Fig. 3F), suggesting these cells were immature, but partially differentiated adipocytes.
Subcutaneous adipose tissue stromal populations in LFLS- and HFHS-fed females. (A) Study design diagram and FACS workflow prior to single cell RNA sequencing. The UMAP image shows 7 identified clusters using Seurat. (B) Violin plots of previously reported markers of adipocyte precursor populations in each cluster. (C) UMAP and violin plots of Pi16 and Dpp4, denoting progenitors (cluster 1). (D) UMAP and violin plots of Fabp4 and Pparg, denoting preadipocytes (cluster 3). (E) UMAP and violin plots of Clec11a and F3 (Cd142), denoting AREGs (cluster 5). (F) UMAP and violin plots of Cd36 and Adipoq, denoting immature adipocytes (cluster 7). (G) Heatmap of the top 5 nonredundant gene markers for each cluster separated and defined by cluster type.
Next, we evaluated expression of the top 5 nonredundant marker genes for each cluster across the entire dataset to verify the cluster distinctions. This analysis revealed characteristic gene expression patterns for each main identified cluster (Fig. 3G). Based on the previously described and on the non-redundant markers, clusters were annotated as progenitors (cluster 1), fibroblasts (cluster 2), preadipocytes (cluster 3), mito-high (Mito; cluster 4), AREGs (cluster 5), immature adipocytes (cluster 6), and transitional progenitors (cluster 7) defined in Fig. 3G. Expression of Cd24a (CD24) was highest in the progenitor and transitional progenitor clusters (Figure 4A (38)), validating the methods used for FACS analysis of progenitors and preadipocytes after 2 weeks of treatment (Fig. 3G-3I). In addition, Esr1 but not Esr2 was highly expressed in progenitors, transitional progenitors, and preadipocytes (Figure 4B-C (38)), like what we observed in publicly available single cell data sources (Fig. 2A).
TAM and EWD Have Distinct Effects on Adipose Stromal Cells
After annotating the cell clusters from subcutaneous adipose stroma (Fig. 4A), we next determined how obesity and estrogen manipulations impacted the relative proportions of each cluster across groups and treatments. In LFLS mice, the proportion of progenitors was greater after E2+TAM treatment but remained similar to E2 controls after EWD treatment (Fig. 4B, open bars). In HFHS mice, progenitors were lower with E2+TAM and remained similar to E2 after EWD treatment (Fig. 4B, filled bars). Transitional progenitors remained stable after E2+TAM and EWD treatments in LFLS mice but were lower after each treatment in HFHS mice (Fig. 4C, open vs filled bars). In both LFLS and HFHS mice, the preadipocytes remained stable or slightly greater after E2+TAM treatment or were greater after EWD (Fig. 4D). Each remaining cluster changed in its relative proportion depending on the diet and/or treatment. The proportion of fibroblasts was larger with EWD but not after E2+TAM treatment in the LFLS mice; however, they remained consistent across treatments in HFHS mice (Figure 4D (38)). AREGs were elevated after both E2+TAM and EWD in LFLS mice but were only greater with EWD in HFHS mice (Figure 4E (38)). Immature adipocytes were markedly greater after EWD, but only in HFHS mice (Figure 4F (38)). Finally, the Mito cluster was greater overall in HFHS mice and lower with E2+TAM and EWD treatments but remained relatively stable in LFLS mice (Figure 4G (38)). Overall, these results show distinct effects of E2+TAM or EWD treatments on different adipose stromal populations, in some cases depending on diet. Importantly, the changes in cluster proportions for progenitors, transitional progenitors, and preadipocytes after 7 weeks of treatment measured by single cell RNA sequencing were consistent with what we observed by FACS after 2 weeks of treatment, suggesting that the adipocyte precursor cells from subcutaneous adipose tissue respond uniquely to breast cancer endocrine therapies in females depending on the diet, and potentially on obesity status.
Endocrine therapies have distinct effects on adipose stroma in LFLS and HFHS mice. (A) UMAP showing annotated clusters in LFLS and HFHS mice treated with E2, E2+TAM, or EWD. (B-D) Relative proportions of progenitors (B), transitional progenitors (C), and preadipocytes (D) from LFLS (open bars) and HFHS (filled bars) mice, expressed as the percentage of cells in each group’s cluster divided by the total number of cells per cluster. (E) Violin plots of Esr1 expression in progenitors, transitional progenitors, and preadipocytes in LFLS and HFHS mice under different treatment conditions. (F-H) The top 5 differentially expressed genes in progenitors (F), transitional progenitors (G), and preadipocytes (H) selected based on comparisons between either E2+TAM vs E2 or EWD vs E2 for LFLS- and HFHS-fed mice, and then depicted as dot plots of z-score in each group, showing the average expression and the percent of cells per cluster expressing a given gene.
Gene Expression Changes Are Unique Across Treatment and Diet Groups
The morphometric data from LFLS and HFHS mice revealed different effects of E2+TAM and EWD treatments on body mass, composition, adipose tissue expansion, and metabolic function (Figs. 1-3). In addition, we observed different effects of treatment on the proportions of adipose stromal cells between diet groups (Fig. 4B-4D). We next evaluated Esr1 expression in the progenitors, transitional progenitors, and preadipocytes to determine how it changed with diet and treatment. In the progenitors, Esr1 expression was slightly lower overall in HFHS than in LFLS samples, regardless of treatment group (Fig. 4E). In transitional progenitors, Esr1 was highest in LFLS E2 treated cells, and decreased slightly with both E2+TAM and EWD treatments (Fig. 4E). In transitional progenitors from HFHS mice, Esr1 expression remained stable across treatment groups (Fig. 4E). In preadipocytes, Esr1 increased with both E2+TAM and EWD treatments in LFLS mice, but only increased with EWD and not E2+TAM treatment in HFHS mice (Fig. 4E). Importantly, Esr1 was not among the significantly differentially expressed genes in any of the treatment comparisons, so while its expression was altered in some clusters by either E2+TAM or EWD treatment, the changes were not statistically significant.
Next, we evaluated differentially expressed genes between LFLS and HFHS mice in each cluster across each treatment group. The top 5 up- and downregulated genes after either E2+TAM or EWD treatment, compared with E2, were plotted across all groups in progenitors, transitional progenitors, and preadipocytes (Fig. 4F-4H). Overall, the differentially expressed genes were unique in each cluster, with some exceptions. For example, the adipogenic regulator Plac8 (48) was significantly regulated in all 3 clusters, but was not regulated the same way in each cluster by E2+TAM and EWD treatments, in terms of average expression or percent of cells in which it was expressed (Fig. 4F-4H). In contrast, the classical ER target gene, Pgr, was only significantly regulated in the progenitor cluster, and was greater with E2+TAM but lower with EWD treatments relative to E2 (Fig. 4F), despite both treatments aimed at inhibiting ER activity. Altogether, the analysis of stromal cells in subcutaneous adipose from LFLS- and HFHS-fed mice showed that E2+TAM and EWD treatments have distinct effects on the proportions of cells and on the gene expression profiles, including Esr1, within each cell type, depending on the diet and on the type of endocrine therapy administered. These data highlight the complexity of endocrine therapy effects on adipose tissue in females, and suggest that adipocyte precursor cells, particularly progenitors and what we defined as transitional progenitors, may be depleted with breast cancer therapies in the context of obesity.
One consequence of adipocyte progenitor cell depletion would be hypertrophy of existing mature adipocytes during a chronic positive energy balance. Therefore, we investigated the subcutaneous adipose after 7 weeks of treatment to determine adipocyte size distribution in response to endocrine therapy. Adipose tissue mass was greater with both E2+TAM (P = .002) and EWD (P = .01) treatments in HFHS mice (Fig. 5A and 5B). Larger adipocytes were more frequent in LFLS females after EWD compared to E2+TAM or E2 groups (Fig. 5B and 5C); however, the greatest proportion of large adipocytes was seen in E2+TAM and EWD treated HFHS females (Fig. 5B and 5C). The average diameter of subcutaneous adipocytes was significantly greater in HFHS mice by E2+TAM (P = 0.04) and EWD (P = .01) treatments (Fig. 5D). When combined with the potential depletion of adipocyte progenitors observed by FACS (Fig. 2) and single cell RNA sequencing (Fig. 4), the adipocyte hypertrophy seen in HFHS mice after longer-term (7 week) endocrine therapy is consistent with a depletion of progenitor cells and an impaired ability to expand adipose tissue by hyperplasia.
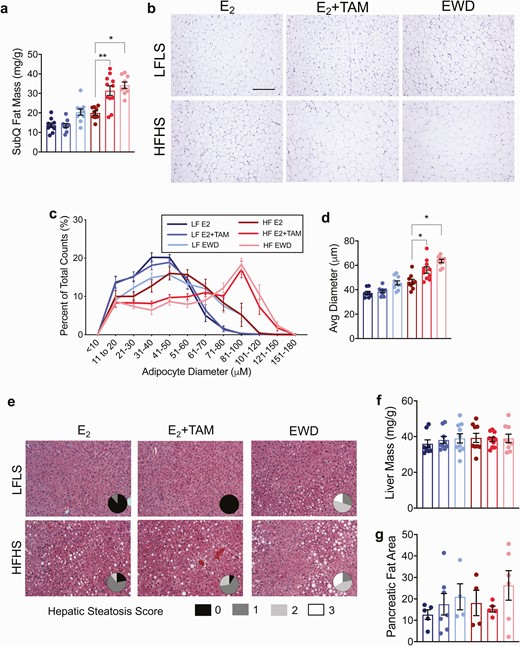
Adipocyte hypertrophy after 7 weeks of endocrine therapy. (A) Subcutaneous fat mass presented as mg/g in mice from each treatment group after 7 weeks of TAM or EWD. There was greater accumulation of fat mass in HFHS mice with both TAM and EWD (P = .002 and P = .01 respectively. Significance represents the statistical interactions from 2 × 2 ANOVA (factors: diet and individual treatments). (B) Representative images of adipocytes from 1 mouse in each diet/treatment group. Scale bar is 500 µm. (C) Adipocyte diameter represented as the proportion of each cell size representative to total cell count. Note the frequency of larger adipocytes in HFHS females after EWD and TAM treatment. (D) Quantification of adipocyte size represented by the mean adipocyte diameter. The average diameter of adipocytes in this depot was greater in HFHS mice treated with TAM and EWD (P = .04 and P = .01 respectively). Significance represents the statistical interactions from 2 × 2 ANOVA (factors: diet and individual treatments). Sample sizes are the same as in C. (E) H&E-stained sections of livers from 1 mouse in each group. Pie chart insets represent quantification of hepatic steatosis severity in each group. Score legend is shown below the H&E images. Sample sizes are the same as in C. (F) liver mass presented as grams per gram body mass. (G) Pancreatic fat was estimated in H&E-stained sections.
TAM and EWD Associate With Hepatic Steatosis in Mice
Several clinical studies report hepatic steatosis in breast cancer patients after treatment with E2+TAM or aromatase inhibitors (49-51). Adipocyte hypertrophy and decreased capacity for adipose storage may support lipid spill-over into circulation and ectopic lipid deposition in other tissues such as the liver, in both humans and animal models (52, 53). Steatosis was worse with EWD treatment than E2 in HFHS and LFLS mice (Fig. 5E; P < .05) without affecting liver mass (Fig. 5F). While HFHS E2+TAM-treated mice demonstrated hepatic steatosis, there was not a significant effect of E2+TAM treatment on this outcome after 7 weeks of treatment (Fig. 5E; P = .06). Given the observation that ectopic fat accumulated in the liver, we examined pancreatic fat accumulation, which has also been linked to beta-cell function (54). Estimates of pancreatic fat content were variable and not significantly different between any groups (Fig. 5G). Collectively, these observations indicate that endocrine therapy can affect ectopic lipid deposition, but there may be distinct direct effects on cells that express Esr1 within susceptible tissues such as the liver.
TAM Use Is Associated With Adipocyte Hypertrophy in Women
Breast cancer endocrine therapy use has been associated with T2D and hepatic steatosis (5-7, 10, 11); however, the impact of these treatments on weight gain are controversial, and there are few studies on adipose tissue effects in women. Based on this evidence and our observations from the mouse model, we analyzed human breast adipose tissue and BMI data from women who were currently prescribed TAM and compared that with women who were not taking endocrine therapy (Fig. 6A). In this small cohort, the average adipocyte diameter significantly correlated with BMI (Fig. 6B and 6C; P = .0001), validating what we previously found (26). When we analyzed adipocytes from women classified as lean (BMI < 25 kg/m2), overweight (BMI 25-29 kg/m2), or obese (BMI > 30 kg/m2) we found that current TAM use associated with larger adipocyte diameter only in those women with obesity (Fig. 6D; P = .03), compared to women classified as lean or overweight (Fig. 6D). For those with BMI > 30 kg/m2, the distribution of adipocyte sizes in TAM users reflected a greater proportion of large cells compared to women not taking TAM (Fig. 6E). Importantly, TAM use did not associate with differences in BMI within body mass category (Fig. 6F), suggesting that the effect on adipocyte size may not be due to overall effects on adiposity. These data align with the data from our preclinical model, and they indicate that endocrine therapy, particularly TAM, impacts adipocyte size distribution.
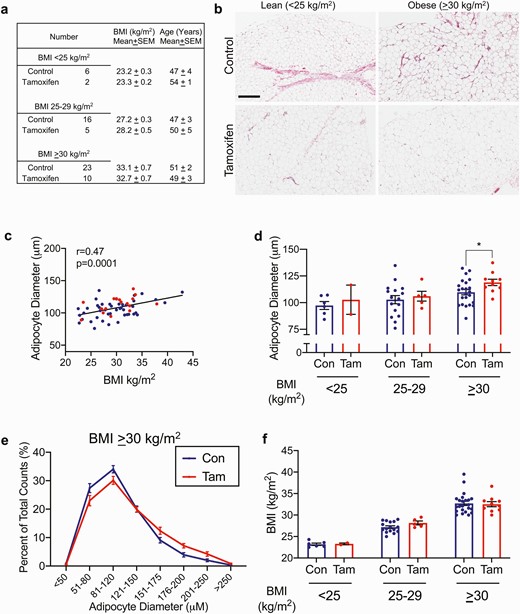
Tamoxifen treatment associates with larger adipocytes in women with BMI > 30 kg/m2. (A) descriptive data for women with and without tamoxifen treatment. (B) representative breast adipose images from 1 subject each, control or tamoxifen-treated, BMI < 25 kg/m2 or > 30 kg/m2. Scale bar is 400 μm. (C) spearman correlation of subject BMI and average adipocyte diameter. Red circles are from tamoxifen-treated women, blue circles are controls. (D) average adipocyte diameters from control or tamoxifen treated women with BMI < 25 kg/m2 (Con n = 6, Tam n = 2), 25-29 kg/m2 (Con n = 16, Tam n = 5), or > 30 kg/m2 (Con n = 22, Tam n = 10). P < .05 by unpaired t-test. (E) Adipocyte diameter represented as the proportion of each cell size representative to total cell count in women with BMI > 30 kg/m2. Note the frequency of larger adipocytes in tamoxifen-treated women. Con n = 22, Tam n = 10. (F) Individual BMI in each category from control or tamoxifen-treated women with BMI < 25 kg/m2 (Con n = 6, Tam n = 2), 25-29 kg/m2 (Con n = 16, Tam n = 5), or > 30 kg/m2 (Con n = 22, Tam n = 10).
Discussion
Here we report that breast cancer endocrine therapies (23, 24, 26) promote metabolic derangements associated with T2D risk in HFHS-fed mice including weight and fat gain, greater energy intake, elevated fasting insulin and glucose, adipocyte hypertrophy, and hepatic steatosis (summarized in Table 2 (38)). The effects of endocrine therapies in our preclinical model are similar to those observed in breast cancer patients (7, 8, 12, 50, 55-57). In mice, diet-induced obesity modified the effect of E2+TAM and EWD. This finding mirrors the clinical observation that breast cancer patients with overweight and obesity have greater hepatic steatosis and T2D risk with endocrine therapies (7, 8, 12, 50, 55-57). Further linking our findings to clinical data, we observed that TAM use associated with adipocyte hypertrophy in women with a BMI > 30 kg/m2. While the link between TAM and T2D is strong, metabolic effects of aromatase inhibition are less consistent (58, 59), potentially because these drugs are newer than TAM, and studies have not been adequately powered or compared aromatase inhibition to untreated women. Aromatase inhibitor treatment was recently reported to elevate risk for T2D (10), insulin resistance, and fat gain (60), and to increase nonalcoholic hepatic steatosis regardless of BMI (49). Our data suggest that endocrine therapy may exhaust adipocyte progenitors, limiting the expansion of adipose tissue lipid storage, and promoting ectopic lipid accumulation. The current observation of decreased adipocyte progenitor cells and subsequent adipocyte hypertrophy is consistent with a long-term risk of T2D due to inappropriate lipid storage. In the context of chronic positive energy balance, a shift towards adipocyte hypertrophy would be the only means of adipose tissue expansion, which is consistent with data from our mouse model as well as the adipose tissue from women treated with TAM. Although it may seem counterintuitive, the formation of new adipocytes in expanding adipose tissue maintains the metabolic health of the organism by preventing metabolic derangements associated with ectopic lipid deposition (61, 62). Our investigation focused on subcutaneous inguinal adipose tissue from female mice, which is similar to human breast adipose tissue. It is not clear how endocrine therapies may affect other depots in mice (eg, visceral) or in humans (eg, abdominal subcutaneous adipose). Published human studies are limited to those in women who were diagnosed with cancer, where obesity is a confounding risk factor for both T2D and breast cancer. We show in a preclinical model that breast cancer endocrine therapy, in the absence of cancer, promotes dysregulated metabolism, and affects subcutaneous adipose tissue, particularly in HFHS-fed females.
Esr1 was highly expressed in mesenchymal stem cells and a myeloid-derived progenitor cell population from adipose tissue (Figs. 2 and 3). Others have shown that Esr1 expression was elevated in primary FACS-isolated mouse adipose progenitor cells compared with either the total stromal/vascular fraction (made up largely of preadipocytes) or to mature adipocytes (63). In addition, loss of Esr1 from PPARγ-positive adipocyte lineage cells in female mice associated with fewer inguinal adipose progenitors and a reduced capacity for adipogenic differentiation (63). We found that endocrine therapy may stimulate early steps of de novo adipocyte differentiation in subcutaneous adipose tissue regardless of diet; but, in HFHS-fed females, the progenitor cells that give rise to preadipocytes were not elevated after treatment. Consistent with our observations, TAM was reported to inhibit proliferation and subsequent adipogenic differentiation of primary human adipose progenitor cells in vitro (64). Notably, complete ablation of Esr1 from adiponectin-positive mature adipocytes also promoted increased adiposity (65). Together, data from our study and others support a role for estrogen signaling in maintaining adipose progenitors and suggest potentially fundamental differences in progenitor cell responses to breast cancer therapies between females with and without obesity (Fig. 7). As predicted based on the depletion of adipocyte progenitors, by 7 weeks of treatment adipocyte size was greater with E2+TAM and EWD compared with E2 in the HFHS mice, which was accompanied by hepatic steatosis and elevated HOMA-IR.
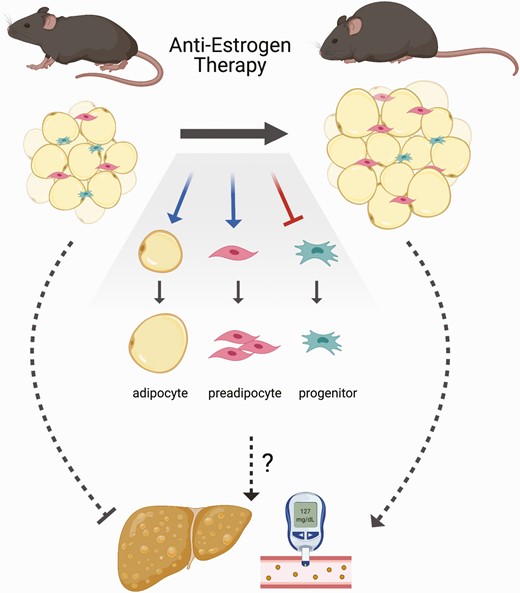
Endocrine therapy effects in high fat–fed females. Breast cancer endocrine therapy (tamoxifen treatment or withdrawal of E2) promotes weight and fat gain, adipocyte hypertrophy, and may impair healthy adipose tissue expansion through new adipocyte recruitment leading to higher risk for hepatic steatosis and T2D.
To model aromatase inhibition, which depletes the E2 ligand rather than targeting the receptor, we withdrew supplemental estradiol (EWD) from OVX females, lowering circulating estrogen levels substantially based on our previous in-depth analysis of adipose tissue Cyp19a1 expression and E2 in mice and rats (26, 66). The ability of rodent adipose to aromatize androgens to estrogens remains controversial in the fields of obesity and cancer (67, 68). Using the EWD approach, we observed metabolic outcomes consistent with those reported in breast cancer patients taking aromatase inhibitors (60). EWD had similar effects in LFLS and HFHS females: greater fat accumulation, food intake, and hepatic lipid deposition; however, despite gaining body fat, LFLS-fed females maintained fasting insulin and glucose levels similar to E2-treated females. These data highlight that weight gain is not always accompanied by deregulated metabolism when the adipocyte progenitor population is maintained, and adipocyte size remains small. As we expected based on the depletion of adipocyte progenitors, after 7 weeks of endocrine therapy, HFHS females suffered the worst consequences with excess fat gain, hepatic steatosis, and impaired glucose tolerance. Whether the effects of cancer therapy on the liver or whole-body insulin sensitivity are due to lipid spillover from hypertrophic adipocytes in mice or in humans is unclear. A limitation of the EWD approach is that it completely removes all detectable estrogen from the mouse environment. In humans, aromatase inhibitors reduce circulating estradiol levels between 50% and 90%, and the relative reduction of estrogens may be less in patients with an elevated BMI (69, 70). In this regard, EWD in ovariectomized mice produces the more complete loss of ER ligand.
One important aspect of our study was that we investigated the metabolic effects of TAM using a relatively low dose, known to effectively inhibit the growth of endocrine-sensitive ER-positive breast tumors (23, 24). A limitation of our approach is the difficulty in precisely modeling the specific ratio of estrogens to TAM as they would occur in women throughout their menstrual cycles. We evaluated a subset of mice that were given TAM without E2 and saw similar effects on body weight, body composition, glucose, and insulin to those mice given E2+TAM; however, the majority of studies were limited to mice that were given both hormones. In addition, while TAM is given to breast cancer patients orally, we delivered it in a subcutaneous pellet, which has been shown to inhibit human ER-positive breast tumor growth (23, 24). Women are prescribed 20 to 40 mg TAM per day, as either a single or divided dose. Assuming the average adult female mass is approximately 76 kg, this results in a dose of 0.26 to 0.52 mg/kg/day. We administered TAM as a subcutaneous 5-mg pellet, released over 60 days. For the mice in our study, this results in an average daily dose of 3.0 to 3.6 mg/kg/day, based on body mass range. While that daily dose of TAM exceeds what is given to breast cancer patients, we did not observe weight loss, which could indicate acute toxicity. Several previous studies in rodents have used doses of TAM designed to activate expression of Cre-ER transgenes, ranging from 25 to 300 mg/kg/day administered over a few days by intraperitoneal injection in oil vehicle or oral gavage (19-22, 71-75). Major metabolic outcomes reported in include decreased food intake (71), rapid adipose tissue loss (19-21), adipose tissue browning (21, 37), and hepatic steatosis (73, 74). Recently, sex-dependent effects of a single TAM dose given to neonatal mice were reported. In this study, TAM treatment had sustained adverse effects on high-fat diet–fed adult females, who showed weight gain, fat gain, and impaired glucose tolerance, similar to what we observed (76, 77). Also, very low levels of TAM were shown to have effects on body temperature, bone density, and movement in female mice, which was dependent on brain expression of ERα (78). With the exception of 1 study conducted at cold temperature (37) and 2 conducted on high fat–fed mice (21, 76), many previous studies were done on chow-fed males at ambient temperature (20-24°C). We performed studies on mice at thermoneutrality (~30°C) and compared HFHS- with LFLS-fed females. Overall, our findings of adipose accumulation and inappropriate adipose tissue expansion are consistent with a later life risk for T2D.
ER signaling is known to impact a variety of tissues and cell types at different stages of differentiation. We posit that one important role is to maintain the adipocyte progenitor pool (Fig. 7), which allows healthy adipose tissue expansion by hyperplasia. In the context of obesity when progenitors are depleted and ER signaling is disrupted by breast cancer endocrine therapies, adipogenesis occurs without repopulation of preadipocytes. Over time, especially in the presence of a chronic positive energy balance, hypertrophic adipocytes reach their limit of storage capabilities, which can result in ectopic lipid deposition. This scenario may explain the greater T2D risk in breast cancer patients. Antiestrogen therapies have been instrumental in preventing recurrence of breast cancer for the vast majority of patients. With increased survival of breast cancer patients and the heightened awareness of elevated T2D risk in this population, our study suggests the need for close monitoring and potential anti-hyperglycemic intervention for some women during endocrine therapy.
Abbreviations
- ANOVA
analysis of variance
- BMI
body mass index
- E2
17β-estradiol
- ER
estrogen receptor
- HOMA-IR
homeostatic model assessment of insulin resistance
- H&E
hematoxylin and eosin
- HF/HS
high-fat/high-sucrose
- LF/LS
low-fat/low-sucrose
- SERM
selective
- ER
modulator
- TAM
tamoxifen
- T2D
type 2 diabetes
Acknowledgments
Data from the Susan G. Komen Tissue Bank at the IU Simon Cancer Center was used in this study. We thank contributors, including Indiana University who collected data used in this study, as well as donors and their families, whose help and participation made this work possible. We also thank Veronica Wessels for providing outstanding histological expertise.
Funding: NIH (NCI R01CA241156 EW; NCATS KL2TR002534; TREC Training Workshop R25CA203650 to E.A.W.; R01CA164166 to P.S.M.; U54AG062319 to E.A.W. and P.S.M.) Komen Foundation CCR17483321 to E.A.W.; Veterans Administration (VA) (Merit Review) BX002046, CX001532 to J.E.B.R.; CDA2 BX004533 to R.L.S.); University of Colorado (Cancer Center Support grant P30CA046934; Clinical and Translational Sciences Institute UL1TR000154 to R.L.S., E.A.W., J.E.B.R.; Nutrition and Obesity Research Center Support grant NIH P30DK48520; Center for Women’s Health Research support to E.A.W., J.E.B.R., R.L.S.); and Canadian Institutes of Health Research grant CIHR PJT168854 to J.D.J. and the Frederick Banting and Charles Best Canada Graduate Scholarship Doctoral Award to A.M.Y.Z.
Author Contributions: R.L.S. and E.A.W. designed and oversaw the study and collected and analyzed data from mouse and human samples. R.M.F., S.E.H., L.A.K., S.J.M., F.K., R.S., A.E.G., K.L.J., J.A.H., G.J., A.M.Y.Z. collected, assembled, and interpreted data from mouse experiments. J.K. evaluated and scored liver samples. J.D.J., P.S.M., J.E.B.R., R.L.S., and E.A.W. interpreted data and wrote and edited manuscript. S.W.H. inspired the study from the patient perspective and provided input throughout the project and on the manuscript.
Conflict of Interest: The authors have declared that no conflict of interest exists.
Data Availability
Some or all data generated or analyzed during this study are included in this published article or in the data repositories listed in References.
