


Abstract
Autophagy is a catabolic process that involves the degradation of cellular components through the lysosomal machinery, relocating nutrients from unnecessary processes to more pivotal processes required for survival. It has been reported that systemic disruption of the Atg5 or Atg7 gene, a component of autophagy, is lethal and that its tissue-specific disruption causes tissue degeneration in several organs. However, the functional significance of autophagy in the thyroid glands remains unknown. Our preliminary data imply the possible involvement of dysfunctional autophagy in radiation-induced thyroid carcinogenesis. Therefore, we evaluated the effect of Atg5 gene knockout (KO) on thyroid morphology and function. To this end, Atg5flox/flox mice were crossed with TPO-Cre mice, yielding the thyroid follicular epithelial cell (thyrocyte)‒specific ATG5-deficient mice (Atg5thyr-KO/KO). Atg5 gene KO was confirmed by a lack of ATG5 expression, and disruption of autophagy was demonstrated by a decrease in microtubule-associated protein 1 light chain 3–II puncta and an increase in p62. Atg5thyr-KO/KO mice were born normally, and thyroid morphology, thyroid weights, and serum T4 and TSH levels were almost normal at 4 months. However, at 8 and 12 months, a decrease in the number of thyrocytes and an increase in TUNEL+-thyrocytes were observed in Atg5thyr-KO/KO mice even though thyroid function was still normal. The number of irregularly shaped (gourd-shaped) follicles was also increased. Excess oxidative stress was indicated by increased 8-hydroxy-2′-deoxyguanosine and 53BP1 foci in Atg5thyr-KO/KO mice. These data demonstrate that thyrocytes gradually undergo degradation/cell death in the absence of basal levels of autophagy, indicating that autophagy is critical for the quality control of thyrocytes.
Autophagy is a catabolic process that involves the degradation of cellular components through the lysosomal machinery, relocating nutrients from unnecessary processes to more pivotal processes required for survival. This mechanism plays a role in not only the preservation of nutrients under starvation condition or other cellular stresses but also the normal turnover of cytoplasmic components. With the use of genetically engineered mice, disruption of autophagy was recently shown to be important for maintaining the quality of proteins and organelles and thus cellular homeostasis. Systemic disruption of the Atg5 or Atg7 gene, encoding critical components for autophagy, causes neonatal death (1, 2), and their tissue-specific disruption induces tissue degeneration in neuron, liver, heart, and pancreatic β-cells (1, 3–6).
However, only a few studies have reported the functional significance of autophagy in the pathophysiology of the thyroid glands. For example, cytokine/iodine-mediated suppression of autophagy has been described in the thyroids of patients with Hashimoto’s thyroiditis (7–9). Modulation of autophagic activity has begun to be used for cancer treatment [see (10) for a review]. Furthermore, our preliminary data imply the possible involvement of dysfunction of autophagy in radiation-induced thyroid carcinogenesis in young rats (11). However, as far as we know, the physiological significance of autophagy in thyroid function and morphology remains totally unknown. Therefore, we generated thyroid-specific Atg5 knockout (KO) mice by crossing Atg5flox/flox and TPO-Cre mice and evaluated the consequences of disruption of autophagy on thyroid morphology and function.
Materials and Methods
Mice used
Atg5flox mice, in which exon 3 of the Atg5 gene is flanked by two loxP sequences, were originally generated by N. Mizushima (4) and provided by the RIKEN Bioresource Center, Tsukuba, Japan (http://en.brc.riken.jp/). TPO-Cre mice expressing Cre recombinase under the control of thyroglobulin promoter were previously obtained from S. Kimura at the National Institutes of Health (NIH) (12). Atg5flox/flox; TPO-Cre mice (hereafter designated as Atg5thyr-KO/KO, indicating thyroid-specific Atg5 gene KO) were generated by crossing these two mice. In Atg5thyr-KO mice, Cre is expressed in thyroid follicular epithelial cells (thyrocytes) after embryonic day 14, resulting in the deletion of the loxP-flanked exon 3. Controls include littermates of Atg5thyr-KO/+ and Atg5+/+ mice because only a small amount of Atg5 is needed for autophagy (13).
All mice were kept in a specific pathogen-free facility. Animal care and all experimental procedures were performed in accordance with the Guideline for Animal Experimentation of Nagasaki University with the approval of the Institutional Animal Care and Use Committee (permission no. 1309021089). All surgeries were performed under isoflurane anesthesia, and all efforts were made to minimize suffering.
Experimental designs
At 4, 8, and 12 months, mice were anesthetized with isoflurane, from which blood samples were collected via cardiac tap for serum preparation; they were then euthanized by cervical dislocation. The thyroids were removed for histological examination, and blood samples were used to measure TSH and T4 concentrations. Each group contained three or four mice of both sexes.
Hematoxylin and eosin staining and immunohistochemistry
The thyroids were fixed in 10% neutral-buffered formalin or Bouin’s solution [FUJIFILM Wako, Osaka, Japan; for 8-hydroxy-2′-deoxyguanosine (8-OHdG)] and then embedded in paraffin. Sections 4 μm thick were prepared and stained with hematoxylin and eosin (H&E) or immunostained. The primary and secondary antibodies used were (i) rabbit monoclonal anti-ATG5 (14) and swine anti-rabbit IgG/horseradish peroxidase (HRP) (15) for ATG5; (ii) guinea pig polyclonal anti-p62 (16) and Alexa Fluor 488–conjugated goat polyclonal anti-guinea pig IgG (17) for p62; (iii) rabbit polyclonal anti‒microtubule-associated protein 1 light chain 3 (LC3) (18) and Alexa Fluor 488‒conjugated goat polyclonal anti-rabbit IgG (19) for LC3; (iv) rabbit polyclonal anti-ubiquitin (20) and Alexa Fluor 488‒conjugated goat polyclonal anti-rabbit IgG (19) for ubiquitin; (v) rabbit anti‒p53-binding protein 1 (53BP1) (21) and Alexa Fluor 488‒conjugated goat polyclonal anti-rabbit IgG (19) for 53BP1; and (vi) mouse monoclonal anti–8-OHdG (22) and Alexa Fluor 488‒conjugated goat polyclonal anti-mouse IgG (23) for 8-OHdG. Staining without the primary antibodies was performed as negative controls in all experiments. For HRP, color was developed with 3,3′-diaminobenzidine substrate. For immunofluorescence, the slides were analyzed using an All-in-One BZ-9000 Fluorescence Microscope (Keyence, Osaka, Japan), and the fluorescent intensity was quantified using a BZ-II Analyzer (Keyence). One hundred cells were evaluated in each sample to measure the fluorescent intensities of p62, ubiquitin, and 8-OHdG and the number of LC3 puncta and 53BP1 foci.
Western blotting
Expression of LC3 and p62 was also determined by immunoblotting with 40 μg of thyroid tissue lysate prepared with RIPA buffer from Atg5thyr-KO/KO and Atg5thyr-+/+ mice. Protein samples were resolved by sodium dodecyl sulfate polyacrylamide gel electrophoresis and transferred onto a polyvinylidene fluoride membrane (Bio-Rad Laboratories Inc., Tokyo, Japan). After blocking and incubation with an appropriate primary antibody, the antigen-antibody complexes were visualized using a horseradish peroxidase–conjugated secondary antibody and a chemiluminescence system (Thermo Fisher Scientific, Rockford, IL). Detection was performed using an LAS-3000 imaging system (FUJIFILM Corporation, Tokyo, Japan). The primary and secondary antibodies used were (i) polyclonal rabbit anti-LC3 (18) and polyclonal goat anti-rabbit HRP-conjugated IgG (24) for LC3; (ii) polyclonal guinea pig anti-p62 (16) and polyclonal rabbit anti‒guinea pig HRP-conjugated IgG (25) for p62; and (iii) monoclonal mouse anti‒β-actin (26) and polyclonal horse anti-mouse HRP-conjugated IgG (27) for β−actin.
Evaluation of apoptosis
TUNEL staining was performed with the Apop-tag™ Fluorescein Direct in situ apoptosis detection kit (Merck Millipore, Darmstadt, Germany). The slides were embedded with VECTASHIELD Mounting Medium containing 4′,6-diamidino-2-phenylindole (Vector Laboratories, Burlingame, CA) and analyzed using an All-in-One BZ-9000 Fluorescence Microscope. One hundred fifty cells were evaluated in each sample to determine the percentages of TUNEL-positive cells.
Serum TSH and T4 measurements
Serum TSH level was measured by specific mouse TSH RIA with mouse TSH/LH reference (AFP9090D), mouse TSH antiserum (AFP98991) (28), and rat TSH antigen (NIDDK-rTSH-I-9) as described previously (29, 30). Serum T4 level was measured with the Mouse T4/Thyroxine ELISA Kit (LS-F10014; LifeSpan BioSciences, WA) with the OD value of each well determined using a microplate reader (2030 Multilabel Plate Reader ARVO X3; PerkinElmer, Branchburg, NJ) set to 450 nm.
Evaluation of thyroid morphology
Detailed analyses of thyroid morphology were performed according to previously published methods (31–33). Sections of the whole thyroid gland at ×400 magnification were used to assess the area of the follicles. The inner area of the thyroid gland at half the maximum length in the longitudinal plane was considered the central zone, and the area surrounding the central zone was considered the peripheral zone. The number of nuclei was counted in each area, and the values were converted to values per 1000 μm2.
Statistical analyses
All data are expressed as mean ± SE, and differences between groups were examined for statistical significance using the Dunnett test. A P value <0.05 was considered statistically significant.
Results
In autophagy, cellular organelles, lipids, proteins, and invading microbes are sequestered in autophagosomes and are eventually fused with lysosomes for degradation. In its initial steps, the soluble form of LC3-I (the mammalian homologue of yeast ATG8) is conjugated to phosphatidylethanolamine; this results in the formation of LC3-II, which is then associated with the autophagosomal membrane and forms an autophagosome. Thus, the amount of LC3-II is indicative of autophagy flux. This can be monitored by western blotting showing the presence of an LC3-II band in addition to an LC3-I band or immunohistochemical analysis showing alteration of LC3 staining patterns from a diffuse to a punctate appearance (34). Furthermore, p62, a substrate of autophagy, is degraded in lysosomes in the final step of autophagy (35). Thus, it is important to show both an increase in LC3-II/LC3 puncta and a decrease in p62 to confirm the complete process of autophagy (34, 36).
In the thyroid glands of wild-type (wt) mice, LC3 puncta were sparely observed; low expression levels of p62 were detectable in immune fluorescence analysis, and a faint LC3-II band but no p62 band was detectable in western blot analysis (Fig. 1), indicating the low levels of autophagy in thyroid cells in the steady state. Next, thyroid-specific KO mice of ATG5 (Atg5thyr-KO/KO mice) were generated by crossing Atg5flox/flox and TPO-Cre mice. The absence of ATG5 protein expression and of LC3 puncta and the accumulation of p62 confirmed successful deletion of the Atg5 gene (Fig. 1). All the differences were confirmed by quantification (Fig. 1). Atg5thyr-KO/KO mice were born normally at an expected Mendelian frequency. The thyroid weights (data not shown), the ratios of thyroid to body weights, and serum concentrations of T4 and TSH were all normal in 4-, 8-, and 12-month-old Atg5thyr-KO/KO mice, with the exception of a slight increase in TSH in Atg5thyr-KO/KO mice compared with wt mice at 4 months (Fig. 2), implying very mild hypothyroidism. Lower TSH levels in females than in males at 4 months were previously reported (37).
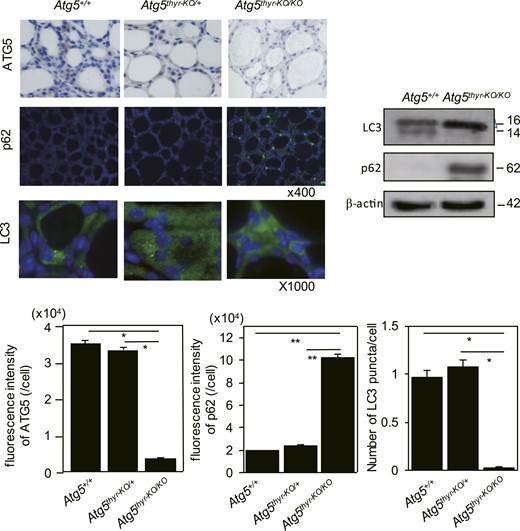
Immunohistochemical staining and western blot analysis of thyroid tissues from 4-month-old Atg5+/+, Atg5thyr-KO/+, and Atg5thyr-KO/KO male mice for ATG5, p62, and LC3. Mice (n = 3) were euthanized at 4 weeks of age. The thyroid glands were removed and subjected to immunohistochemical staining, western blotting, and quantification of expression levels as described in “Materials and Methods.” Note that quantification of ATG5 expression was performed using immunofluorescent staining of ATG5 (data not shown), although the pictures shown here are with HRP and 3, 3′-diaminobenzidine. Original magnifications: ×400 for ATG5 and p62; ×1000 for LC3. Data are means ± SE. *P < 0.05; **P < 0.01.
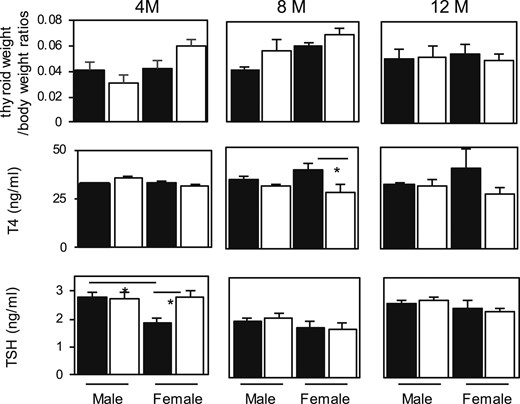
Thyroid weight/body weight ratios and serum T4 and TSH concentrations in 4-, 8-, and 12-month-old control and Atg5thyr-KO/KO mice. The thyroid glands and blood samples were obtained from 4-, 8-, and 12-month-old mice (n = 3 or 4 for each group). T4 and TSH levels were measured as described in “Materials and Methods.” The black and white bars indicate the control and Atg5thyr-KO/KO mice, respectively. Data are means ± SE. *P < 0.05. M, months.
With H&E staining of the thyroid glands (Fig. 3), thyroid morphology was normal in 4-month-old Atg5thyr-KO/KO mice; however, thinning of thyrocytes gradually appeared in 8- and 12-month-old Atg5thyr-KO/KO mice compared with wt mice. In the detailed analysis of thyroid morphological alterations (31–33), the thinning of thyrocytes was confirmed by measuring epithelial height [Fig. 4(A)] and was likely attributable to fewer follicular epithelial cells. Thus, although follicular sizes were similar between the wt and Atg5thyr-KO/KO mice (except for the 8- and 12-month-old male mice) [Fig. 4(B)], the number of nuclei (i.e., the number of thyrocytes) per unit area was lower in Atg5thyr-KO/KO mice than in wt mice [Fig. 4(C)]. Another interesting finding was the appearance of irregularly shaped follicles. Thus, the number of the gourd-shaped follicles was increased in 8- and 12-month-old Atg5thyr-KO/KO mice vs wt mice [Fig. 4(D)].
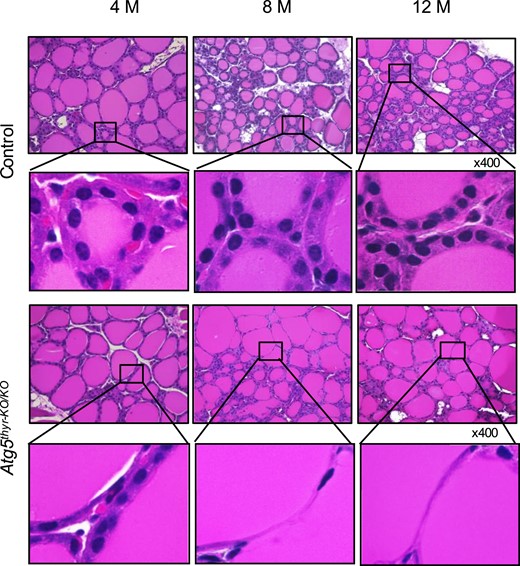
H&E staining of thyroid glands from 4-, 8-, and 12-month-old control and Atg5thyr-KO/KO mice. The thyroid glands removed in Fig. 2 (n = 3 or 4 for each group) were subjected to H&E staining as described in “Materials and Methods.” The magnified thyrocytes are shown in the insets. Because the histology was essentially the same between males and females, representative photos of male mice are shown. Original magnification, ×400. M, months.
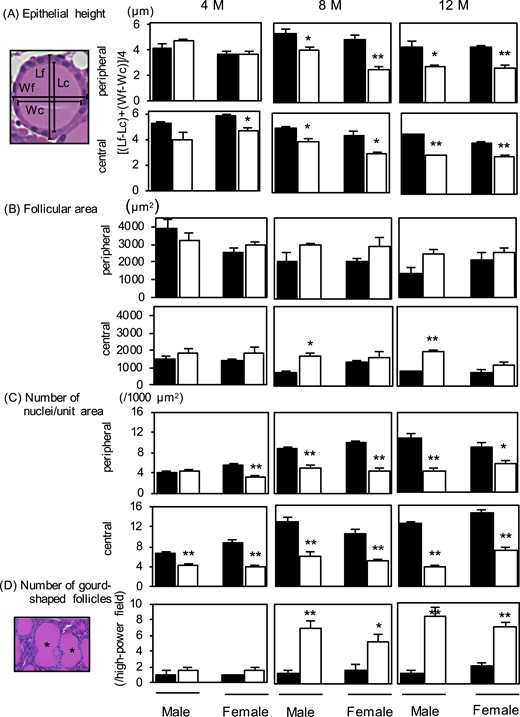
Measurements of (A) epithelial height, (B) follicular area, and (C) numbers of nuclei per unit area. The thyroid glands removed in Fig. 2 (n = 3 or 4 for each group) were used for the measurements. The black and white bars indicate the control and Atg5thyr-KO/KO mice, respectively. (A) The diagram on the left shows measurements of epithelial height, with Lf and Lc representing the lengths of follicle and colloid, respectively, and Wc and Wf representing the widths of follicle and colloid, respectively (33). (D) Representative photo on the left shows gourd-shaped follicles. Data are means ± SE. *P < 0.05; **P < 0.01. M, months.
In immunohistochemical staining, TUNEL was performed to see whether the decreased number of thyrocytes was due to apoptosis. Indeed, with TUNEL thyrocytes were gradually increased in 8- and 12-month-old Atg5thyr-KO/KO mice [Figs. 5(A) and 6]. Increased ubiquitin staining, a marker for the accumulation and aggregation of misfolded proteins, was already observed in 4-month-old Atg5thyr-KO/KO mice and was gradually exacerbated in the 12-month experimental period [Figs. 5(B) and 6].
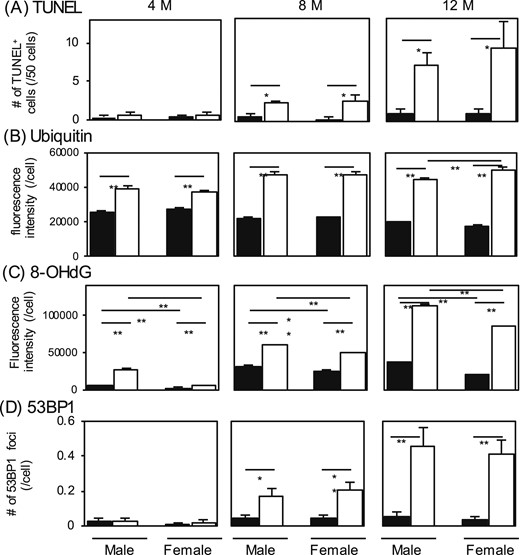
Measurements of (A) TUNEL-positive thyrocytes, (B and C) fluorescence intensities of ubiquitin and 8-OHdG, and (D) number of 53BP1 foci. The thyroid glands removed in Fig. 2 (n = 3 or 4 for each group) were used for staining and measurements. The black and white bars indicate the control and Atg5thyr-KO/KO mice, respectively. Data are means ± SE. *P < 0.05; **P < 0.01 compared with controls. M, months.
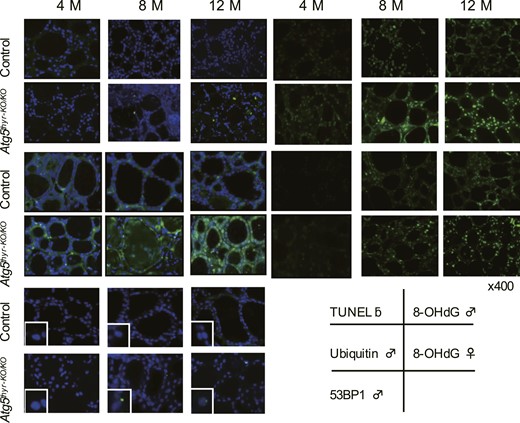
Immunohistochemical staining of TUNEL, ubiquitin, 8-OHdG, and 53BP1 in 4-, 8-, and 12-month-old control and Atg5thyr-KO/KO mice. The thyroid glands obtained in Fig. 2 (n = 3 or 4 for each group) were used for staining. Magnified 53BP1 foci are shown in the insets. Original magnification, ×400. Representative photos of male mice are shown for TUNEL, ubiquitin, and 53BP1 because different results between males and females were observed only in 8-OHdG. M, months.
Because it was reported that autophagy controls intracellular reactive oxygen species (ROS) levels (38), ROS-induced genomic damages were evaluated by using 53BP1 and 8-OHdG as markers. 53BP1 accumulates at the DNA double-strand break sites (39), and 8-OHdG is an oxidized nucleotide guanine (40) and an indicator of oxidative stress (41). As shown in Fig. 5(C) and 5(D) and Fig. 6, the fluorescence intensity of 8-OHdG, not 53BP1, staining was higher in Atg5thyr-KO/KO mice than in wt mice at 4 months. Because 8-OHdG is more sensitive than 53BP1 for detecting ROS-induced DNA damage (42), these data suggest a mild increase in oxidative stress in thyrocytes lacking autophagy. At 8 and 12 months, the number of 53BP1 foci was also elevated, albeit to very low levels, in Atg5thyr-KO/KO mice, demonstrating higher ROS production in the later period. Of note, the fluorescence intensity of 8-OHdG staining was greater in males than in females in both Atg5thyr-KO/KO mice and wt mice.
Discussion
Here, we studied the long-term effect of autophagy defects in the thyroids of mice and found gradual degeneration and eventual cell death of thyrocytes. Although the thyroids of 4-month-old Atg5thyr-KO/KO mice were apparently normal with H&E staining, the accumulation of misfolded proteins could already be detected by immunohistochemical staining with anti-ubiquitin antibody. Cytoplasmic accumulation of (poly)ubiquitinated proteins is widely accepted as a hallmark of protein accumulation by autophagy deficiency (1, 3, 4), which, for example, was seen soon (4 days) after deletion of the Atg5 gene in the liver, from which cytoplasmic inclusion bodies were gradually developed (4). Increased ubiquitinated protein indicates accumulation of polyubiquitinated proteins targeted to autophagosomes by p62. The accumulation of aggregated proteins likely eventually led to thyrocyte death, as evidenced by a decrease in thyrocyte numbers and an increase in apoptotic thyrocytes (although thyroid function was still within normal ranges in even 12-month-old Atg5thyr-KO/KO mice). Of note, cell death resulted in the thinning of thyrocytes. The width of thyrocytes is usually an indicator of cell function; however, in our study, the thinning seemed to be due to the elongation of the remaining surviving thyrocytes. We also suggest that the gourdlike follicles arose from the fusion of follicles; the reduced numbers of thyrocytes were unable to maintain the follicle structure.
Because it was recently reported that the components of autophagy have various nonautophagic functions, such as endocytosis and exocytosis (43), another interpretation for the thinning of thyrocytes is that a defect in membrane transport increased colloid accumulation, which led to the thinning of the follicular layer. This issue needs to be clarified in the future.
Similar results were previously reported: neuronal degeneration characterized by growth retardation and progressive motor and behavioral deficits early in life in neural cell‒specific Atg5 or Atg7 KO mice (3, 4); cardiomyopathy in cardiocyte-specific Atg5 KO mice (5); progressive degeneration, impaired insulin secretion (due to lower ATP production), and reduced proliferation in response to a high-fat-diet, an autophagy inducer, in β-cells in β-cell‒specific Atg7 KO mice (6, 44); and liver cell damage and death in hepatocyte-targeted Atg7 KO mice (1)].
We also found increased 8-OHdG levels at 4 months and increased 8-OHdG and 53BP1 levels at 8 and 12 months in Atg5thyr-KO/KO mice. Oxidative stress burdens have been elevated in autophagy-deficient cells; abnormal mitochondria can be a source of ROS (45), and protein refolding in the endoplasmic reticulum by protein disulfide isomerases can also elevate ROS through redox reactions involving free radicals (46). However, higher oxidative stress in both wt and Atg5thyr-KO/KO male mice relative to female mice but similar levels of thyrocyte death between male and female mice suggest that excess oxidative stress is unlikely to be another reason for the degradation of thyrocytes observed in the current study. This sex disparity is in line with previous reports showing a higher antioxidative stress defense in female mice (47–49). On the other hand, it has been reported that the thyroid glands of female rats are exposed to higher oxidative stress because of increased ROS production by NOX4 and decreased ROS degradation (50).
Altogether, our results support a prosurvival role for autophagy in sustaining energy homeostasis and maintaining protein and organelle quality control by eliminating damaged proteins and organelles at the basal levels in thyrocytes. Thus, the critical role of basal autophagic activity in thyrocyte homeostasis should be emphasized. Furthermore, induced autophagy may be crucial for eliminating unnecessary and harmful proteins/damaged organelles and possibly other cellular stresses, thus avoiding cell degeneration/death.
In addition, an association between autophagy and cancer development has been proposed (10). Indeed, it has been demonstrated that liver tumors develop in mosaically Atg5- or Atg7-deficient mice by 6 to 9 months (51, 52). Impaired DNA damage response has been demonstrated in autophagy-deficient cells (53, 54), which, in addition to excess oxidative stress, may be a cause of carcinogenesis. In contrast, we did not observe any abnormally proliferative lesions in the thyroids of Atg5thyr-KO/KO mice during a 12-month experimental course of study. Future studies are needed to elucidate the relationship between autophagy and thyroid carcinogenesis.
Acknowledgments
Financial Support: This study was supported in part by the Japan Society for the Promotion of Science [KAKENHI Grant 16K00548 (to T.K.)] and by a Joint Research Grant from the Network-type Joint Usage/Research Center for Radiation Disaster Medical Science of Hiroshima University, Nagasaki University, and Fukushima Medical University (to Y. Nagayama).
Additional Information
Disclosure Summary: The authors have nothing to disclose.
Data Availability:
All data generated or analyzed during this study are included in this published article or in the data repositories listed in References.
Abbreviations:
- 8-OHdG
8-hydroxy-2′-deoxyguanosine
- 53BP1
p53-binding protein 1
- H&E
hematoxylin and eosin
- KO
knockout
- LC3
microtubule-associated protein 1 light chain 3
- ROS
reactive oxygen species
- thyrocyte
thyroid follicular epithelial cell
- wt
wild-type
