


Abstract
Sex differences in liver gene expression are determined by pituitary growth hormone secretion patterns, which regulate sex-dependent liver transcription factors and establish sex-specific chromatin states. Hypophysectomy (hypox) identifies two major classes of liver sex-biased genes, defined by their sex-dependent positive or negative responses to pituitary hormone ablation. However, the mechanisms that underlie each hypox-response class are unknown. We sought to discover candidate, regulatory, long noncoding RNAs (lncRNAs) controlling responsiveness to hypox. We characterized gene structures and expression patterns for 15,558 mouse liver–expressed lncRNAs, including many sex-specific lncRNAs regulated during postnatal development or subject to circadian regulation. Using the high natural allelic variance of Diversity Outbred (DO) mice, we discovered tightly coexpressed clusters of sex-specific protein-coding genes (gene modules) in male and female DO liver. Remarkably, many gene modules were strongly enriched for sex-specific genes within a single hypox-response class, indicating that the genetic heterogeneity of DO mice encompasses responsiveness to hypox. Moreover, several distant gene modules were enriched for gene subsets of the same hypox-response class, highlighting the complex regulation of hypox-responsiveness. Finally, we identified eight sex-specific lncRNAs with strong negative regulatory potential, as indicated by their strong negative correlation of expression across DO mouse livers with that of protein-coding gene modules enriched for genes of the opposite sex bias and inverse hypox-response class. These findings reveal an important role for genetic factors in regulating responsiveness to hypox, and present testable hypotheses for the roles of sex-biased liver lncRNAs in controlling the sex-bias of liver gene expression.
Sex differences in hepatic gene expression are extensive (1–4) and are associated with sex differences in liver function and susceptibility to hepatocellular carcinoma and metabolic disease (5, 6). The liver also shows notable sex-dependent responses to ischemia-reperfusion injury, liver cirrhosis, chronic alcohol consumption (7–9), and hepatotoxin exposure (10–12). Sex differences in the liver are primarily regulated by GH and its sex-differential patterns of pituitary secretion: pulsatile GH secretion in male and persistent (near-continuous) secretion in female (13, 14). These sex-differential plasma GH patterns regulate the transcriptional activity of STAT5 and its downstream effectors in a sex-dependent manner (2, 15–17). Thus, STAT5 and several STAT5-dependent and GH-regulated transcription factors are essential for the complex liver transcriptomic patterns specific to each sex (1, 16, 18). Furthermore, these GH-responsive transcription factors help establish or maintain sex-differences in chromatin accessibility and chromatin states closely linked to sex-specific gene expression in the liver (17, 19, 20). The sex-biased liver transcriptome includes GH-regulated microRNAs (21) and long noncoding RNAs (lncRNAs) (22), which likely include many nuclear-enriched chromatin regulators that reprogram the epigenetic landscape by diverse mechanisms, including organization of nuclear architecture and recruitment of chromatin modifying enzymes to specific DNA loci, both in cis and in trans (23–25).
The prominent, sex-specific temporal patterns of GH secretion are imprinted by neonatal exposure of males to androgens (26) and appear after 4 weeks of age in rats and mice, when sex-specific liver gene expression first becomes widespread (4, 27). Two major classes of liver sex-biased genes have been identified, based on their responses to the loss of GH and other pituitary hormones after surgical removal of the pituitary gland by hypophysectomy (hypox) (28–30). Male class 1 and female class 1 sex-biased genes are activated in liver by the plasma GH pattern of the sex in which they are more highly expressed, whereas male class 2 and female class 2 sex-biased genes are repressed by the plasma GH pattern of the sex in which they are less highly expressed (Fig. 1). Consequently, when circulating GH is ablated by hypox, sex-biased class 1 genes are downregulated and class 2 genes are derepressed (i.e., upregulated) in mouse liver, which leads to a near-global loss of sex-specific gene expression (28, 29). The molecular basis for these distinct hypox-response phenotypes is poorly understood but likely involves GH effects on the sex-differential chromatin states that characterize many sex-biased genes and their regulatory elements (17, 19).
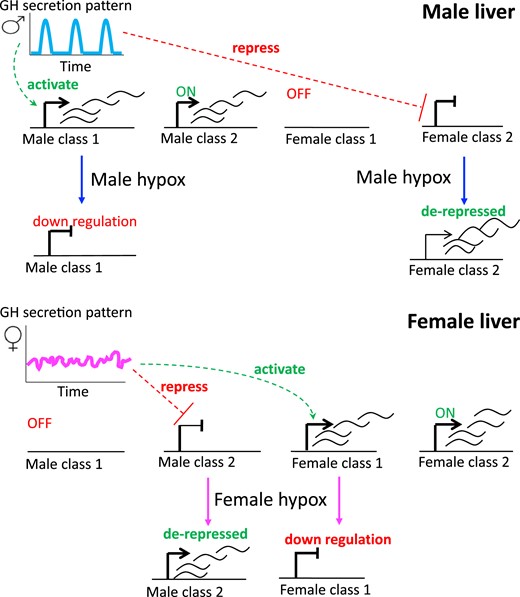
Four hypox-response classes. Male liver is stimulated by GH in a pulsatile manner, every 3 to 4 hours (blue), reflecting the pulsatility of pituitary GH secretion and circulating GH levels, whereas GH stimulation is more persistent in female liver, owing to a more continuous plasma GH pattern (pink). Male-specific and female-specific genes in hypox class 1 are activated by the plasma GH pattern of the sex in which they are more highly expressed. In contrast, male-specific and female-specific hypox class 2 genes are repressed by the plasma GH pattern of the sex in which they are less highly expressed. Consequently, after hypox, class 1 sex-specific genes are downregulated and class 2 genes of the opposite sex specificity are derepressed (i.e., upregulated). Male class 2 genes are constitutively on, and female class 1 genes are constitutively off in male liver, and correspondingly for female class 2 and male class 1 genes in female liver, as indicated.
Weighted gene correlation (i.e., coexpression) network analysis (WGCNA) (31) can be used to identify sets of genes (i.e., gene modules or gene clusters) whose expression is strongly associated with particular cellular processes. WGCNA has been used to discover functional gene modules enriched in liver metabolic and other biological functions (32, 33) and fatty liver disease progression (34), to identify hub genes associated with liver cancer staging (35), and to predict biological functions of lncRNAs differentially expressed in hepatoblastoma (36). Gene modules discovered in mouse brain, liver, muscle, and fat have been used to study sex differences in the organization of gene expression networks, with gene modules discovered in liver and fat found to be the least conserved between the sexes (37).
Here, we investigated whether insight into the hypox-response phenotypes of sex-biased genes and their regulation by lncRNAs can be obtained by using gene modules to discern statistically significant relationships between sex-biased protein-coding genes and sex-biased lncRNAs. We used mouse-liver RNA-sequencing (RNA-seq) data collected under 30 distinct biological conditions to discover and characterize ∼15,000 liver-expressed lncRNAs, including many lncRNAs that show sex-dependent expression (22) and/or are subject to postnatal regulation during liver development (4, 38) or circadian oscillations (39, 40). We then exploited the high genetic variability of Diversity Outbred (DO) mice, a multiparental outbred population derived from eight genetically divergent inbred mouse strains (41–43), to discover statistically significant clusters of sex-biased genes, and we investigated the enrichment of each cluster for genes belonging to each of the four aforementioned hypox-response classes (Fig. 1). This work revealed an unexpected, strong negative correlation across a large panel of DO mouse livers between sex-specific lncRNAs and gene modules enriched for protein-coding genes of the opposite sex and inverse hypox-response class, and generates specific, testable hypotheses for the role of individual sex-biased lncRNAs in the regulatory actions of GH and responses to hypox in the liver.
Materials and Methods
Supplemental files
Supplemental Figs. 1–3, Supplemental Tables 1–9, and Gene Tranfer Format files for the 15,558 liver lncRNAs characterized in this study, including gene structures for all isoforms, are available at https://doi.org/10.5061/dryad.dc877m0 (44).
Discovery of liver-expressed lncRNAs
We collected 186 RNA-seq samples for male and female mouse liver, representing 30 different biological conditions [Supplemental Table 1A (44)] (4, 17, 28, 39, 45–47). Tophat2 (48) was used to map a total of 10.7 billion sequence reads to the C57Bl/6J mouse mm9 reference genome. lncRNA gene structures and isoforms were discovered using the methods we recently described (22), with the following changes: (i) the expression filter was adjusted to remove lowly expressed genes at the level of 10% false-positive rate, instead of 15%, and (ii) lncRNA gene structures whose exons overlapped one or more protein-coding gene exons were removed only if they were on the same strand as the protein-coding gene. The latter modification allowed us to retain gene structures for antisense lncRNAs and intragenic lncRNAs. lncRNAs that did not overlap with any protein-coding gene were designated intergenic. lncRNAs whose exons overlap protein-coding gene introns were designated antisense if they were transcribed from the strand opposite to that of the protein-coding gene; otherwise, they were designated intragenic.
The full list of 15,558 liver-expressed lncRNAs, gene and isoform identification numbers, noncode database accession numbers, including their genomic locations, numbers of exons and isoforms, and RNA-seq expression data under a variety of conditions (see below) are provided in Supplemental Table 2A (44). Gene transfer format files provided in the Supplemental Materials (44) can be uploaded to the University of California, Santa Cruz, Genome Browser to visualize lncRNA gene structures for all isoforms of each liver-expressed lncRNA.
Gene expression quantification for lncRNAs
We devised four approaches for counting sequence reads to quantify lncRNA gene expression: (i) Reads that overlap any exon were counted (all exon counting); (ii) reads that overlap any region from the transcription start site to the transcript end site were counted (gene body counting); (iii) reads that overlap genomic regions that were assigned as exons in all isoforms of a gene were counted (exon-only counting); and (iv) reads that overlap genomic regions that were designated introns in all isoforms of a gene were counted (intron-only counting). These counting methods generally follow the approaches we recently described for protein-coding genes (28). Because reads that map to genomic regions assigned to more than one gene are excluded from the total read counts, intragenic lncRNAs that are wholly contained within another gene will have no read counts when using counting methods 2 and 4. lncRNA expression data analyzed in this study are based on counting method 1 unless noted otherwise.
Reads were counted using featureCounts (49), and differential analysis was performed using edgeR (50). Differential gene expression data are presented as the linear ratio of the expression values for the two conditions compared, with ratios >1 presented as positive fold-change values, and ratios <1 presented as negative fold-change values. For example, a male-biased gene with a male/female linear expression ratio of 4.5 has a fold-change of 4.5, and a female-biased gene with a male/female linear expression ratio of 1:4.5 has a fold-change of −4.5. The false discovery rate (FDR) for antisense lncRNAs was set to 1 for all differential analyses performed using unstranded RNA-seq data sets [Supplemental Table 1A (44)], because the unstranded nature of such data prevented us from reliably assigning sequence reads to an antisense lncRNA vs to an overlapping (sense strand) protein coding gene RNA.
Sex-specific and GH-regulated lncRNAs
Eight mouse-liver RNA-seq data sets [Supplemental Table 1B (44)] composed of the following samples were used to assess the sex-specificity of expression for each lncRNA gene. Data sets 1 through 3 each comprised three independent RNA-seq data sets, all analyzing poly(A)-selected young adult (∼8 to 10 weeks old) CD-1 [Institute of Cancer Research (ICR) strain] mouse total liver RNA; together, these three data sets encompass seven RNA pools for each sex (17, 28). Data sets 4, 6, and 7 each comprised RNA prepared from male and female young adult (∼8 to 10 weeks old) CD-1 (ICR strain) mouse liver, each based on three independent RNA pools for each sex prepared from up to 17 individual mouse livers per pool (17), as follows: data set 4: three pools of ribosomal RNA-depleted total RNA from young adult (∼8 to 10 weeks old) CD-1 (ICR strain) mouse liver; data set 6: three pools of poly(A)-selected nuclear RNA from young adult (∼8 to 10 weeks old) CD-1 (ICR strain) mouse liver; and data set 7: three pools of ribosomal RNA-depleted nuclear RNA. Data set 5 was comprised of 12 male and 12 female livers from 15- to 20-week-old C57Bl/6J mice (4). Data set 8 was comprised of 12 male and 12 female C57Bl/6J mouse livers collected on embryonic day 17.5 (4).
RNA expression levels were compared in male vs female livers for each of the eight data sets using edgeR (50); results are shown in Supplemental Table 2A (44). Any lncRNA with a male/female expression fold-change absolute value >4 at FDR <0.05 in any of the eight data sets was designated as a sex-specific lncRNA. A total of 684 sex-specific lncRNAs met these criteria for one or more of the eight data sets [Supplemental Table 2A, column AA (44)].
Pituitary regulation of sex-specific lncRNAs
Pituitary-regulated (i.e., hypox-responsive) lncRNAs are those whose expression in liver shows a significant change after hypox of either male or female mice, at a fold-change absolute value >2 and FDR <0.05 for comparisons between hypox and intact mice, as determined by edgeR. A total of 283 sex-specific lncRNAs showed hypox responsiveness [Supplemental Table 2A, column R (44)], determined on the basis of RNA-seq data from two independent mouse-liver data sets: one from ribosomal RNA-depleted liver RNA (28) and the other was polyA-selected liver RNA [Supplemental Table 1A (44); the latter hypox data set was also used for lncRNAs gene discovery]. The hypox-responsive, sex-specific lncRNAs were categorized as either class 1 or class 2 male-specific lncRNAs, or as class 1 or class 2 female-specific lncRNAs (Fig. 1), as show in Supplemental Table 2A (44), on the basis of their response to hypox using the aforementioned fold-change and FDR cutoff values, using hypox-response class definitions described previously for protein-coding genes (28, 29). Thus, hypox class 1 sex-specific genes are those that are significantly repressed by hypox in the sex in which they are more highly expressed, and hypox class 2 sex-specific genes are those that are significantly induced by hypox in the sex in which they are less highly expressed (Fig. 1). All but four sex-specific lncRNAs were assigned to the same hypox-response class by both hypox data sets; those four inconsistencies were resolved by assigning the classification indicated by the data set with the higher male/female fold-change.
Developmental and circadian time of day–regulated liver lncRNAs
Ten separate differential expression analyses were performed using edgeR to compare lncRNA expression profiles in C57BL/6J male mouse liver on day 0 (i.e., immediately after birth and before the start of suckling) to gene expression on each of the following postnatal ages: day 1 (i.e., 24 hours after birth) and days 3, 5, 10, 15, 20, 25, 30, 45, and 60 (50). lncRNAs with gene expression fold-change absolute value >2 at FDR <0.05 at any of the listed ages compared with day 0 were designated developmentally regulated lncRNAs, as shown in Supplemental Table 2A (44). lncRNA expression profiles in C57BL/6J male mouse liver at Zeitgeber times (ZTs) ZT2, ZT6, ZT10, ZT14, ZT18 and ZT22 were each compared with each other in 15 pairwise comparisons [Supplemental Table 2B (44)]. On the basis of their differential expression at a fold-change absolute value >2 at FDR <0.05 in at least one pairwise ZT comparison, 307 liver-expressed lncRNAs were candidate circadian lncRNAs [Supplemental Table 2B (44)]. These lncRNAs were evaluated on the basis of the strict definition for circadian expression implemented by JTK cycle (51) using the following parameters: jtkdist(6,2), periods = 5:7, and jtk.init(periods,4). lncRNAs for which q < 0.05 were deemed circadian regulated.
Gene expression quantification in DO mouse liver
RNA-seq data for a set of 112 male and 121 female DO mouse-liver samples, all from mice fed standard chow diet, were downloaded from the Gene Expression Omnibus (GEO), accession numbers GSE45684 (52, 53) and GSE72759 (54). Read mapping and gene expression quantification for each sample was performed as follows. For each liver sample, sequence reads were mapped to the specific diploid genome constructed for that individual mouse. Gene expression was then quantified by counting the sequence reads that overlap any exon by at least 1 bp using featureCounts (49), using the best-mapped location for each read. Following the approach of Munger et al. (53), which has been used by others (55), we mapped RNA-seq reads to a diploid genome and retained genomic location(s) with the best mapping score, allowing the possibility that a read may map equally well to multiple genomic locations. The restriction of only using unique reads for diploid genomes was not applied, because that would restrict the read counts to those sequence reads that map to genome locations where the paternal and maternal allele differ, which would substantially underestimate the level of expression of any given gene. The gene expression level obtained for diploid genomes was based on the total number of reads that overlap the counted regions in either the paternal or the maternal allele.
For downstream analysis, reads counts were transformed to fragments per kilobase of exon per million mapped reads (FPKM), where the average length of the spliced mature RNA in the two alleles was used for exon length. A batch effect that correlated with the GEO accession number of the DO mouse RNA-seq sample was removed from the gene expression level [transformed to log2(FPKM + 1)] using the ComBat function in the sva R package (56). Supplemental Table 3A (male DO mice) and Supplemental Table 3B (female DO mice) show expression levels for ∼17,850 protein-coding genes and ∼1950 multiexonic, intergenic lncRNAs expressed in at least one sample across the full set of DO mouse livers.
Clustering sex-specific protein-coding genes
Analyses were carried out using a set of 1033 sex-specific protein coding genes [Supplemental Table 4 (44)], defined as a set of protein-coding genes that showed significant sex-specific gene expression in either CD-1 or C57B/6J mouse liver (male/female fold-change absolute value >2 and FDR <0.05) or in any of the eight DO mouse founder strains by microarray analysis (male/female fold-change absolute value >1.5 and FDR <0.05) (41, 57). Sex-specific protein-coding genes were clustered on the basis of their gene-expression correlation across 112 male DO mouse livers, and separately across 121 female DO mouse livers, using WGCNA (31). WGCNA identifies gene modules on the basis of pairwise gene expression correlations across all samples.
The correlation matrix was transformed into an adjacency matrix, which reflects the distance between genes, on the basis of weighted gene-expression correlations. Weights were introduced by raising the actual gene expression correlation to a power of β, which leads to more robust gene similarity measures. WGCNA parameters were set as follows: correlation function = the bicor function (58) with the maxPOutliers set to 0.1, type of network = signed hybrid, minimum module size = five genes, soft thresholding power (β) = 3, deepSplit = 3, and cutTreeHeight = 0.25 to merge similar modules. Other parameters were used at their default settings. Genes that were not expressed (FPKM = 0) in any set of livers (male liver samples, or separately, female liver samples) were excluded from the clustering analysis, as were genes whose median absolute deviation score (a robust measure of variability) is 0. This resulted in 1018 and 1014 of the 1033 sex-specific, protein-coding genes being clustered in male and female DO mouse liver samples, respectively, giving 1019 unique genes in total. The overlap between the two gene sets was high (1013 of 1019 genes).
Similarities between protein-coding gene modules in each sex were measured by pairwise Pearson correlation between their first principal components, which was calculated using the moduleEigenGenes function in WGCNA. The correlation matrix was then clustered using average linkage hierarchical clustering with default parameters.
Enrichment of various gene sets for protein-coding gene modules
To determine if any of the protein-coding gene modules identified by WGCNA is enriched for one or more gene sets with biological meaningful properties, we used the hypergeometric test to assess the significance of overlap between the gene sets being compared. An overlap at q < 0.05 indicates significant enrichment for the overlapping gene set. Enrichment for each of the following gene sets was tested for each gene module: male-specific genes, female-specific genes, strongly sex-specific genes (i.e., male/female fold-change absolute value >4), on the basis of our listing of 1033 sex-specific genes [Supplemental Table 4 (44)], and male hypox class 1 genes, male hypox class 2 genes, female hypox class 1 genes, and female hypox class 2 genes [Supplemental Table 3 of Connerney et al. (28) lists protein-coding genes assigned to each of the four indicated hypox-response gene classes].
To calculate the enrichment of male-specific genes in cluster i (i.e., module i), we let mc equal the number of male-specific genes in cluster i; gc equal the number of genes in cluster i; g = number of genes included in the cluster analysis (i.e., either 1018 sex-specific genes for male liver samples or 1014 sex-specific genes for female liver samples, as noted previously); and m equal the number of male-specific genes in g (i.e., in the sets of 1018 or 1014 sex-specific genes included in the analysis).
Next, the probability of observing at least x male-specific genes in cluster i [P(number of male-specific genes ≥ x)] was defined by the probability of drawing x or more male-specific genes, given that we are drawing gc number of genes from g genes, which has m male-specific genes. This was implemented using the following R command: 1 - phyper(x-1, m, g-m, gc, lower.tail = TRUE, log.P = FALSE). The same formula was used to calculate enrichment for other gene sets, except we replaced the male-specific gene set with the other gene sets of interest. Adjusted P values (or q values) were generated using the qvalues package in R (59).
Properties of protein-coding gene clusters
Nine properties were assessed for each gene module discovered by WGCNA analysis: the number of genes in each module; the number of distinct topologically associated domains (TADs) (60), in which the genes in each module are found; the percentage of genes in each module that show strong sex bias [male/female fold-change absolute value >4 at FDR <0.05); Supplemental Table 4 (44)]; the percentage of male-specific genes or of female-specific genes in each module [Supplemental Table 4 (44)]; and the number of male-specific class 1, male-specific class 2, female-specific class 1, and female-specific class 2 genes in each module, expressed as a percentage of all hypox-responsive genes [as defined in Supplemental Table 3 of Connery et al. (28)] in the gene module.
Correlating lncRNAs with protein-coding genes clusters
To identify sex-specific lncRNAs that show a significant positive or negative correlation with WGCNA-discovered protein-coding gene modules, we calculated the Pearson correlation between (i) the expression pattern of each lncRNA across the full set of 112 male DO mouse livers and, separately, across the full set of 121 female DO mouse livers; and (ii) the first principal component of each protein-coding gene module across the same DO mouse-liver sets, which we calculated using the moduleEigenGenes function in WGCNA with default parameters. We calculated all lncRNA−gene module correlation pairs in male DO liver samples, and separately in female DO liver samples.
P values for the significance of the correlations were obtained using the cor.test function in R and adjusted by the FDR method. Because of the unstranded nature of the DO mouse-liver RNA-seq data sets, this analysis was limited to the set of 168 multiexonic, intergenic, sex-specific lncRNAs [Supplemental Table 2A, column AB (44)]. Top correlations were those that met the threshold FDR < 0.001. Correlations between 73 sex-specific liver lncRNAs (40 lncRNAs showing significant correlation with any gene modules in male liver, and 52 lncRNAs showing significant correlations with any gene modules in female liver) across the full set of 112 male DO mouse livers and, separately, across the full set of 121 female DO mouse livers, for the sets of 1018 and 1014 sex-biased protein-coding genes are shown in Supplemental Table 5A and 5B, respectively (44).
Enhancer RNA identification
We obtained 27 global run-on sequencing samples from C57BL/6J male liver from GEO (GSE36916, GSE59486) (39, 40). Poly-A tails were trimmed from sequence reads using HOMER (61) using the following parameters: motif: AAAAAA or TTTTTT, mismatch = 2, minMatchLength = 5, and -min = 20. Sequence reads were mapped to the C57BL/6J mouse mm9 reference genome using Bowtie2 (62), and mapped reads were used to discover peaks using HOMER with the following parameter settings: L = 3 and bodyFold = 3. Every peak in the positive strand was paired with the nearest peak in the reverse strand. Peak pairs that were >500 bases apart and converging into the same direction were removed. Enhancer RNA (eRNA) loci were defined as the 1-kb regions centered at the overlapping region in each peak pair.
A total of 15,853 eRNA loci overlapped with either an H3K27ac peak region or an H3K4me1 peak region, identified in either male or female young adult mouse liver (19), and were retained. See Supplemental Table 6 (44) for a list of liver eRNAs. A total of 219 (1.4%) of these liver eRNAs overlap eRNAs from the Fantom5 project (63), which did not include liver tissue in the set of samples used for eRNA discovery.
Results
Discovery of 15,558 liver-expressed lncRNAs
We previously described 4961 mouse liver–expressed intergenic lncRNAs by analysis of RNA-seq data sets representing five biological states and characterized their gene expression patterns, species, conservation, and transcriptional regulation (22). Here, we used 186 RNA-seq data sets from mouse livers representing 30 different biological conditions [Fig. 2A and 2B; Supplemental Table 1A (44)] to obtain a more comprehensive set of lncRNA gene structures, including many antisense and intragenic lncRNAs, which may contribute to the transcriptional regulation of nearby genes (64–66). The biological conditions represented include livers from mice ranging in age from embryonic day 17.5 to postnatal age 20 weeks, mice whose plasma GH patterns were altered, mice treated with foreign chemical agonists of liver nuclear receptors, and mice euthanized at different times of the day to identify gene expression changes due to circadian rhythm (4, 17, 28, 39, 45–47).
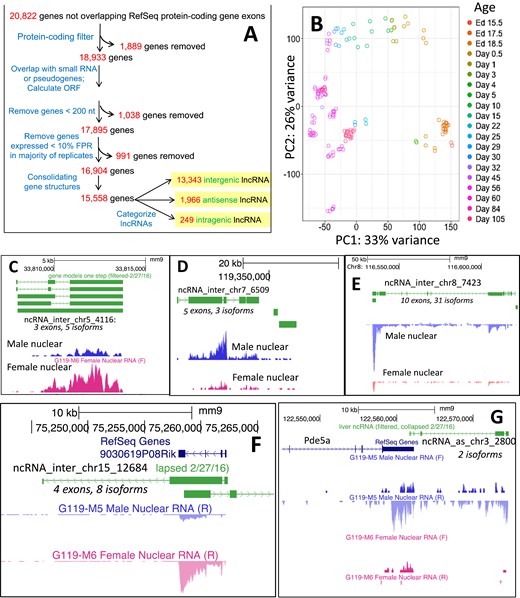
Mouse liver–expressed lncRNAs. (A) Pipeline used for discovery of 15,558 liver-expressed lncRNAs, based on Melia et al. (22), except only gene structures whose exons overlap protein-coding gene exons transcribed in the same direction were removed. Of the 15,558 lncRNAs, 13,343 did not overlap any protein-coding gene and, therefore, were designated intergenic; 1,966 lncRNAs were designated antisense on the basis of their overlap with the antisense strand of a protein-coding gene; and 249 lncRNAs were designated intragenic (i.e., they were transcribed in the same direction as an overlapping protein-coding gene, but without any exonic region overlap). Data characterizing the 15,558 liver-expressed lncRNAs are presented in Supplemental Table 2A (44). (B) Principal component analysis of 186 RNA-seq samples used to discover liver-expressed lncRNAs. The first principal component separates the livers by the age of the mice from young to old (right to left; ages are indicated on the right). (C–G) Examples of sex-specific lncRNAs discovered in this study. Gene structures of lncRNAs are shown in green. Shown are wig files based on sequencing reads for male and female nuclear RNA-seq samples. (C) Intergenic lncRNA showing strong female-biased gene expression. (D, E) Intergenic lncRNAs showing strong male-biased gene expression. Additional details about these two lncRNAs are shown in Table 2 and Supplemental Fig. 2 (44). (F) Female-specific lncRNA, ncRNA_inter_chr15_12684, that is transcribed on the reverse strand and overlaps ncRNA_inter_chr15_12685, which is transcribed on the forward strand. Corresponds to RefSeq noncoding gene 9030619P08Rik. (G) Male-specific, antisense lncRNA, ncRNA_as_chr3_2800, that is transcribed on the reverse strand and overlaps Pde5a, which is transcribed on the forward strand. chr, chromosome; Ed, embryonic day; F, forward strand; FPR, false-positive rate; inter, intergenic; ncRNA, noncoding RNA; ORF, open reading frame; PC, principal component; R, reverse strand; RefSeq, National Center for Biotechnology Information Reference Sequence database.
A total of 10.7 billion reads mapping to the reference genome were used to discover 15,558 liver-expressed lncRNAs and their gene structures and isoforms [Supplemental Table 2A (44)]. Of these lncRNAs, 13,343 were intergenic (Fig. 2C–2F), 1966 were antisense (Fig. 2G), and 249 were intragenic lncRNAs (Fig. 2A). Sixteen percent (n = 2098) of the intergenic lncRNAs were transcribed from multiexonic genes, as were 47% (n = 916) of the antisense and 55% (n = 138) of the intragenic lncRNAs. We determined that 2847 lncRNAs (18%) overlap with eRNAs [Supplemental Table 2A, column Q; Supplemental Table 6 (44)], whose expression correlates positively with transcription of nearby genes (67) and thus may regulate the activation of proximal genes. Of the 15,558 liver-expressed lncRNAs, 44% are not found in databases for noncoding RNAs (22, 68, 69) [Supplemental Table 2A, columns D and E (44)] and are considered novel.
Regulation of sex-specific lncRNAs in male liver
The liver transcriptome undergoes significant changes during postnatal development (27, 38, 70). Sex-biased gene expression emerges at ∼4 weeks of age, when many adult-liver sex-biased genes show developmentally regulated expression changes, most notably in male liver (27). We identified 684 lncRNAs, including 168 multiexonic, intergenic transcripts, that showed significant sex-biased expression in one or more of the eight data sets examined [male/female fold-change absolute value >4 at FDR <0.05; Supplemental Table 2A (44)]. Sex-specific lncRNA expression was a characteristic of young adult and adult liver (643 of all 684 sex-biased lncRNAs) but was much less common in fetal liver (48 of all 684 sex-biased lncRNAs, of which seven also showed sex bias at adulthood) [Supplemental Fig. 1, lane 8 vs lanes 1–7; Supplemental Table 2A (44)]. Furthermore, 144 of the 684 sex-specific lncRNAs were differentially expressed (greater than a twofold change at FDR <0.05) at one or more ages in postnatal mouse liver (day 1 to day 60) compared with birth (day 0) [Fig. 3A; Supplemental Table 2A and 2C (44)].
![Sex-specific lncRNAs that showed significant regulation during postnatal liver developmental and during 24-hour light-dark cycle periods in male mouse liver. (A) Heat map of 144 sex-specific lncRNAs (male/female fold-change absolute value >4 at FDR <0.05 in any of eight RNA-seq data sets comparing male and female liver) that also showed a significant change in expression (fold-change absolute value >2 and FDR <0.05) at any time from birth to maturity [Supplemental Table 2A (44)]. The first eight columns of the heat map correspond to the eight data sets used to identify sex-specific lncRNAs [datasets numbered as in Supplemental Table 1B (44)]. The 11 columns at the right show the change in expression in male liver at a particular age, as compared with postnatal day 20, for each sex-specific lncRNA shown in the first eight columns. Thus, the lncRNA gene order from top to bottom is the same for all 19 columns. Complete linkage clustering was used to cluster all 19 columns with default parameters in R. Blue denotes upregulation of gene expression in male liver, as compared with day 20, and red denotes downregulation. Gene sets I and II (see bar at right) designate male-specific genes that were strongly upregulated in male liver after day 20 (set I) or do not show strong upregulation (set II). Set III comprises female-specific genes that are repressed after day 20, and set IV comprises female-specific genes that showed increased expression after day 20 while maintaining their male-specific expression at adulthood. See Supplemental Table 2C (44) for listings of lncRNAs in each gene set. A corresponding heat map for the full set of 684 sex-specific lncRNAs is shown in Supplemental Fig. 1 (44). Many of the 684 sex-specific lncRNAs not included in the set of 144 shown here are primarily nuclear lncRNAs and are expressed at too low a level in the total liver RNA samples analyzed to yield reliable expression data across the developmental time course. (B) The 24-hour oscillating gene expression profiles are presented for eight lncRNAs shown by JTK analysis to be subject to robust circadian regulation, two of which show sex-specific expression: ncRNA_inter_chr2_1432 and ncRNA_inter_chr7_6509. y-Axis: Gene expression level, in FPKM. Data are shown for two replicate data sets. chr, chromosome; inter, intergenic; intra, intragenic; Nucl, nuclear; Rep, repetition.](https://oup.silverchair-cdn.com/oup/backfile/Content_public/Journal/endo/160/5/10.1210_en.2018-00949/1/m_en.2018-00949f3.jpeg?Expires=1750886001&Signature=QSJ~8cwxknDjNkmBYMkN9gOJNj2GqL0yKILC5cSrzXEC~b7ZtKqnye2edGEV-HOjDDbSvVd6OujilwuAeWR59QaVNdGgRyST3IVbMVp~N8WC0KGpIMhu2-VBpuZtXn0gXXKPTCwxaHzmDjVGrCEOgruqX1ZolNBEbRj8jALKwEGYc42ueciw~V2MCXmfnX-DqC6slLIgvH4PxhBbAmyxgucRWL3T46Ub7lOh-YvujhRqoGv8f67PDTz2eyRRILE4i4d-KJ3NaPhpp6B1IfIwvlbjrNcrKCUU0IFSb~cLA8fdTKm2B0I9O7crGJgW7vPYQjEaKTKNAPRDli68B~AWSg__&Key-Pair-Id=APKAIE5G5CRDK6RD3PGA)
Sex-specific lncRNAs that showed significant regulation during postnatal liver developmental and during 24-hour light-dark cycle periods in male mouse liver. (A) Heat map of 144 sex-specific lncRNAs (male/female fold-change absolute value >4 at FDR <0.05 in any of eight RNA-seq data sets comparing male and female liver) that also showed a significant change in expression (fold-change absolute value >2 and FDR <0.05) at any time from birth to maturity [Supplemental Table 2A (44)]. The first eight columns of the heat map correspond to the eight data sets used to identify sex-specific lncRNAs [datasets numbered as in Supplemental Table 1B (44)]. The 11 columns at the right show the change in expression in male liver at a particular age, as compared with postnatal day 20, for each sex-specific lncRNA shown in the first eight columns. Thus, the lncRNA gene order from top to bottom is the same for all 19 columns. Complete linkage clustering was used to cluster all 19 columns with default parameters in R. Blue denotes upregulation of gene expression in male liver, as compared with day 20, and red denotes downregulation. Gene sets I and II (see bar at right) designate male-specific genes that were strongly upregulated in male liver after day 20 (set I) or do not show strong upregulation (set II). Set III comprises female-specific genes that are repressed after day 20, and set IV comprises female-specific genes that showed increased expression after day 20 while maintaining their male-specific expression at adulthood. See Supplemental Table 2C (44) for listings of lncRNAs in each gene set. A corresponding heat map for the full set of 684 sex-specific lncRNAs is shown in Supplemental Fig. 1 (44). Many of the 684 sex-specific lncRNAs not included in the set of 144 shown here are primarily nuclear lncRNAs and are expressed at too low a level in the total liver RNA samples analyzed to yield reliable expression data across the developmental time course. (B) The 24-hour oscillating gene expression profiles are presented for eight lncRNAs shown by JTK analysis to be subject to robust circadian regulation, two of which show sex-specific expression: ncRNA_inter_chr2_1432 and ncRNA_inter_chr7_6509. y-Axis: Gene expression level, in FPKM. Data are shown for two replicate data sets. chr, chromosome; inter, intergenic; intra, intragenic; Nucl, nuclear; Rep, repetition.
A majority of the developmentally regulated lncRNAs showing male-specific expression were strongly upregulated in male liver after 20 days of age [in Fig. 3A, gene set I, 70% of 79 male-biased lncRNAs; i.e., beginning around puberty, consistent with the patterns found for male-biased protein-coding genes (27)]. In contrast, a majority of female-specific lncRNAs were downregulated in male liver after 20 days of age (in Fig. 3A, set III; 71% of 65 female-biased lncRNAs). Other female-specific lncRNAs were upregulated in male liver after age 20 days (Fig. 3A, set IV), while maintaining their female-biased expression in adulthood. Similar patterns were found for sex-specific protein-coding genes (27).
Many liver-expressed genes exhibit oscillating gene expression patterns with a period of ∼24 hours (39, 40). These circadian patterns are maintained by feedback loop mechanisms orchestrated by several transcription factors (39, 71, 72). We examined the expression of lncRNAs in male liver every 4 hours over 24 hours, from ZT2 (i.e., 2 hours after animals were exposed to light during a 12-hour light and 12-hour dark cycle) to ZT22. A total of 307 liver lncRNAs, including 61 sex-specific liver lncRNAs, were differentially expressed (fold-change absolute value >2 at FDR <0.05) at one or more time points [Supplemental Table 2B; Supplemental Fig. 1B (44)] and are candidates for circadian lncRNAs.
Using JTK cycle (51) to strictly assess the rhythmicity of these lncRNA gene expression profiles, we identified eight lncRNAs that showed classical circadian oscillations (q < 0.05), two of which also showed strong female-specific expression (Fig. 3B). Overall, 191 sex-biased lncRNAs were regulated during postnatal liver development or during the course of a 24-hour light-dark cycle.
Protein-coding gene clusters are enriched for biologically relevant traits
Liver-expressed sex-specific genes can be classified on the basis of their responses to hypox and the resultant loss of circulating GH (28, 29). Class 1 sex-biased genes are subject to positive pituitary regulation in the sex in which they show higher expression, and where their expression declines after hypox. In contrast, class 2 sex-biased genes are subject to negative pituitary regulation in the sex in which they show lower expression, and where their expression is induced (derepressed) after hypox (Fig. 1). Little is known about the underlying mechanisms that determine these distinct responses to hypox.
Given the major role of chromatin state in determining sex-dependent responses to GH (17, 19, 20) and the established role of many lncRNAs as chromatin regulators (23–25), we hypothesize that sex-specific lncRNAs play a role in this regulation. To investigate this possibility, we used a large panel of RNA-seq data sets for DO mouse liver to determine whether there is a strong genetic regulatory component for each hypox-response class. DO mice have a natural high allelic variance that manifests as a variable gene expression pattern in each individual mouse (52–54). We used WGCNA (31) to cluster sex-specific protein-coding genes on the basis of their gene expression correlations across male DO livers and, separately, female DO livers. We identified 40 gene modules (gene clusters) based on male DO mouse-liver expression patterns and 44 other gene modules on the basis of expression patterns across female DO mouse livers [Fig. 4; Supplemental Table 7A–7D (44)].
![Gene modules (gene clusters) for sex-specific genes discovered in (A) DO male mouse liver and, separately, (B) in DO female liver. [(A), (B), top of each panel] Hierarchical clustering of the gene modules discovered by WGCNA showing the relationship between all gene modules, as defined by the correlation of their first principal component. Distant sets of modules are enriched in male hypox class 1 (M1 ovals), and in female hypox class 1 (F1 ovals) and class 2 (F2 ovals), highlighting the complexity of genetic factors affecting these response classes. Gene modules are named by colors, as indicated; in several cases the name (i.e., color) assigned to a give gene module, discovered in DO male mouse liver, is the same name as was assigned to one of the modules discovered in DO female mouse liver and shown in panel (B); however, there is no relationship between such modules. Thus, DO male mouse-liver cluster Cyan, with 71 genes shown in panel (A), is not related to DO female mouse liver cluster Cyan, with 20 genes, shown in panel (B). (A) Branch A consists of protein-coding gene modules that show significant enrichment for female-specific genes; branch B consists of protein-coding gene modules significantly enriched for male-specific genes. Ovals highlight examples of subbranches whose nodes are enriched for the indicated hypox-response gene class. Branch A includes two well-separated separate clusters of modules, both of which are significantly enriched for female hypox class 2 genes (F2), and similarly, for well-separated clusters of male hypox class 1 gene modules (M1) in branch B. (B) Branch A primarily consists of protein-coding gene modules enriched for female-specific genes, and branch B contains protein-coding gene modules enriched for male-specific genes and also one module enriched for female hypox class 1 genes. The average number of genes in each female liver–derived gene module (23 genes per module) was similar to that for the male liver gene modules (25.5 genes per module). [(A), (B), bottom of each panel] Shown are nine tracks (rows) that display information about each of nine features associated with each gene module. The numbers below each track refer to numbers of genes, TADs, or percentages, as indicated, for the module whose name is given in the cluster tree above it. The first track indicates the number of genes in each module, and the second track indicates the number of distinct TAD genomic regions represented in the module. The number of genes is very similar to the number of TADs, indicating that most of the genes in each module are found in separate TADs in the mouse genome. The next three tracks show the percentage of genes in each module that are either strongly sex-specific (fold-change >4; track 3) or that show male-specific (track 4) or female-specific expression (track 5). The next four tracks indicate the percentage of genes distributed in each of the four hypox-response gene classes: male-specific class 1 and class 2, and female-specific class 1 and class 2. These percentages were calculated with respect to the subset of genes in each gene module that showed a significant response to hypox; consequently, for each module, the sum of percentages for the last four tracks should equal 100%. The percentage values shown in rows 6 through 9 of both panels add up to 100% and are only shown for gene modules that overlap significantly with the relevant gene set (hypergeometric test, q < 0.05). %F, percent female; %FC, percent fold change; %M, percent male.](https://oup.silverchair-cdn.com/oup/backfile/Content_public/Journal/endo/160/5/10.1210_en.2018-00949/1/m_en.2018-00949f4.jpeg?Expires=1750886001&Signature=WdHZ4AXpjaqs9dPNYzXs1csJf-D4A94OMVbS7zpIA-VIogMjMbOMUq1o~jDPdo5Zh8rsYaKVjJ43cdB4JZ23pzfrDgDickFdsaSASZ52I78xqJBiAGWGEjed1L-C8bDRrYfN1qjtrif~3wAbqCVk9JKD6oWmbC3-cbEBKjx9lhXwDwcm4FhCh5UXoqweX7pTJgE8kCPS4-EMxdwYnq1gmVh0Ygzsw8y2QVqTav-jKFENteTJBkeLaViP8hE3cVCXM-JBKcMSxkfNdZtBRHP0EHI2~ksYO1U533tgrDIMB1L3Y6sNHICAg6d2tsDVFy-TZlL1ICIs~DH2w9D5ruPb1A__&Key-Pair-Id=APKAIE5G5CRDK6RD3PGA)
Gene modules (gene clusters) for sex-specific genes discovered in (A) DO male mouse liver and, separately, (B) in DO female liver. [(A), (B), top of each panel] Hierarchical clustering of the gene modules discovered by WGCNA showing the relationship between all gene modules, as defined by the correlation of their first principal component. Distant sets of modules are enriched in male hypox class 1 (M1 ovals), and in female hypox class 1 (F1 ovals) and class 2 (F2 ovals), highlighting the complexity of genetic factors affecting these response classes. Gene modules are named by colors, as indicated; in several cases the name (i.e., color) assigned to a give gene module, discovered in DO male mouse liver, is the same name as was assigned to one of the modules discovered in DO female mouse liver and shown in panel (B); however, there is no relationship between such modules. Thus, DO male mouse-liver cluster Cyan, with 71 genes shown in panel (A), is not related to DO female mouse liver cluster Cyan, with 20 genes, shown in panel (B). (A) Branch A consists of protein-coding gene modules that show significant enrichment for female-specific genes; branch B consists of protein-coding gene modules significantly enriched for male-specific genes. Ovals highlight examples of subbranches whose nodes are enriched for the indicated hypox-response gene class. Branch A includes two well-separated separate clusters of modules, both of which are significantly enriched for female hypox class 2 genes (F2), and similarly, for well-separated clusters of male hypox class 1 gene modules (M1) in branch B. (B) Branch A primarily consists of protein-coding gene modules enriched for female-specific genes, and branch B contains protein-coding gene modules enriched for male-specific genes and also one module enriched for female hypox class 1 genes. The average number of genes in each female liver–derived gene module (23 genes per module) was similar to that for the male liver gene modules (25.5 genes per module). [(A), (B), bottom of each panel] Shown are nine tracks (rows) that display information about each of nine features associated with each gene module. The numbers below each track refer to numbers of genes, TADs, or percentages, as indicated, for the module whose name is given in the cluster tree above it. The first track indicates the number of genes in each module, and the second track indicates the number of distinct TAD genomic regions represented in the module. The number of genes is very similar to the number of TADs, indicating that most of the genes in each module are found in separate TADs in the mouse genome. The next three tracks show the percentage of genes in each module that are either strongly sex-specific (fold-change >4; track 3) or that show male-specific (track 4) or female-specific expression (track 5). The next four tracks indicate the percentage of genes distributed in each of the four hypox-response gene classes: male-specific class 1 and class 2, and female-specific class 1 and class 2. These percentages were calculated with respect to the subset of genes in each gene module that showed a significant response to hypox; consequently, for each module, the sum of percentages for the last four tracks should equal 100%. The percentage values shown in rows 6 through 9 of both panels add up to 100% and are only shown for gene modules that overlap significantly with the relevant gene set (hypergeometric test, q < 0.05). %F, percent female; %FC, percent fold change; %M, percent male.
Unexpectedly, one-third of the sex-biased gene modules showed significant enrichment for either male-specific or female-specific protein coding genes (Fig. 4A and 4B, rows 4 and 5, respectively), even though the gene modules were identified using expression data from a single sex of DO mice. Thus, in DO male livers, 13 gene modules encompassing 277 protein-coding genes were significantly enriched for male-specific genes (hypergeometric test, q < 0.05), and an additional six gene modules encompassing 367 protein-coding genes were significantly enriched for female-specific genes (Table 1). A similar pattern was seen for the gene modules discovered in DO female livers (Table 1). Furthermore, a subset of the gene modules showed significant enrichment for strongly sex-specific genes (male/female fold-change absolute value >4; Fig. 4A and 4B, row 3). Of note, although overall statistics and enrichments were similar for the gene modules based on male and female DO livers (Table 1), 33 of the 40 gene modules discovered in the male livers (Fig. 4A) did not have a counterpart (defined as <50% gene overlap) in any of the female liver gene modules [Supplemental Fig. 2 (44)].
Enrichments of Gene Modules Discovered in Male and, Separately, in Female DO Mouse Liver for Sex-Specific and Hypox-Responsive Genes
| DO Mouse Liver Samples | Clusters Enriched for Male-Specific Genes | Clusters Enriched for Female-Specific Genes | Clusters Enriched for Male Class I Genes | Clusters Enriched for Male Class II Genes | Clusters Enriched for Female Class I Genes | Clusters Enriched for Female Class II Genes | ||||||
|---|---|---|---|---|---|---|---|---|---|---|---|---|
| No. of Clustersa | No. of Genesb | No. of Clusters | No. of Genes | No. of Clusters | No. of Genes | No. of Clusters | No. of Genes | No. of Clusters | No. of Genes | No. of Clusters | No. of Genes | |
| Male livers | 13 | 277 | 6 | 367 | 5 | 163 | 1 | 21 | 1 | 10 | 3 | 166 |
| Female livers | 6 | 157 | 3 | 343 | 3 | 98 | 0 | 0 | 2 | 25 | 3 | 342 |
| No. of common genesc | 111 | 217 | 58 | 0 | 3 | 122 | ||||||
The No. of Clusters columns indicate the number of clusters that showed significant enrichment for the indicated gene sets.
The No. of Genes columns indicate the total number of genes that belonged to the enriched gene clusters.
The number of genes that overlap in male and female liver in each column.
Even more striking, many of the gene modules were significantly enriched for one of four biologically relevant traits, defined by the change in expression after hypox (i.e., class 1 or 2 male-specific genes, and class 1 or class 2 female-specific genes) [Fig. 4A and 4B, rows 6 through 9; Supplemental Table 8A and 8B (44)]. Thus, significant enrichments were found in the gene modules discovered in the set of DO male livers for each of the four hypox-response gene classes (Table 1): five gene modules (encompassing 163 genes) were enriched for male hypox class 1 genes, one gene module (encompassing 21 genes) was enriched for male hypox class 2 genes, one module (encompassing 10 genes) was enriched for female hypox class 1 genes, and three modules (encompassing 166 genes) were enriched for female hypox class 2 genes. Similar patterns of enrichment for each hypox-response gene class characterized the gene modules discovered in DO female liver (Table 1; Fig. 4B).
These enrichments were unanticipated, because the liver samples used to discover gene modules come from DO mice, which have an intact pituitary gland and express genes in the liver in a sex-biased manner, and were therefore not expected to manifest hypox-response phenotypes. The significant enrichment of many DO mouse sex-biased liver gene modules for a single hypox-response class (Fig. 4) indicates that the genetic diversity of DO mice captures a key mechanistic feature of sex-biased gene regulation. Presumably, one or more regulatory factors that determine hypox-responsiveness is altered by genetic variants present in the DO mouse founder strains. Such variants are likely to affect trans regulatory factors, insofar as a majority of the genes that populate each gene module are from disparate genomic regions, as indicated by their mapping to many different genomic domains (TADs) (60) (Fig. 4A and 4B, row 2).
Sex-biased lncRNAs negatively correlate with sex-opposite and inverse hypox class–enriched protein-coding gene clusters
Next, we considered whether any of the 168 sex-specific multiexonic, intergenic lncRNAs identified might be a regulator of any of the sex-specific, protein-coding gene modules. Strong correlations (FDR <0.001) were seen between sex-biased protein coding gene modules and 73 of the 168 sex-specific lncRNAs, with 40 of the 73 lncRNAs showing correlations across the panel of DO male livers and 52 of the 73 lncRNAs showing correlations in DO female livers [Supplemental Table 9A and 9B (44)]. Most of these were positive correlations, which could simply indicate that the lncRNAs and the genes in the protein-coding gene module respond to the same genetic modifiers across the DO mouse founder strains (i.e., are coregulated and therefore coexpressed). We focused on negative correlations between lncRNA expression patterns and DO mouse-liver gene modules, because they have a greater likelihood of reflecting a regulatory relationship between an lncRNA and a gene module.
We identified eight lncRNAs that displayed a highly significant (FDR <0.0001) negative correlation with one (or in some cases, two closely related) protein coding gene modules that are enriched (q < 0.05) for sex-opposite genes of the inverse hypox class [Table 2; Fig. 5; Supplemental Fig. 2; Supplemental Table 9C (44)]. The corresponding seven strong negatively correlated sex-biased gene modules shown in Table 2 encompass a total of 85 male-biased genes and 93 female-biased genes. Negative correlations between a lncRNA and sex-opposite protein coding genes of the inverse hypox class are consistent with the models for negative regulation shown in Fig. 6. Four of the eight lncRNAs are male hypox class 1 lncRNAs, whose expression patterns across female DO mouse livers show significant negative correlation with a total of two protein-coding gene modules enriched for female hypox class 2 genes (Table 2, top 4 rows). Furthermore, one male hypox class 2 lncRNA (inter_chr10_9000) showed very strong negative correlation in female liver with a third protein-coding gene module (grey60), which was enriched in female class 1 genes (Fig. 5A). These negative associations were specifically seen in female DO livers, where expression of an inhibitory male-specific lncRNA regulator would need to be kept at a low level for female-specific genes of the inverse hypox class to achieve female-specific expression. Of note, the grey60 female liver protein-coding gene cluster negatively associated with male-specific lncRNA inter_chr10_9000 was significantly enriched for highly female-specific genes (sex-specificity greater than fourfold) [Fig. 5A; Supplemental Table 9C (44)].
Sex-Specific lncRNAs That Showed Strong Negative Correlations With Sex-Specific Protein Coding Gene Modules of the Opposite Sex Bias and Inverse Hypox-Response Class
| Sex-Specific lncRNAa | Hypox-Response Class of the lncRNA | DO Mouse Liver Data Set Used to Discover Gene Module Showing Negative Correlation | Pearson Correlation Coefficient | Significance of Correlation (FDR) | Sex-Specific Protein-Coding Gene Module | Hypox-Response Class That Shows Enrichment in the Gene Module | Significance of Hypox-Class Enrichment of Gene Module (q value) | No. of Genes in the Module | Overlaps eRNA |
|---|---|---|---|---|---|---|---|---|---|
| ncRNA_inter_chr7_6509 | MC 1 | Female | −0.59 | 1.05E−09 | darkorange | FC 2 | 3.70E−02 | 13 | Yes |
| ncRNA_inter_chr6_5316 | MC 1 | Female | −0.47 | 1.01E−05 | green | FC 2 | 7.13E−05 | 57 | No |
| ncRNA_inter_chr1_630 | MC 1 | Female | −0.45 | 3.82E−05 | green | FC 2 | 7.13E−05 | 57 | No |
| ncRNA_inter_chr8_7423 | MC 1 | Female | −0.44 | 5.70E−05 | green | FC 2 | 7.13E−05 | 57 | Yes |
| ncRNA_inter_chr10_9000 | MC 2 | Female | −0.60 | 3.35E−10 | grey60 | FC 1 | 5.92E−05 | 18 | Yes |
| ncRNA_inter_chr2_1430 | FC 2 | Male | −0.51 | 4.04E−06 | pink | MC 1 | 4.76E−04 | 40 | No |
| ncRNA_inter_chr2_1430 | FC 2 | Male | −0.48 | 1.18E−05 | lightcyan | MC 1 | 1.91E−03 | 23 | No |
| ncRNA_inter_chr10_9222 | FC 2 | Female | −0.47 | 1.01E−05 | skyblue | MC 1 | 2.52E−02 | 12 | No |
| ncRNA_inter_chr3_2937 | FC 2 | Female | −0.54 | 1.27E−07 | greenyellow | MC 1 | 4.41E−05 | 22 | Yes |
Abbreviations: chr, chromosome; FC, female class; inter, intergenic; MC, male class; ncRNA, noncoding RNA.
One of the eight lncRNAs shown (lncRNA_chr2_1430) is negatively correlated with two closely related gene modules (Fig. 4). Furthermore, one female liver gene module (green) is negatively correlated with a total of three lncRNAs. lncRNA_chr8_7423 also showed significant negative correlation with the female hypox-class 2–enriched darkgrey module in male liver (see “Discussion”). Additional details about these eight lncRNAs are provided in Supplemental Table 9C and 9D (44). None of these lncRNAs has annotations in the National Center for Biotechnology Information Reference Sequence database, but four were previously listed in a noncoding RNA database [see Supplemental Table 9C (44)].
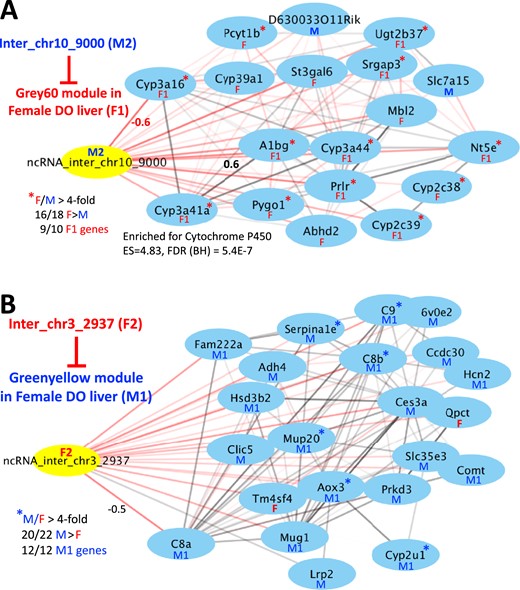
Network maps highlighting negative correlations between sex-specific lncRNAs (yellow) and sex-specific protein-coding gene modules (genes shown in blue) (see Table 2). Shown are network maps drawn using Cytoscape (76), with nodes used to denote genes and edges used to denote correlations between genes. The thickness of the edges indicates the correlation strength between genes. Pairwise Pearson correlation values that are negative are shown as red edges; those that are positive are shown as black edges. (A) lncRNA inter_chr10_9000 is a male class 2 (M2) lncRNA that correlates negatively with the Grey60 gene module in female DO liver. That module is significantly enriched for female hypox class 1 genes (F1) and in female-specific genes showing a female-to-male expression ratio >4 (red asterisks). (B) LncRNA inter_chr3_2937 is a female class 2 (F2) lncRNA that correlates negatively with the greenyellow gene module in female DO liver. That module is significantly enriched for male hypox class 1 genes (M1). Sex-specific genes that did not fall clearly into one of the four hypox-response classes are marked F (female-specific gene) or M (male-specific gene). BH, Benjamini-Hochberg; chr, chromosome; ES, enrichment score; inter, intergenic; ncRNA, noncoding RNA.
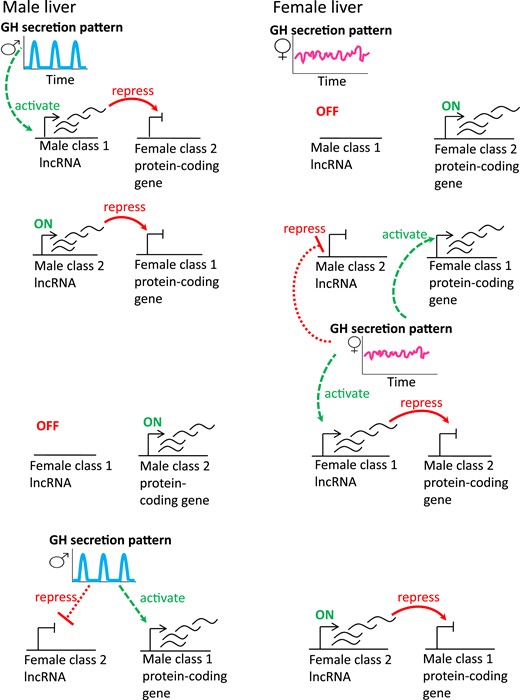
Schematic diagram of the eight proposed scenarios for negative regulation by sex-specific lncRNAs. (Left) Gene regulatory mechanisms in male liver. The male, pulsatile plasma GH pattern activates male class 1 lncRNAs in male liver, which, in turn, are proposed to repress female class 2 protein-coding genes in male liver (first row). Similarly, male class 2 lncRNAs, which are constitutively expressed in male liver, are proposed to repress female class 1 protein-coding genes in male liver (second row). Female class 1 lncRNAs are constitutively off in male liver and therefore cannot repress male class 2 protein-coding genes (third row). Female class 2 lncRNAs, whose expression is repressed by plasma GH pulses in male liver, therefore cannot repress male class 1 protein-coding genes (fourth row). (Right) Gene regulatory mechanisms in female liver. In the absence of GH pulses, male class 1 lncRNAs are constitutively off in female liver and thus cannot repress female class 2 protein-coding genes (top row). Male class 2 lncRNAs are repressed by the female plasma GH pattern and therefore cannot repress female class 1 protein-coding genes (second row). In addition, the persistent plasma GH pattern in female liver activates female class 1 genes, including female class 1 lncRNA genes, which are proposed to repress male class 2 protein-coding genes (third row). Female class 2 lncRNAs are constitutively on in female liver and can therefore repress male class 1 protein-coding genes (fourth row). The inverse regulatory relationship between class 1 sex-specific lncRNAs and class 2 sex-specific protein coding genes shown here is consistent with the effects of hypox on both classes of sex-specific genes. For example, hypox of male mice, which abolishes the GH pulse regulatory circuit diagrammed on the left, downregulates class 1 male lncRNAs and upregulates (i.e., derepresses) female class 2 protein coding genes in male liver. That derepression is proposed to involve the loss of the male class 1 lncRNAs required for female class 2 protein-coding gene repression. Hypox of female mice, which abolishes the persistent GH regulatory circuit diagrammed on the right, downregulates class 1 female lncRNAs and upregulates (derepresses) male class 2 protein coding genes in female liver.
We also identified three female class 2 lncRNAs that showed strong negative correlations with a total of four gene modules enriched in male class 1 protein coding genes in either male liver (inter_chr2_1430) or female liver (inter_chr10_9222, inter_chr3_2937) [Table 2; Fig. 5B; Supplemental Fig. 2 (44)]. Again, these negative correlations of gene expression profiles between inverse hypox classes of the opposite sex are consistent with the models shown in Fig. 6 and would enable an lncRNA to negatively regulate protein-coding genes by any one of several established mechanisms (73–75). The negative correlations seen in female DO liver (inter_chr10_9222, inter_chr3_2937) suggest that expression of the female-specific lncRNA is subject to genetic modifiers in female DO mice, where its high-level expression suppresses expression of the male-biased protein-coding genes, whereas the negative correlation seen in male liver (inter_chr2_1430) indicates that this female-specific lncRNA needs to be kept at a low level to allow for high expression of the male-biased protein-coding genes.
Examples of individual gene modules and their apparent relationship to negatively correlating lncRNAs are shown in Fig. 5 and Supplemental Fig. 2 (44). Four of the lncRNAs shown in Table 2, including three of the four lncRNAs that overlap eRNAs (Table 2), also had strong positive correlations with one or more gene modules enriched for protein coding genes of the same hypox-response class as the sex-specific lncRNA, consistent with their coregulation [Supplemental Table 9C (44)].
Additional correlations between sex-opposite lncRNAs and inverse hypox class–enriched protein-coding gene clusters were found when we lowered the stringency to include correlations at FDR <0.05, particularly in male liver (Fig. 7). Figure 7A summarizes the hypox-class distributions for all sex-specific lncRNAs that showed positive correlations (Fig. 7A1) or negative correlations (Fig. 7A2) at FDR <0.05 with male-liver protein-coding gene modules that are significantly enriched for one of the four hypox-response classes. Figure 7B shows corresponding data for female liver modules. As expected, more male class 1 lncRNAs were positively correlated with gene modules that showed strong enrichment for male class 1 protein-coding genes, as compared with those that did not (Fig. 7A1, dark blue; first five bars vs the other bars), or as compared with the overall distribution for the 139 sex-specific lncRNAs whose expression varied in the male livers [median absolute deviation > 0; Fig. 7A; Supplemental Table 9E (44)]. A similar pattern was seen in female DO livers [Fig. 7B1, dark pink; first two bars vs the others; Fig. 7B vs all; Supplemental Table 9F (44)]. Negative correlations between inverse hypox-response classes were often seen in male liver. Thus, female class 2 lncRNAs were negatively correlated with protein coding gene modules enriched for male class 1 protein-coding genes (Fig. 7A2, light pink; first five bars) when compared with the overall distribution for all sex-specific lncRNAs that varied in male liver (Fig. 7A).
![Distribution of hypox-response gene classes for sex-specific lncRNAs whose expression in DO mouse liver is (left) positively correlated or (right) negatively correlated with protein-coding gene modules that are enriched for one of the four hypox-response classes in (A) male and (B) female DO mouse liver. Shown is the distribution of hypox-response classes for multiexonic, intergenic, sex-specific lncRNAs, whose expression varies (median absolute deviation score > 0) in (A) DO male mouse liver (n = 139 lncRNAs) or in (B) DO female mouse liver (n = 142 lncRNAs). Gene module names (colors) are along the x-axes, as in Fig. 4, and are marked by letters A–D to indicate the hypox-response class enrichment for its protein coding genes, as shown in boxes beneath panels (A1) and (A2). Gene modules are grouped in each panel to show hypox class distributions for the sex-specific lncRNAs that are (A1, B1) positively correlated or (A2, B2) negatively correlated with each module at FDR <0.05. In each subpanel, gene modules are ordered from left to right according to its hypox-response class enrichment (order: ABCD or CDBA), and by decreasing enrichment (low FDR to high FDR) for (A) male class 1 or (B) female class 1 protein-coding genes. The number in parenthesis after each gene module name indicates the total number of lncRNAs whose hypox-class distributions are shown above in each bar. For example, in (A1), the Lightcyan gene module for DO male liver correlated positively with 15 of the 139 sex-specific lncRNAs; 73% (n = 11) of these 15 are male class 1 lncRNAs (dark blue bar), 20% (n = 3) are male class 2 lncRNAs (light blue bar), and 7% (n = 1) is unclassified (gray shading). The first bar at the left, marked “All,” shows the distribution of hypox response classes for all lncRNAs analyzed in each panel. Comparison with the All lncRNA distribution bars, shown on the left side of each panel, reveals the following: Male class 1 lncRNAs (dark blue) preferentially show positive correlation with protein-coding gene modules that are strongly enriched for male class 1 genes [left side of (A1)], whereas female class 2 lncRNAs (light pink) preferentially show negative correlations with protein-coding gene modules strongly enriched for male class 1 genes [left side of (A2)]. (B) Correspondingly, female class 1 lncRNAs (dark pink) preferentially show positive correlations with protein-coding gene modules strongly enriched for female class 1 genes [left side of (B1)]; however, male class 2 lncRNAs (light blue) do not show consistent preferential negative correlations with protein coding gene clusters enriched for female class 1 genes [left side of (B2)].](https://oup.silverchair-cdn.com/oup/backfile/Content_public/Journal/endo/160/5/10.1210_en.2018-00949/1/m_en.2018-00949f7.jpeg?Expires=1750886001&Signature=kbgwQMSC1BJfaG9Yg1RekRL6v1munr-D-pnCM-lvE3cCAyxVIO0TEIfjRw4WuSdakewgngRjziLtqCLTN6YYd1lw4ZTrPmGFmaj~A1TMOJsFVywx2MsGx7Sdh7tq9hkbeG8lDYwQC3lch2gXqPQHAe1oiipAonW9n~8wAdVh5FBnMd43qrpgSQvh3SMUOMq4H1QtBnTkGjTLeSF9gF5hrEfnQo1VmWgVBKayiArZhzaHqmjWgpKDi47l3EPIT2NQhUVnz6UDoTja~9-~3iS58jhBM6CLoy~ey297Z9md9A3nZOg5FnC8oDeF-9bAmMv92hxe15nB0vqg0lz4CHMjbw__&Key-Pair-Id=APKAIE5G5CRDK6RD3PGA)
Distribution of hypox-response gene classes for sex-specific lncRNAs whose expression in DO mouse liver is (left) positively correlated or (right) negatively correlated with protein-coding gene modules that are enriched for one of the four hypox-response classes in (A) male and (B) female DO mouse liver. Shown is the distribution of hypox-response classes for multiexonic, intergenic, sex-specific lncRNAs, whose expression varies (median absolute deviation score > 0) in (A) DO male mouse liver (n = 139 lncRNAs) or in (B) DO female mouse liver (n = 142 lncRNAs). Gene module names (colors) are along the x-axes, as in Fig. 4, and are marked by letters A–D to indicate the hypox-response class enrichment for its protein coding genes, as shown in boxes beneath panels (A1) and (A2). Gene modules are grouped in each panel to show hypox class distributions for the sex-specific lncRNAs that are (A1, B1) positively correlated or (A2, B2) negatively correlated with each module at FDR <0.05. In each subpanel, gene modules are ordered from left to right according to its hypox-response class enrichment (order: ABCD or CDBA), and by decreasing enrichment (low FDR to high FDR) for (A) male class 1 or (B) female class 1 protein-coding genes. The number in parenthesis after each gene module name indicates the total number of lncRNAs whose hypox-class distributions are shown above in each bar. For example, in (A1), the Lightcyan gene module for DO male liver correlated positively with 15 of the 139 sex-specific lncRNAs; 73% (n = 11) of these 15 are male class 1 lncRNAs (dark blue bar), 20% (n = 3) are male class 2 lncRNAs (light blue bar), and 7% (n = 1) is unclassified (gray shading). The first bar at the left, marked “All,” shows the distribution of hypox response classes for all lncRNAs analyzed in each panel. Comparison with the All lncRNA distribution bars, shown on the left side of each panel, reveals the following: Male class 1 lncRNAs (dark blue) preferentially show positive correlation with protein-coding gene modules that are strongly enriched for male class 1 genes [left side of (A1)], whereas female class 2 lncRNAs (light pink) preferentially show negative correlations with protein-coding gene modules strongly enriched for male class 1 genes [left side of (A2)]. (B) Correspondingly, female class 1 lncRNAs (dark pink) preferentially show positive correlations with protein-coding gene modules strongly enriched for female class 1 genes [left side of (B1)]; however, male class 2 lncRNAs (light blue) do not show consistent preferential negative correlations with protein coding gene clusters enriched for female class 1 genes [left side of (B2)].
Negatively correlated male class 1 lncRNAs also showed strong enrichment for protein coding gene modules enriched in female class 2 protein coding genes (Fig. 7A2, dark blue; last two bars). In female liver, the corresponding overall association between negatively correlated male class 1 lncRNAs and protein-coding gene modules enriched for female class 2 genes was less striking (Fig. 7B2, dark blue; second and third bars), and we found no association between negatively correlated male class 2 lncRNAs and protein-coding gene modules enriched for female class 1 genes (Fig. 7B2, light blue; first bar). Rather, in female liver, we found a negative association between female class 2 lncRNAs and male class 1–enriched protein-coding gene modules (Fig. 7B2, light pink; last three bars).
Discussion
Many genes are differentially expressed between male and female liver and contribute to sex differences in disease susceptibility (5–9). These sex-biased genes include many lncRNA genes (22), which are regulated by many of the same GH-responsive liver transcription factors as sex-biased protein-coding genes (22) and thought to contribute to liver sex differences by establishing or maintaining the widespread sex differences in chromatin accessibility and chromatin states that are closely linked to sex differences in liver transcription factor binding and chromatin states (17, 19). Here, we used liver gene expression data collected under 30 different biological conditions to obtain a more comprehensive view of the noncoding transcriptome and identified >15,500 liver-expressed lncRNAs, including many novel genes. These genes include antisense and intragenic lncRNAs, as well as lncRNAs that overlap active enhancers, marked by eRNAs.
We identified 191 lncRNAs that show strong sex-biased expression, as well as regulation during liver development or in response to circadian rhythm. Furthermore, we identified eight sex-specific lncRNAs whose expression across DO mouse liver showed a highly significant negative correlation with protein-coding gene modules enriched for genes of the opposite sex bias and inverse hypox-response class, supporting the proposal that these lncRNAs play an important negative regulatory role in controlling sex-biased gene expression (Fig. 6). Moreover, in some cases, relatively distant gene modules were highly enriched for different subsets of a given hypox-response class (28–30), giving important insight into the complexity of genetic factors that regulate pituitary regulation of sex-biased gene expression and illustrating the utility of constructing gene modules for generating hypotheses about complex biological processes.
Developmental and circadian regulation of lncRNAs expression in male liver
We examined the expression of sex-biased lncRNAs during postnatal male liver development, when major changes relevant to the emergence of liver sex-biased gene expression occur (27). A majority of male-specific lncRNAs were upregulated after 20 days of age, whereas most female-specific lncRNAs showed the opposite pattern [i.e., their expression was repressed during this developmental period, when the mice begin to go through puberty and sex differences in pituitary GH secretion patterns become apparent (26)]. These developmentally regulated, sex-specific lncRNAs thus have the potential to contribute to the temporally associated changes in expression of sex-biased protein-coding genes. We also characterized lncRNAs regulated by circadian rhythms in male liver, which influence the expression of a large number of liver-expressed protein coding genes (39, 40). A subset of these circadian lncRNAs is expressed in a sex-biased manner and could contribute to the regulation sex-specific protein-coding genes with a matching circadian rhythm, which is a feature of many liver sex-biased genes (39).
Complex regulation characterizes the four hypox-response gene classes
We used WGCNA to identify sex-biased protein-coding gene modules on the basis of their expression profiles across a large panel of livers from individual DO male mice and, separately, DO female mice. One-third of the identified gene modules were significantly enriched for either male-specific or female-specific genes. Hierarchical clustering generally segregated the gene modules enriched for male-specific genes into separate branches from the gene modules enriched for female-specific genes (Fig. 4). This indicates that genetic variation within the DO mouse population has a major impact on sex-biased gene expression. This genetic variation may affect sex-biased genes by changes at GH-regulated open chromatin regions (DNase-hypersensitive sites) or by affecting the binding of GH-regulated transcription factors, both of which play a key role in GH regulation of sex differences in the liver (2, 15–17, 19). We also identified many gene modules that were enriched for one of the four hypox-response gene classes, with modules enriched in class 1 genes often found in separate major branches from modules enriched in class 2 genes (Fig. 4A and 4B). This is consistent with the proposal that genes in each hypox-response class are regulated by distinct mechanisms and, therefore, are subject to distinct sets of genetic modifiers in DO mice.
Additional complexity within each hypox-response class is indicated by our finding that multiple gene modules that were well separated by hierarchical clustering were enriched for distinct gene subsets of the same hypox-response class. Examples include a branch with two closely related DO male liver gene modules enriched in female class 2 genes that was well separated from a branch with a third gene module also enriched for female class 2 genes in DO male liver (Fig. 4A, branch A, ovals marked F2); and for DO female liver, gene modules enriched in female class 1 genes were found in separate major branches by hierarchical clustering (Fig. 4B, ovals marked F1).
Only seven of the protein-coding gene clusters discovered in male and female liver showed substantial overlap with each other [Supplemental Fig. 3 (44)]. These seven gene clusters encompass only 223 of the 1033 sex-specific genes considered (numbers based on clusters discovered in male liver), supporting the proposal that a large fraction of the regulation of sex-biased expression involves mechanisms, and affects genetic modifiers, that differ between the sexes. Additional characterization of the sex-specific gene modules identified here may include discovery, for each module, of enrichments for transcription factor binding sites, developmental time points, or circadian gene groups, all of which may help delineate molecular mechanisms that characterize each hypox-response class.
Sex-biased lncRNAs are proposed to negatively regulate select protein-coding gene modules
We identified 73 multiexonic, intergenic sex-specific lncRNAs that show highly significant correlations (FDR <0.001) with at least one sex-specific protein-coding gene module. Eight of these sex-specific lncRNAs showed a highly significant negative correlation (FDR <0.0001) with a protein-coding gene module(s) enriched for genes of the opposite sex bias and inverse hypox-response class, supporting the hypothesis that these lncRNAs negatively regulate genes in their inversely correlated protein-coding gene modules. One example is the female class 2–enriched female liver gene module darkorange, whose expression in DO male liver negatively correlates (FDR = 1.05 E−09) with ncRNA_inter_chr7_6509 (Fig. 2D), a male class 1 lncRNA (Table 2). The strong negative correlations between sex-specific lncRNAs and protein-coding genes of the inverse hypox class was unexpected, because these correlations were observed in DO mice, which have an intact pituitary gland and presumably retain the sex-specific plasma GH patterns seen in other mouse strains. Genetic variants that have accumulated in individual DO mice, an outbred population derived from eight inbred founder-mouse strains (41, 43), are proposed to alter genomic regulatory regions that have a substantial impact on hypox-response phenotypes. Figure 6 presents eight scenarios, broadly divided into two groups, whereby negative expression correlations between inverse hypox classes indicate a negative regulatory role. In one group, high expression of a sex-specific lncRNA is needed to effectively repress protein-coding genes of the opposite sex-bias (e.g., male class 1 lncRNAs repressing genes in a female class 2–enriched gene module in male liver). In the second group, low expression of a sex-specific lncRNA is needed to prevent repression of protein-coding genes of the opposite sex bias (e.g., low expression of male class 1 lncRNAs allows for expression in female liver of genes in a female class 2–enriched gene module).
In conclusion, we used gene expression data obtained for mouse liver under 30 distinct biological conditions to characterize >15,000 noncoding liver RNAs, including many novel lncRNAs, many of which showed strong sex-biased gene expression. Many of these sex-specific lncRNAs are dynamically regulated during postnatal liver development in male mice. Furthermore, we used a mouse population with rich genetic diversity (namely, DO mice) to identify sex-specific, protein-coding gene modules in both male and female liver and discovered that many of these gene modules show an unexpected significant enrichment for genes in one of four hypox-response classes. We identified eight sex-specific lncRNAs that show highly significant negative correlations with protein-coding gene modules enriched for genes of the opposite sex bias and inverse hypox classes, which strongly suggests a negative regulatory role for these lncRNAs. These findings elucidate the sex-biased liver transcriptome and illustrate the utility of gene modules for discovery of broad characteristics of sex-biased gene regulation and for development of hypothesis for regulatory roles sex-biased lncRNAs.
Acknowledgments
The authors thank Christine Nykyforchyn for her contribution to the initial analysis of gene expression correlations in DO mouse liver.
Financial Support: This work was supported in part by Grant DK33765 from the National Institutes of Health, National Institute of Diabetes and Digestive and Kidney Diseases to D.J.W.
Disclosure Summary: The authors have nothing to disclose.
Abbreviations:
- DO
Diversity Outbred
- eRNA
enhancer RNA
- FDR
false discovery rate
- FPKM
fragments per kilobase of exon per million mapped reads
- GEO
Gene Expression Omnibus
- hypox
hypophysectomy
- ICR
Institute of Cancer Research
- lncRNA
long noncoding RNA
- RNA-seq
RNA sequencing
- TAD
topologically associated domain
- WGCNA
weighted gene correlation network analysis
- ZT
Zeitgeber time
