


Abstract
Autophagy is a dynamic process that degrades and recycles cellular organelles and proteins to maintain cell homeostasis. Alterations in autophagy occur in various diseases; however, the role of autophagy in gestational diabetes mellitus (GDM) is unknown. In the present study, we characterized the roles and functions of autophagy in GDM patient samples and extravillous trophoblasts cultured with glucose. We found significantly enhanced autophagy in GDM patients. Moreover, high glucose levels enhanced autophagy and cell apoptosis, reducing proliferation and invasion, and these effects were ameliorated through knockdown of ATG5. Genome-wide 5-hydroxymethylcytosine data analysis further revealed the epigenomic regulatory circuitry underlying the induced autophagy and apoptosis in GDM and preeclampsia. Finally, RNA sequencing was performed to identify gene expression changes and critical signaling pathways after silencing of ATG5. Our study has demonstrated the substantial functions of autophagy in GDM and provides potential therapeutic targets for the treatment of GDM patients.
Gestational diabetes mellitus (GDM) is a metabolic disease characterized by impaired glucose intolerance beginning, or first diagnosed, during pregnancy (1). According to the population studies, GDM can affect 3% to 30% of pregnant women (2). In addition, women with a pregnancy complicated by GDM have a greater incidence of preeclampsia (preE) than nondiabetic women (3, 4). The placenta is a highly specialized organ that allows the fetus to uptake nutrients, exchange gas, and remove waste, and it is necessary for maintenance of pregnancy. Normal human gestation requires trophoblast cells to invade beyond the decidua and remodeling of the maternal vasculature to form low-resistance, high-capacitance vessels. In contrast, shallow implantation of placenta in preE and GDM caused by antiangiogenic factors (5) and the proinflammatory milieu (6) impair trophoblast migration and invasion (7, 8), which leads to an unfavorable environment for embryonic and fetoplacental development.
Autophagy is essential for survival, differentiation, development, and homeostasis in eukaryotes (9). Organelles and proteins marked for degradation are sequestered into autophagosomes, which then fuse with lysosomes to form autophagolysosomes, in which the contents are degraded. Autophagy-related gene 5 (ATG5), an E3 ubiquitin ligase, is necessary for autophagy owing to its role in autophagosome elongation. ATG5 first conjugates with activated ATG12 to form a stable complex. Next, this complex connects with ATG16 (10) for autophagosome formation. Autophagy is upregulated when cells are facing intracellular stressors (e.g., accumulation of misfolded proteins, increased reactive oxygen species, and DNA damage) or certain environmental cues, including starvation, hypoxia, and hormonal stimulation (11). Defective autophagy is associated with many human conditions, including Parkinson’s disease, diabetes, inflammatory bowel disease, aging, and cancer (12–14).
Autophagy is critical for normal placental developmental activities, such as the deep invasion of extravillous trophoblasts (EVTs) into the perivascular region during pregnancy. It also provides protective pregnancy maintenance at different gestational stages (15, 16). Recent studies have demonstrated that women with preE and intrauterine growth restriction have greater placental levels of the autophagy-related protein LC3B than normal pregnant women (13, 17). Many investigations have focused on the effects of autophagy on normal placentation and preE; however, the mechanisms of the autophagic effects on early placental development in GDM remain poorly understood. In the present study, we systematically evaluated the functions of autophagy in GDM patients and a cell model of GDM. We specifically characterized the critical roles of ATG5 in the pathogenesis of GDM using whole transcriptome sequencing. Common and distinct molecular pathogenesis mechanisms between GDM and preE were investigated and compared using epigenomic 5-hydroxymethylcytosine (5hmC) analysis. Our results have demonstrated that aberrant activation of autophagy is significantly related to GDM and preE, and these findings might provide potential targets for future therapies.
Materials and Methods
Clinical sample collection
Placental tissue was collected in accordance with the guidelines of the ethics committees of the Central Hospital of Wuhan (Hubei, China) in 2014. We collected 9 fresh placentas from patients with GDM and 13 from women experiencing a normal pregnancy (NP), after they had provided written informed consent. GDM was defined as one of the three following criteria: maternal fasting blood glucose level ≥5.1 mM, 1-hour oral glucose tolerance test level of ≥10.0 mM, or 2-hour oral glucose tolerance test level of ≥8.5 mM. Patients with chronic medical disorders, such as cardiovascular disease, chronic renal disease, or chronic hypertension, were excluded. The patient characteristics, including body mass index at the end of pregnancy, are summarized in Table 1.
Clinical Presentations of Both Groups
| Characteristic | NP | GDM |
|---|---|---|
| Subjects, n | 13 | 9 |
| Maternal age, y | 30.40 ± 0.7024 | 33.20 ± 1.489 |
| Gestational age at delivery, wk | 38.30 ± 1.77 | 39.40 ± 0.70 |
| BMI, kg/m2 | 24.93 ± 1.05 | 29.99 ± 3.60a |
| FBG (mmol/L) | 4.51 ± 0.28 | 5.56 ± 1.02b |
| 1-h OGTT, mmol/L | NA | 11.34 ± 1.52 |
| 2-h OGTT, mmol/L | NA | 9.40 ± 1.24 |
| Neonatal birth weight, g | 3425.00 ± 526.78 | 3788.89 ± 733.48b |
| SBP, mm Hg | 119.40 ± 8.07 | 124.20 ± 15.68 |
| DBP, mm Hg | 80.50 ± 11.78 | 84.30 ± 6.60 |
Data presented as mean ± standard error of mean.
Abbreviations: BMI, body mass index; DBP, diastolic blood pressure; FBG, fasting blood glucose; NA, not applicable; OGTT, oral glucose tolerance test; SBP, systolic blood pressure.
P < 0.001 vs NP.
P < 0.05 vs NP.
Cell culture and transfection
HTR8/SVneo cells, an immortalized first-trimester invasive EVT cell line, were purchased from the ATCC. The cells were cultured in RPMI 1640 medium supplemented with 10% fetal bovine serum. For glucose treatment, HTR8/SVneo cells were incubated for 24 hours in glucose-free RPMI 1640 medium with a final concentration of 5 and 30 mM glucose for EGFP-LC3B plasmid and/or small interfering RNA (siRNA) transfection. After these treatments, the cells were collected for analysis. The sequences of all the siRNAs are listed in Supplemental Table 1.
Transmission electron microscopy
Placental tissues (1 mm3/piece) were fixed with 4% glutaraldehyde, rinsed with 0.1 mol/L phosphate-buffered saline (PBS) and postfixed with 1% osmium tetroxide. Samples were then dehydrated in ethanol, saturated in epoxy resin 618, embedded in Epok 812, and incubated overnight. Satisfactory fields were chosen using an ordinary light microscope. After the pellets were sectioned (50 to 60 nm) and stained with uranyl acetate for 10 minutes and citrate for 5 minutes, the fields were examined using a Hitachi-7700 transmission electron microscopy (Hitachi Limited, Tokyo, Japan).
RNA extraction, quantitative reverse transcription polymerase chain reaction, and Western blot analysis
Total RNA from placental tissues and siRNA-transfected cells was isolated using TRIzol Reagent (Invitrogen; Thermo Fisher Scientific Life Sciences, Waltham, MA). Quantitative polymerase chain reaction and Western blot analyses were performed as described previously (18, 19). The sequences of the primers are shown in Supplemental Table 1. Western blotting was performed using antibodies to MAP1LC3B, p62, ATG5, or glyceraldehyde 3-phosphate dehydrogenase purchased from Cell Signaling Technology (Danvers, MA), Abcam (Cambridge, UK), and Proteintech Group (Table 2). All the experiments were repeated three times.
Table of Antibodies
| Protein Target | Name | Manufacturer, Catalog No. | Species Raised in | Dilution | RRID |
|---|---|---|---|---|---|
| MAP1LC3B | LC3A/B | Cell Signaling Technology, no. 4108 | Rabbit, polyclonal | 1:1000 | AB_2137703 |
| p62 | P62/SQSTM1 | Proteintech, no. 18420-1-AP | Rabbit, polyclonal | 1:5000 | AB_10694431 |
| ATG5 | APG5L/ATG5 | Abcam, no. ab108327 | Rabbit, monoclonal | 1:5000 | AB_2650499 |
| GAPDH | GAPDH | Proteintech, no. 10494-1-AP | Rabbit, polyclonal | 1:5000 | AB_2263076 |
Abbreviations: GAPDH, glyceraldehyde 3-phosphate dehydrogenase; RRID, Research Resource Identifier.
Cellular proliferation assay
Cell proliferation was assessed using a cell counting kit 8. In brief, the treated cells were seeded into a 96-well plate at an initial density of 5000 cells/well. After 24 hours, 10 µL of the cell counting kit 8 solution was added to each well and incubated for 2 hours. The absorbance was read at 450 nm. Each group consisted of three wells and was repeated three times.
Transwell chamber invasion assay
Matrigel invasion assay was performed in a 24-well plate fitted with inserts containing a polycarbonate membrane (pore size, 8 μm; Corning Life Sciences, Corning, NY), and the inserts were precoated with 50 μL of Matrigel (diluted to 1 mg/mL; Corning). A total of 1 × 10⁵ cells suspended in 300 μL of serum-free RPMI 1640 medium were added to the upper chamber of the membrane, and 500 μL of RPMI 1640 medium with 10% fetal bovine serum was added to the lower chamber of the Transwell plate. After incubation for 48 hours, the cells on the upper filter surface were completely removed by gentle scraping with a cotton swab, and the invaded cells attached to the bottom side of the filter were washed twice with PBS and stained with crystal violet for 10 minutes. Cell invasion ability was determined by counting the number of stained cells in five randomly selected nonoverlapping fields on the membranes. Each group consisted of three wells and was repeated three times.
Apoptosis assay
The cells were centrifuged at 1000g for 10 minutes and washed twice with sterile PBS. Next, the cells were resuspended at a density of 5 × 10⁵ cells/mL and incubated with Annexin V-FITC (fluorescein isothiocyanate) binding buffer (BD Pharmingen; BD Biosciences, San Jose, CA). Annexin V-FITC/propidium iodide (PI; BD Pharmingen) was used to stain cells in the dark. Finally, apoptotic cells were assessed by gating PI and Annexin V-positive cells on a fluorescence-activated cell sorting flow cytometer (BD Pharmingen). A total of ≥10,000 events were acquired on Diva software, version 6.1, using gates that were previously established for HTR8/SVneo cells. Double-negative cells were considered intact, and double-positive cells were considered late apoptotic/necrotic cells. Annexin+/PI− cells were presumed to be in early apoptosis, and Annexin−/PI+ cells were considered necrotic. Each group consisted of three wells and was repeated three times.
Quantitative analysis of GFP-LC3 puncta
HTR8/SVneo cells were transiently transfected with EGFP-LC3B plasmid using Lipofectamine 2000 (Invitrogen; Thermo Fisher Scientific Life Sciences). For quantitative analysis of MAP1LC3B (LC3), the cells were pretreated with the lysosomal protease inhibitors E64d (10 ng/mL) and pepstatinA (10 ng/mL) for 2 hours. To distinguish cytoplasmic LC3 puncta, the cells were fixed with 4% paraformaldehyde-PBS and stained with 0.1 µg/mL 4′,6-diamidino-2-phenylindole (Thermo Fisher Scientific Life Sciences) to show the nuclei and then examined by confocal microscopy (Leica-LCS-SP8-STED, Leica Microsystems, Wetzlar, Germany). The percentage of cells with >10 or >15 LC3 dots/cell was determined. The incidence of autophagy was estimated by quantifying the number of LC3 puncta within cells by manually counting five independent visual fields. Each group consisted of three wells and was repeated three times.
5hmC data analysis
Genome-wide 5hmC sequencing data for GDM, preE, and normal umbilical vessels were obtained from GSE75941. Raw FASTQ format files were mapped to human hg19 reference genome using Bowtie software (Johns Hopkins University, Baltimore, MD) (20). Duplicate reads were removed using picard tools. Enriched regions were detected using the “findPeaks” routine in HOMER (hypergeometric optimization of motif enrichment) (21) with the “histone” mode and default parameter values. Motif analysis were performed using the “findMotifsGenome” routines in HOMER. Overlapped or unique peaks were identified using BEDTools (22). Examples of 5hmC data were visualized using an integrative genomics viewer browser.
Messenger RNA sequencing and data processing
Total RNA from siRNA and glucose (30 mM)-treated HTR8/SVneo cells were extracted using an RNeasy Mini Kit (Qiagen, Hilden, Germany). RNA-sequencing (RNA-seq) libraries were prepared for paired-end Illumina HiSEquation 2000 (Illumina, San Diego, CA) using a 2 × 150-bp paired-end configuration. All raw RNA-seq data were mapped to hg19 using TopHat (Johns Hopkins University) (23) with reference gene annotation GENCODE, release 19. edgeR was used for all differential expression analysis from the raw counts. The read counts were converted into RPKM (reads per kilobase of exon model per million mapped reads). Expressions of each differentially expressed (DE) gene were clustered and visualized as heatmaps in a multiple experiment viewer (MeV, version 4.9.0; J. Craig Venter Institute, La Jolla, CA).
Statistical analysis
Data are expressed as the mean ± standard error of the mean. Statistically significant differences between groups were determined using two-tailed one-way analysis of variance, followed by a Student-Newman-Keuls test or Student t test. Statistical analyses were performed using GraphPad Prism, version 6, software (GraphPad Software, San Diego, CA). P < 0.05 was considered statistically significant.
Results
Hyperglycemia promotes autophagy in placenta of GDM patients
The clinical characteristics of 9 women with GDM and 13 with a NP are summarized in Table 1. Women with GDM had a higher body mass index (P = 0.0005) and neonatal birth weight (P = 0.03). We analyzed the effect of hyperglycemia in the placentas from the two groups. Transmission electron microscopy analyses revealed that placentas from the diabetic patients had a significantly collapsed structure and reduced number of microvilli compared with normal placentas [Fig. 1(a) and 1(b)], indicating potentially damaged transplacental transport and exchange. In the cytoplasm of trophoblasts, many vacuoles were interspersed within the syncytiotrophoblast (ST) of GDM patients [Fig. 1(b)]. Autophagy-associated structures (i.e., autophagosomes, autolysosome) and swollen mitochondria were present in the ST of the GDM group but not in the NP group [Fig. 1(c–f)]. For example, we observed three autophagic vacuoles with a double membrane in the ST of the GDM group, including an autophagolysosome containing the membrane remnants and partially degraded mitochondria, and two autophagolysosomes, one containing degraded subcellular organelles and membrane remnants and one containing a mitochondrion with obvious cristae [Fig. 1(d)]. Additional examples are shown in Fig. 1(e) and 1(f) and Supplemental Fig. 1.
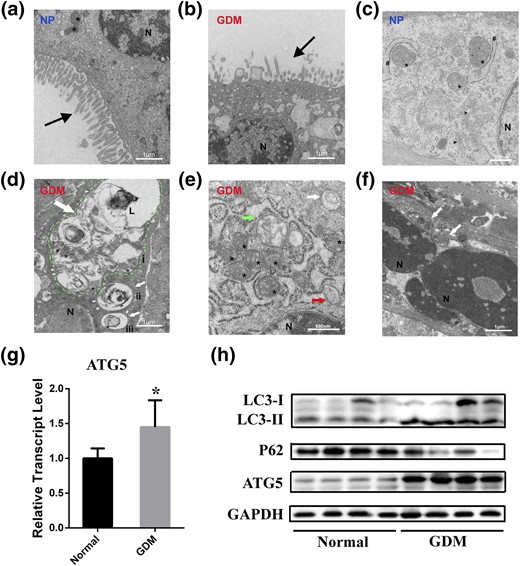
Placenta ultrastructure and autophagy expression in NP and patients with GDM. (a) Continuous, uniform microvilli and oval mitochondria in NP. (b) Collapsed and decreased apical microvilli (black arrow) and multiple vacuoles in GDM. (c) Integrated and legible organelles such as mitochondria (asterisks), endoplasmic reticulum (number signs), and dictyosomes (or golgiosomes; black arrowheads) were present, but the autophagosome was not seen in NP. (d) Autophagic vacuoles (white arrows) with double membrane (white arrowheads) in GDM. The inner membrane remnants (circumflex) of autophagosome and partially degraded mitochondria were seen in the autophagolysosome (green dotted line). Also, degraded subcellular organelles (i) and membrane remnants (ii) and a mitochondrion with obvious cristae (iii) were found in these autophagolysosomes. (e and f) Autophagic vacuoles in GDM and a cup-shaped phagophore (red arrow) and swollen mitochondria (green arrow) were detected. (g) Relative expression of ATG5 measured using quantitative polymerase chain reaction in the placenta of NP and GDM. *P < 0.05. (h) Representative Western blotting bands of autophagy markers LC3-I, LC3-II, p62, ATG5, and glyceraldehyde 3-phosphate dehydrogenase (GAPDH). (a, b, and d) Scale bars = 1 μm. (c, e, and f) Scale bars = 500 nm. L, lysosome; N, nucleus.
Because ATG5 is important for autophagosome formation and embryonic cavitation development in mice (24) and has a critical role in the regulation of insulin resistance (25), we determined its expression between NP and GDM patients. Both the messenger RNA (mRNA) and the protein of ATG5 were upregulated in GDM patients [Fig. 1(g) and 1(h)]. In addition, we examined the protein expression of LC3-II, a marker of autophagy activation that is converted from LC3-I, and p62 to determine the levels of autophagy in the two groups. LC3-II was significantly increased, accompanied by a decrease of p62, in the placentas from the GDM patients compared with the NP group, indicating the enhancement of autophagy and a complete autophagic process [Fig. 1(h)].
High glucose enhances autophagy in HTR8/SVneo cells
To investigate the effects of high glucose (HG) concentrations on GDM, we built an in vitro cell model. We incubated HTR8/SVneo cells for 24 hours in glucose-free RPMI 1640 medium, with a final concentration of 30 mM glucose, because previous studies treated HTR8/SVneo, primary trophoblast cells, and conditionally immortalized murine podocytes with 25 to 52.5 mM glucose to simulate the hyperglycemic conditions of diabetes mellitus (8, 26–28). After treatment with HG (30 mM), cells exhibited an abnormal morphology compared with mannitol (osmotic pressure control, 30 mM) and physiological blood glucose level (normal, 5 mM) groups [Fig. 2(a)]. Because previous studies reported that HG could induce autophagy in podocytes (28, 29), we determined whether the change in cell morphology was also related to autophagy by examining the level of autophagy in cells under HG conditions. HG treatment significantly increased the mRNA (P < 0.01) and protein expression of ATG5 [Fig. 2(b)]. Additionally, the expression of LC3-II was increased, but that of p62 was decreased compared with controls after HG treatment for 24 hours [Fig. 2(c)]. Moreover, p62 accumulated when cells were blocked by pretreatment with lysosomal protease inhibitors for 2 hours (Supplemental Fig. 2). Furthermore, the presence of autophagosomes was detected by counting LC3-II puncta formation, with a significantly increased number of LC3-II puncta found compared with the controls [P < 0.0001; Fig. 2(d)]. Collectively, these results suggest that autophagy is enhanced by excess glucose.
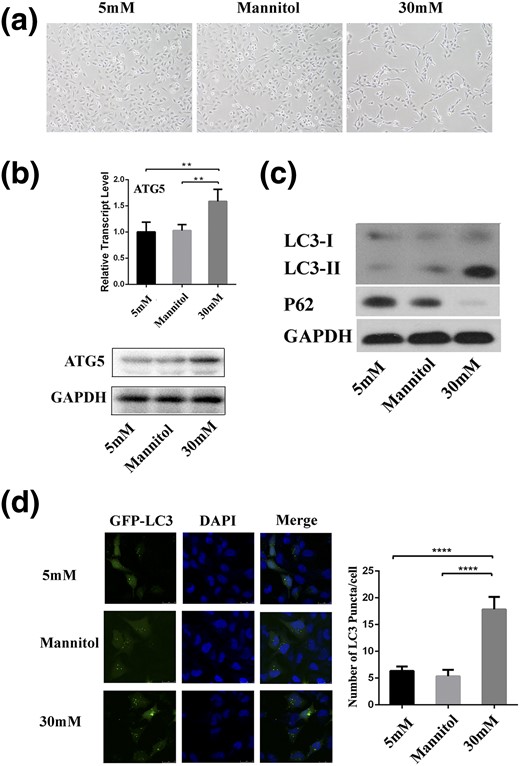
HG affects autophagy in HTR8/SVneo cells. (a) Micrograph of cells treated with mannitol and glucose for 24 hours (magnification ×100). (b) Relative expression of ATG5 measured using quantitative polymerase chain reaction and Western blotting in cells treated with HG. **P < 0.01. (c) Western blotting analysis demonstrated the expression of LC3 and p62 in cells treated with HG. (d) Representative images taken by confocal microscopy showed the fluorescent densities of LC3 in cells treated with glucose or mannitol in the presence of lysosomal protease inhibitors. Numbers of GFP-LC3 puncta per cell were counted. ****P < 0.0001. Scale bar = 20 μm. DAPI, 4′,6-diamidino-2-phenylindole; GAPDH, glyceraldehyde 3-phosphate dehydrogenase.
HG modulates cell apoptosis, proliferation, and invasion
In human placentas, normal apoptosis is associated with placental development. We next evaluated the apoptosis and proliferation rates to understand the mechanisms of cellular functional alterations under HG exposure. After a 24-hour incubation in HG, we observed a substantial increase of 1.6-fold (P = 0.0072) in cell apoptosis rates compared with normal on flow cytometry analysis [Fig. 3(a)]. Moreover, HG treatment significantly decreased the cell proliferation rates by 50% (P = 0.0012) compared with the normal group [Fig. 3(b)]. Regarding cell invasion, HTR-8/SVneo trophoblasts incubated in HG for 24 hours exhibited a 52% decrease (P < 0.0001) in their in vitro invasive capacity compared with the normal group [Fig. 3(c)].
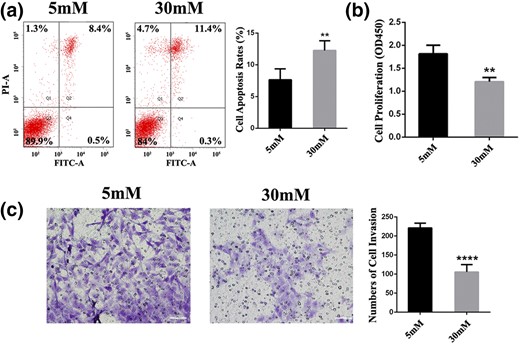
Glucose affects cellular behavior in HTR8/SVneo cells. (a) Apoptosis was analyzed by flow cytometry after 24 hours of treatment at doses of 5 or 30 mM glucose. (b) Cell counting kit 8 assays were conducted to quantify cell viability for EVTs after treatment with glucose for 24 hours. **P < 0.01. (c) Transwell plates of cells stimulated with glucose for 24 hours. Representative pictures showed that invaded cells stained violet. ****P < 0.0001. Scale bar = 60 μm. FITC-A, fluorescein isothiocyanate assay; OD, optical density; PI-A, propidium iodide assay.
Epigenomic regulation of autophagy in GDM and PreE
To explore the regulatory circuitry underlying the induced autophagy and apoptosis, we compared the 5hmC dynamics, an epigenetic mark involved in normal development, tumor development, and the development of various diseases (30–32), among the umbilical cords derived from normal, GDM, and preE patients (33). We obtained 198,401, 229,582, and 207,702 5hmC peaks for the normal, GDM, and preE, respectively, suggesting the modifications of 5hmC between the normal and each of the diseases were comparable.
We clustered the 5hmC profiles to obtain a global view of occupancy states across the various conditions [Fig. 4(a)]. We identified 163,660 peaks shared between the normal and disease cells (cluster I). Moreover, 27,333 peaks were common to GDM and preE (cluster II), suggesting pathogenic roles for these epigenetic changes. Also, 13,664 peaks (6.8%) were unique to normal tissue (cluster III), 38,903 peaks (16.9%) were unique to GDM (cluster IV), and 22,228 peak (10.7%) were unique to preE (cluster V), accounting for the total number of peaks detected in the cognate cells. To evaluate the functional significance of the disease-specific 5hmC signatures, we performed a functional analysis of the enriched peaks for GDM and preE. We observed that a fraction of the genes associated with 5hmC in these two diseases was enriched for common signaling related to autophagy, apoptosis, and insulin response [Fig. 4(b)], confirming our previous observations that autophagy and apoptosis are induced by glucose both in vivo and in vitro. The ATG5 promoter was marked with 5hmC in GDM and preE but not in normal tissue [Fig. 4(c)], demonstrating active DNA demethylation processes of this gene in the diseases. Moreover, several pathways were differentially enriched for the two diseases. For example, type 2 diabetes and embryonic development pathways were enriched in GDM, but JAK-STAT, ubiquitination, and cytokinesis pathways were enriched in preE [Fig. 4(b)], suggesting unique biological features for each disease.
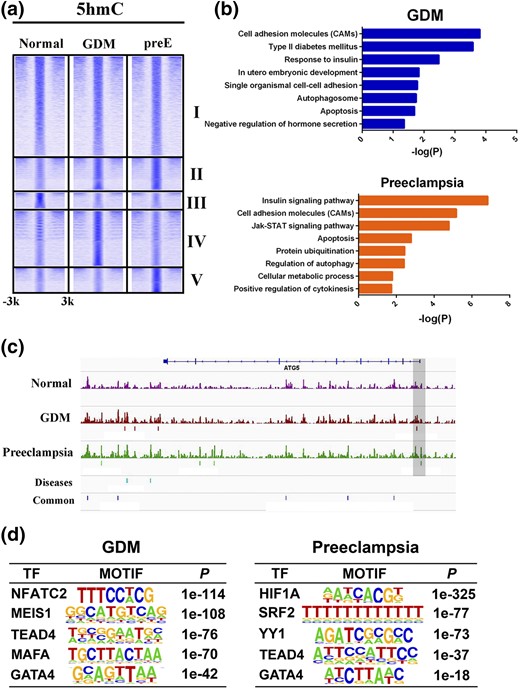
Genome-wide 5hmC profiles in GDM, preE, and normal tissue. (a) Heatmaps showing five clusters of 5hmC-binding patterns within 3 kb surrounding the 5hmC peaks. (b) Biological processes and signaling pathway enrichment analysis for genes targeted by 5hmC in GDM and preE. (c) Examples of 5hmC-enrichment patterns in ATG5 gene loci across GDM, preE, and normal tissue. (d) Top enriched transcription factor (TF) motifs identified by de novo motif discovery at 5hmC loci in GDM and preE.
We next performed de novo motif analysis of the disease-specific regions to identify enriched transcription factor-binding events. TEAD4 and GATA4 were highly enriched in both diseases. In contrast, NFATC2, MESI1, and MAFA were unique to GDM, and HIF1A, SRF2, and YY1 were unique to preE [Fig. 4(d)]. Collectively, these findings demonstrate that epigenetic regulatory mechanisms are implicated in the pathogenesis of the diseases, with induced autophagy and apoptosis and other specific features.
Knockdown of ATG5 ameliorates the effect of apoptosis and invasion caused by HG
To elucidate the roles of autophagy in response to HG, we altered autophagy activities by knocking down ATG5 for further cellular functional assays. After successfully silencing ATG5 [Fig. 5(a)], autophagy activity was estimated by measuring LC3-II and p62 protein levels. ATG5 silencing resulted in attenuation of LC3-II and accumulation of p62 in both normal and HG groups [Fig. 5(b)]. These results indicate that inactivation of ATG5 effectively blocks the autophagy pathway.
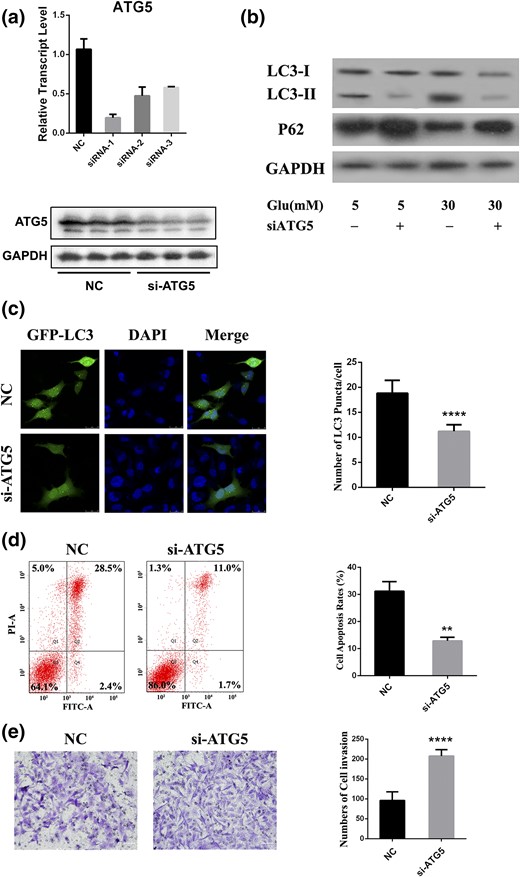
Silencing of ATG5 affects cellular behavior. (a) Relative expression of ATG5 in HTR8/SVneo cells transfected with siRNA. (b) HTR8/SVneo cells were treated with glucose for 24 hours, followed by siRNA transfection. LC3 and p62 levels were determined by Western blot. (c) Cells were cotransfected with GFP-LC3 and siRNA and then with HG for 24 hours, followed by pretreated lysosomal protease inhibitors. Cells were imaged under a confocal microscope. Scale bar = 20 μm. (d) Flow cytometry was used to measure cell apoptosis after transfected cells were incubated with HG for 24 hours. (e) Transwell slides of cells transfected with siRNA and then stimulated with glucose for 24 hours. Representative views show invaded cells stained as violet. Scale bar = 60 μm. DAPI, 4′,6-diamidino-2-phenylindole; FITC-A, fluorescein isothiocyanate assay; GAPDH, glyceraldehyde 3-phosphate dehydrogenase; Glu, glucose; NC, negative control; PI-A, propidium iodide assay; siATG5, short interfering ATG5. **P < 0.01; ****P < 0.0001.
We treated GFP-LC3 plasmid and siRNA transiently cotransfected HTR8/SVneo cells with HG for 24 hours to evaluate autophagosome formation using confocal microscopy. Remarkable formation of autophagosome signals, indicated by green fluorescent LC3 puncta, was observed in cells with control siRNA, with LC3 distributed predominantly and diffusely throughout the cytoplasm when ATG5 was inhibited [Fig. 5(c)]. The effect of ATG5 knockdown on cell behavior was measured. Blockage of autophagy attenuated the enhanced cell apoptosis rates induced by HG by 2.4-fold [P = 0.001; Fig. 5(d)] compared with cells treated with control siRNA. In addition, the invasion ability of ATG5-silenced cells exhibited a 54% increase (P < 0.0001) compared with cells transfected with control siRNA [Fig. 5(e)]. We also performed cell proliferation assays with ATG5-inhibited cells treated with HG; however, the decreased proliferation was not reversed. These results illustrate that autophagy in EVT cells is key to cell apoptosis and invasion but not to proliferation.
Identification of gene expression changes after silencing of ATG5
After observing that the knockdown of ATG5 affected cell apoptosis and invasion, we determined the global gene expression alterations after perturbation of ATG5 in HG-treated HTR8/SVneo cells by RNA-seq. After differential expression analysis, 2299 genes were identified that underwent a substantial change during ATG5 knockdown [Fig. 6(a)]. Among the 2299 genes DE between the two groups, 1258 were upregulated and 1041 were downregulated. In addition to protein-coding genes, long noncoding RNAs (lncRNAs) were included in the analysis. Of the 1258 upregulated genes, 573 lncRNAs (45.5%) were induced by silencing of ATG5. For the downregulated set, 403 lncRNAs (38.7%) were repressed [Fig. 6(b)]. For example, ENSG00000269926.1 and NSFP1 were the most upregulated lncRNAs, and ENSG00000248698.1 and ENSG00000273156.1 were the most downregulated. These lncRNAs, together with the DE mRNAs, might be involved in ATG5-mediated transcriptional programs.
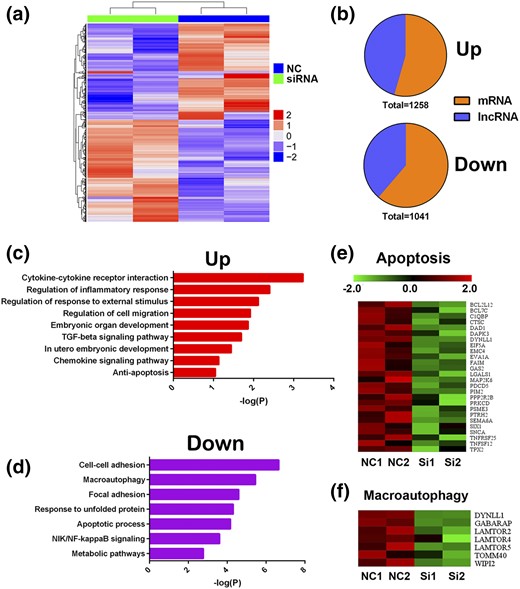
Gene expressions changes in ATG5-silenced HTR8/SVneo cells. (a) Hierarchical clustering of all DE genes in ATG5-silenced HTR8/SVneo cells. (b) Pie charts indicating the abundance of lncRNAs and protein-coding genes within DE genes. (c and d) Biological processes and signaling pathway enrichment analysis for DE genes. (e and f) Heatmaps showing repressed apoptosis and autophagy pathway–related gene expression in ATG5-silenced HTR8/SVneo cells. NC, negative control; NF-kappaB, nuclear factor kappa B; NIK, NF-kappaB–inducing kinase; TGF, transforming growth factor.
For further investigation, pathway analyses were performed on the DE genes. The activated pathways included cytokine–cytokine receptor interaction, regulation of cell migration, and antiapoptosis. We identified several suppressed gene signatures enriched for pathways, including cell–cell adhesion, macroautophagy, and apoptotic processes [Fig. 6(c) and (d)]. A total of 26 apoptosis-associated genes were downregulated [Fig. 6(e)]. Heatmaps also showed that a seven-gene set associated with macroautophagy was inactivated [Fig. 6(f)]. Altogether, these findings confirmed our previous observations that knockdown of ATG5 promotes invasion and attenuated apoptosis in HTR8/SVneo cells treated with HG.
Discussion
Although several studies have shown that autophagy is necessary during the development of the placenta (34), the levels and functions of autophagy in GDM remain unknown. To the best of our knowledge, we present the first report on aberrantly enhanced autophagy levels in patients with GDM and in an EVT cell line exposed to excess glucose, which contributed to abnormal cell apoptosis and invasion. Thus, our results provide evidence of the pathogenesis of GDM.
Although GDM is a risk factor for preE and both share many risk factors, including advanced maternal age, multifetal pregnancies, and prepregnancy obesity (35, 36), it is unclear whether these two conditions share a common pathophysiological pathway. Previous studies have reported elevated apoptosis and autophagy in the pathogenesis of preE (13, 37, 38). A recent study also found that oxidative stress induced by glucose oxidase resulted in preE and exhibited autophagy-dependent reduced invasion of EVTs (39). We therefore hypothesized that autophagy might be a common pathological mechanism to explain the strong association between GDM and preE. To demonstrate this, we carefully compared cell behaviors under HG and normal conditions. As expected, consistent with the previous findings for preE, our study showed that treatment of EVTs with HG also led to a high level of autophagy and apoptosis and insufficient cell invasion.
Our study linked epigenetic control of autophagy in GDM and preE through 5hmC modification analysis, in which the common and distinct molecular pathogenesis mechanisms of the two diseases were reflected by the 5hmC distribution pattern and signaling pathways and transcription factor binding events. 5hmC is enriched in gene bodies, promoters, and cell type-specific enhancers, and it correlates positively with gene transcription (30). Thus, enrichment of 5hmC at the ATG5 promoter and other genes involved in several pathways, including autophagy, demonstrates that these genes were abnormally activated and might be potential therapeutic targets for specific inhibitors. We also observed several sequence-specific motifs recognized by transcription factors. For example, NFATC2 is identified as the most enriched motif in GDM. NFATC2 has been reported to be activated in hyperinsulinemia (40), and inhibition of NFATC2 ameliorates high fructose-induced insulin resistance and nephropathy (41). We thus suggest a role for NFATC2 in patients with GDM, and further studies could be conducted to determine its therapeutic use. Hypoxia-inducible factor-1α (HIF-1α) seems to be the top ranked motif in preE, with 5hmC-marked genes. The HIF-1α expression levels in human placenta are high at 7 to 9 weeks of gestation when oxygen tension is low; however, the placenta is exposed to severe hypoxia during early-onset human preE (42, 43). A recent study demonstrated that overexpression of autophagy induced by HIF-1α supports trophoblast invasion (44). Therefore, our findings provide insight into the mechanisms by which aberrant autophagy activities and transcriptional programs and signaling contribute to GDM and preE. Nevertheless, we could not exclude the possibility of tissue- and cell type–specific features between the placenta and umbilical cord. It has been reported that GDM and preE could cause placental morphological changes and alterations in the blood flow patterns in the umbilical vessels (33, 45, 46). Thus, whether 5hmC regulates autophagy in the placenta or autophagy stimulation occurs in the umbilical cord in GDM or preE requires further studies.
Both in vivo experiments and gene profiling analysis performed during inhibition of autophagy (by silencing ATG5) in cells exposed to HG revealed a decreased cellular apoptosis ratio and increased cell invasion ability. Therefore, we hypothesized that autophagy modulates cell apoptosis and invasion. Previous studies have shown the roles of autophagy in cell death. For instance, activation of autophagy by inhibition of histone deacetylase 1 triggers cell death (47). In addition, overexpression of the autophagy protein Beclin 1 in mammalian cells (48) and Atg1 in Drosophila resulted in uncontrolled upregulation of autophagy, which can lead to cell death, possibly through activation of apoptosis (49). Recently, it was also reported that long-term autophagy activity promoted embryonic apoptosis (50). In contrast, autophagy has been reported to be associated with trophoblast invasion in preE (39). We propose that adverse pregnancy outcomes, such as stillbirth, preterm delivery, low birth weight, and small-for-gestational-age in women with GDM (51–54), are due to shallow placental implantation, which might result from excessive apoptosis and insufficient invasion capability caused by abnormally elevated autophagy.
In conclusion, our study has demonstrated the important functions of autophagy in GDM patients and an EVT cell line exposed to excess glucose. We specifically characterized the critical roles of ATG5 in the pathogenesis of GDM and preE by RNA-seq and 5hmC analysis. Altered autophagy activities resulted in modulated cellular behavior, such as cell apoptosis and invasion, contributing to the adverse pregnancy outcomes of GDM. Altogether, our results extend the knowledge of the pathogenic mechanisms of GDM and provide potential therapeutic targets for patients.
Abbreviations:
- DE
differentially expressed
- EVT
extravillous trophoblast
- GDM
gestational diabetes mellitus
- 5hmC
5-hydroxymethylcytosine
- HG
high glucose
- HIF-1α
hypoxia-inducible factor-1α
- lncRNA
long noncoding RNA
- mRNA
messenger RNA
- NP
normal pregnancy
- PBS
phosphate-buffered saline
- PI
propidium iodide
- preE
preeclampsia
- RNA-seq
RNA sequencing
- siRNA
small interfering RNA
- ST
syncytiotrophoblast.
Acknowledgments
We thank all the patients and healthy volunteers who agreed to participate in the present study and all those who helped us successfully complete the research.
This work was financially supported by Hubei Provincial Population and Family Planning Commission Grant WJ2015MA011 (to L.W.), National Natural Science Foundation of China Grant 81671534 (to L.W.), and Fundamental Research Funds for the Central Universities of China Grant 2042017kf0032 (to H.H.). The funders had no role in the study design, data collection and analysis, decision to publish, or preparation of the manuscript.
Author contributions: L.J., H.H., and L.W. conceived and designed the experiments; L.J., H.H., Y.X., G.X., and Z.C. contributed to acquisition of the data; L.J., H.H., and C.W. analyzed and interpreted the data; L.J., H.H., Y.X., and R.L. contributed to writing the article; and all authors revised the manuscript critically for important intellectual content and approved the final version. L.J., H.H., and L.W. are responsible for the integrity of the work as a whole, and H.H. and L.W. are the guarantors of this work and, as such, had full access to all the data in the study and take responsibility for the integrity of the data and the accuracy of the data analysis.
Disclosure Summary: The authors have nothing to disclose.
References
Cawyer CR, Horvat D, Leonard D, Allen SR, Jones RO, Zawieja DC, Kuehl TJ, Uddin MN.
Author notes
Address all correspondence and requests for reprints to: Lin Wang, MD, School of Basic Medical Sciences, Wuhan University, No. 185, Donghu Road, Wuhan 430071, China. E-mail: [email protected]; or Hanyang Hu, PhD, School of Basic Medical Sciences, Wuhan University, No. 185, Donghu Road, Wuhan 430071, China. E-mail: [email protected].
