


Abstract
Insulin-like growth factor 1 (IGF1) is a multifunctional peptide that is involved in a wide range of physiological and pathophysiological processes in many animal species, ranging from somatic growth in children to metabolism and tissue regeneration and repair in adults. The IGF1 gene is under multifactorial regulation in the few species in which it has been studied, with major control being exerted by growth hormone through a gene expression pathway involving inducible binding of the STAT5b transcription factor to dispersed enhancer elements. In this study, using resources available in public genomic databases, genes encoding IGF1 have been analyzed in a cohort of six nonhuman primate species representing >60 million years of evolutionary diversification from a common ancestor: chimpanzee, gorilla, macaque, olive baboon, marmoset, and mouse lemur. The IGF1 gene has been well conserved among these primates. Similar to human IGF1, each gene appears to be composed of six exons and five introns, and contains recognizable tandem promoters, each with a unique leader exon. Exon and intron lengths are very similar, and DNA sequence conservation is high, not only in orthologous exons and promoter regions, but also in putative growth hormone–activated STAT5b-binding enhancers that are found in analogous locations in IGF1 intron 3 and in 5′ distal intergenic DNA. Taken together, the high level of organizational and nucleotide sequence similarity in the IGF1 gene and locus among these seven species supports the contention that common regulatory paradigms had existed prior to the onset of primate speciation >85 million years ago.
Insulin-like growth factor 1 (IGF1) is a conserved 70-residue, single-chain secreted protein that plays a critical role in many physiological and pathophysiological processes in humans and other mammals (1–3). Along with IGF2 and insulin, IGF1 comprises a gene family that is present in many eukaryotes (4–7). Under regulation by growth hormone (GH), IGF1 is essential for normal prenatal and postnatal growth in human children and in juveniles of other mammalian species and many vertebrates (1, 2, 8–10), and it also is involved in control of intermediary metabolism, tissue regeneration, and disease pathogenesis in adults (3, 11–13).
IGF1 genes appear to be moderately conserved among vertebrates, but they have undergone substantial diversification during speciation (4, 5). In the few mammals in which it has been tested, tandem gene promoters control IGF1 gene expression (5, 14–19). In these species, IGF1 genes consist of six exons separated by five introns (5, 19). In contrast, in 16 nonmammalian vertebrate genomes found in the Ensembl genome browser, only a single promoter is present (20). The human IGF1 gene extends over ∼85.1 kb on chromosome 12q23.2 (20), and it is transcribed by promoters 1 and 2, each of which governs expression of a unique leader exon, exon 1 or 2, respectively [Fig. 1(a)]. In rats, in which Igf1 gene expression has been studied extensively, multiple Igf1 messenger RNAs (mRNAs) are produced by the combinatorial processes of alternative transcription, complicated by initiation at multiple sites in each leader exon, differential RNA splicing, involving the last two exons, exons 5 and 6, and alternative polyadenylation at several regions in the 3′ ends of exons 5 and 6 (14, 15, 18, 21, 22). Although it is presumed that similar events occur in human IGF1, only differential transcription initiation and alternative RNA processing have been characterized experimentally (23, 24) [Fig. 1(b)]. Four different classes of IGF1 protein precursors result from the translation of the many Igf1 or IGF1 mRNAs (5). These progenitors differ in the NH2 portions of their signal peptides, and in the COOH-terminal parts of their extension peptides or E domains (5), but all precursors encode the identical 70–amino acid secreted IGF1 molecule (5).
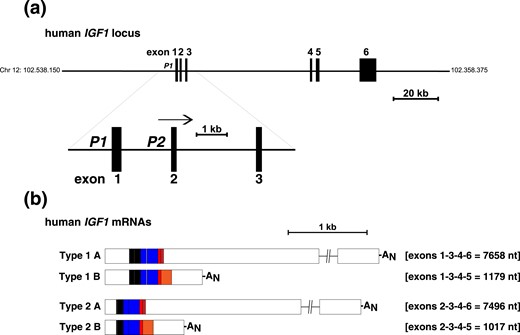
Organization of the human IGF1 gene and mRNAs. (a) Schematic of the human IGF1 locus with chromosomal coordinates. Exons are pictured as boxes, and introns and flanking DNA as horizontal lines. The enlargement below the main map illustrates the two IGF1 promoters, P1 and P2, and exons 1 to 3. The horizontal arrow indicates the direction of gene transcription. (b) Diagram of the four classes of human IGF1 mRNAs. Type 1 contains exon 1 (transcribed by IGF1 promoter 1), and type 2 encodes exon 2 (transcribed by promoter 2). The letters A and B represent transcripts that contain alternatively processed exon 6 or 5, respectively. The average length of each mRNA class is indicated in nucleotides (nt). AN represents the polyadenylic acid tail at the 3′ end of mRNAs.
GH is a key hormone controlling IGF1 gene expression in mammals (19, 25). As determined through molecular and biochemical analyses in rodents, GH acutely stimulates both Igf1 promoters through activation of the transcription factor STAT5b (26), which binds to multiple putative transcriptional enhancers that are distributed throughout the Igf1 locus (27, 28). In humans, in which inactivating mutations in the STAT5b gene phenocopy GH or GH receptor deficiency, and are associated with growth failure and IGF1 deficiency (29–31), only five of these putative enhancers have been detected in the IGF1 locus, and in initial studies only three have been shown to be functional (32).
The present analysis was undertaken to gain further insight into IGF1 gene regulation in humans, where the opportunity to perform in vivo studies is limited. Using the resources found within the publically available Ensembl genome browser, IGF1 loci and genes have been evaluated in a cohort of nonhuman primate species, with the goal of understanding the similarities and differences that may have imposed constraints on gene regulation during primate evolution and speciation.
Methods
Genome database searches
Mammalian genomic databases were accessed using the Ensembl genome browser (http://www.ensembl.org) (20). Searches were conducted using BlastN or BlastP under normal sensitivity, with human IGF1 genomic DNA segments (obtained from human genome assembly, GRCh38) or protein sequences (from the National Center for Biotechnology Information protein database) as queries, respectively. The following genome assemblies were searched from these species: chimpanzee (Pan troglodytes, CHIMP2.1.4), gorilla (Gorilla gorilla, gorGor3.1), macaque (Macaca mulatta, Mmul_8.0.1), olive baboon (Papio anubis, PapAnu2.0), marmoset (Callithrix jacchus, C_jacchus3.2.1), and mouse lemur (Microcebus murinus, Mmur_2.0). For protein sequences, GENCODE/Ensembl databases were searched. In all searches, the highest scoring results mapped to the respective IGF1 locus or protein. In the text and tables, results are reported as percentage identity over the entire query region, except where otherwise indicated.
Human IGF1 variation was inferred from analyses of data in the ExAc genome browser (http://exac.broadinstitute.org/), in which results have been compiled from exome sequencing of 60,706 individuals (33). Preliminary analysis of the IGF1 locus in Neanderthal and Denisovan individuals relied on the University of California Santa Cruz Genome Browser (http://www.genome.ucsc.edu). Approximately 175 kb were compared, including the ∼85-kb IGF1 gene, and ∼80 kb of 5′ flanking and ∼10 kb of 3′ flanking DNA among six Neanderthals and one Denisovan, and 12 modern humans from different parts of the world. Analysis of human polymorphisms in the IGF1 locus relied on the Ensembl genome browser and the GTEx portal (http://www.gtexportal.org). Transcription factor binding and epigenetic modifications within the IGF1 locus were assessed using the Cistrome Project database (http://cistrome.org/Cistrome/Cistrome_Project.html#) and ENCODE (https://www.encodeproject.org/).
Results
The IGF1 gene in primates
IGF1 appears to be a six-exon, five-intron gene in the primates included in the present study (Table 1), and its overall structure closely resembles that of human IGF1 (Fig. 1). There was remarkable congruence in the lengths of all exons and introns among primate species (Table 1), with the total size ranging from 83,137 bp in the rhesus macaque to 85,379 bp in the gorilla. The only outlier was mouse lemur IGF1, which at 91,284 bp is nearly 10% longer than the others, with the primary difference being an ∼50% increase in the length of intron 5 to 22,586 bp (Table 1).
Organization of Primate IGF1 Genes
| Gene Segment (bp) | Human | Chimpanzee | Gorilla | Macaque | Baboon | Marmoset | Mouse Lemur |
|---|---|---|---|---|---|---|---|
| Exon 1 | 327 | 327 | 327 | 327 | 327 | 327 | 327 |
| Intron 1 | 1688 | 1671 | 1691 | 1651 | 1649 | 1687 | 1740 |
| Exon 2 | 165 | 165 | 165 | 165 | 165 | 164 | 163 |
| Intron 2 | 2688 | 2681 | 2699 | 2683 | 2668 | 3067 | 2711 |
| Exon 3 | 157 | 157 | 157 | 157 | 157 | 157 | 157 |
| Intron 3 | 55,953 | 54,975 | 54,378 | 54,146 | 54,136 | 53732 | 54,137 |
| Exon 4 | 182 | 182 | 182 | 182 | 182 | 182 | 182 |
| Intron 4 | 1506 | 1506 | 1506 | 1525 | 1525 | 1826 | 1520 |
| Exon 5 | 513 | 514 | 515 | 514 | 514 | 489 | 401 |
| Intron 5 | 14,925 | 14,888 | 16,958 | 14,769 | 14,898 | 15,548 | 22,586 |
| Exon 6 | 6992 | 6988 | 6784 | 7018 | 7032 | 7012a | 7360b |
Two hundred fifty-two base pairs of unmatched DNA sequence.
Nine hundred fifty-four base pairs of unmatched and poor quality DNA sequence.
DNA conservation among IGF1 exons was high among the seven primate species studied, with overall nucleotide sequence identity being >95% for all six exons in the human, chimpanzee, gorilla, macaque, and olive baboon genes (Table 2). DNA sequence conservation with human IGF1 also was >91% for marmoset, and was >92% within exons 1 to 4 in the mouse lemur genome, but only 82% and 86% for exons 5 and 6, respectively (Table 2). Nucleotide identity was nearly as high for both IGF1 promoters, being at least 90% in all species except for mouse lemur (Table 3; see Fig. 3). As might be expected, these analyses revealed a hierarchy of nucleotide sequence identity and gene structural similarity that was highest in primate species evolutionarily closer to humans. In chimpanzees and gorillas, where the overall match with the human genome is >98.5% (34, 35), DNA sequence alignment and identity ranged from 97.5% to 100% with the two human IGF1 promoters and six exons. These parameters were slightly lower in the macaque, where homology with the human genome is ∼93.5%, and with the baboon (94% to 100%), and they were lower in the the more distantly related marmoset and mouse lemur (82% to 99%; Tables 2 and 3).
Nucleotide Identity with Human IGF1 Exons
| Nonhuman Primate | Exon 1 (327 bp)a | Exon 2 (165 bp)a | Exon 3 (157 bp) | Exon 4 (182 bp) | Exon 5 (513 bp)a | Exon 6 (6992 bp)a |
|---|---|---|---|---|---|---|
| Chimpanzee | 100 | 100 | 100 | 100 | 98.1 | 99.3 |
| Gorilla | 100 | 99.4 | 99.4 | 100 | 98.3 | 98.3 |
| Macaque | 100 | 98.8 | 98.7 | 97.3 | 95.9 | 96.0 |
| Baboon | 100 | 99.4 | 98.7 | 97.3 | 96.1 | 95.8 |
| Marmoset | 99.7 | 93.8 | 96.8 | 94.5 | 93.3 | 91.1b |
| Mouse lemur | 98.8 | 97.6 | 92.2 | 95.1 | 82.0 | 86.0c |
Coding and noncoding DNA.
Contains gap of 252 bp.
Contains gap of 954 bp.
Nucleotide Identity with Human IGF1 Promoters
| Nonhuman Primate | Promoter 1 (1694 bp) | Promoter 2 (1456 bp) |
|---|---|---|
| Chimpanzee | 97.8 | 99.3 |
| Gorilla | 97.5 | 98.7 |
| Macaque | 94.0 | 97.3 |
| Baboon | 94.6 | 97.3 |
| Marmoset | 91.3 | 90.7 |
| Mouse lemur | 85.6a | 87.5b |
| Nonhuman Primate | Promoter 1 (1694 bp) | Promoter 2 (1456 bp) |
|---|---|---|
| Chimpanzee | 97.8 | 99.3 |
| Gorilla | 97.5 | 98.7 |
| Macaque | 94.0 | 97.3 |
| Baboon | 94.6 | 97.3 |
| Marmoset | 91.3 | 90.7 |
| Mouse lemur | 85.6a | 87.5b |
Identity extends for 1329 bp.
Identity extends for 1399 bp.
Conserved IGF1 protein sequences among primates
The 70-residue secreted IGF1 molecule is encoded within four different types of protein precursors [Fig. 2(a)] that differ at their NH2 and COOH termini because of combinatorial mechanisms that produce four classes of IGF1 mRNAs [Fig. 1(b)]. Among the six nonhuman primates evaluated, mature IGF1 was identical to the human protein in all species but the marmoset, in which there were four conservative amino acid substitutions (Asp20 to Glu, Ala38 to Val, Asp45 to Asn, Ala67 to Val), each the result of nonsynonymous nucleotide changes within exon 3 or 4 [Fig. 2(d)]. Remarkably, the two different IGF1 signal peptides, in which a common COOH-terminal 27-residue segment is encoded by exon 3, and unique NH2-terminal fragments by exon 1 (21 amino acids) or exon 2 (5 amino acids) [Fig. 2(a)], also were identical among most of the primates studied, with the only exceptions being the marmoset (no open reading frame in exon 2) and the mouse lemur (common signal peptide segment differs in 4 of 27 residues) [Fig. 2(b) and 2(c)]. Neither of these changes is surprising. Even without a methionine codon in marmoset exon 2, the same open reading frame would be maintained in transcripts containing exon 2 because of another methionine at the beginning of the common signal peptide encoded in exon 3 [Fig. 2(c)]. Also, the conservative codon changes in the mouse lemur gene would not alter signal peptide function [Fig. 2(b) and 2(c)].
![Similarities and differences among primate IGF1 protein segments. (a) Schematic of human IGF1 protein precursors, showing the derivation of each segment from different IGF1 exons. Mature, 70–amino acid IGF1 (center) is found within all precursors; signal peptides 1 and 2 (left) and E peptides A and B (right) are alternatively encoded by different IGF1 mRNAs. (b and c) Amino acid sequence of IGF1 signal peptides in single letter code. The initial 21 residues of signal peptide 1 are encoded by IGF1 exon 1, and the first five residues of signal peptide 2 are derived from exon 2. The remaining 27 amino acids in each signal peptide are from exon 3. (d) Amino acid sequence in single letter code of 70-residue mature IGF1. (e and f) Amino acid sequences in single letter code of common E, EA, and EB peptides. A dash indicates no residue, and COOH-terminal amino acid extensions are pictured. For (b)–(f), dots indicate identical residues and bold lettering marks differences among humans [from the ExAc browser (33), with percentage allele frequency in parentheses] and with other species.](https://oup.silverchair-cdn.com/oup/backfile/Content_public/Journal/endo/158/4/10.1210_en.2016-1920/2/m_en.2016-1920f2.jpeg?Expires=1748551752&Signature=dPM~5ECNa-bksBVZ1D1jQ0ok8mEdQ3af1RZ3~rIQ25duFawcUsmAZF2Mva0Y8yS86jvxtalgKkPVCKVwOQSrXv0uhIC7ifMFQuEAKmIdP4Tn2-aWsmZJ4Ytql78ss~XmWt9MgQeN76i1qRFw6Y~RPeZl28nzeAMhMZ5v6KGntUW8OupXXKMgtV5StV1oRLEYMkGm1THnBHvf3RSGicgJaGPWUYszKZJrYAehOiYF~PtmeCtqXuQXzeSAtEoNsFubby~yQg4cgTpCqh~LoyGYe8TysnsLvytdDx9UROQl7wK-akNvy8JRPvasVJ4wPJ6i2XuXMhYPW3xwPr8n8cvIjw__&Key-Pair-Id=APKAIE5G5CRDK6RD3PGA)
Similarities and differences among primate IGF1 protein segments. (a) Schematic of human IGF1 protein precursors, showing the derivation of each segment from different IGF1 exons. Mature, 70–amino acid IGF1 (center) is found within all precursors; signal peptides 1 and 2 (left) and E peptides A and B (right) are alternatively encoded by different IGF1 mRNAs. (b and c) Amino acid sequence of IGF1 signal peptides in single letter code. The initial 21 residues of signal peptide 1 are encoded by IGF1 exon 1, and the first five residues of signal peptide 2 are derived from exon 2. The remaining 27 amino acids in each signal peptide are from exon 3. (d) Amino acid sequence in single letter code of 70-residue mature IGF1. (e and f) Amino acid sequences in single letter code of common E, EA, and EB peptides. A dash indicates no residue, and COOH-terminal amino acid extensions are pictured. For (b)–(f), dots indicate identical residues and bold lettering marks differences among humans [from the ExAc browser (33), with percentage allele frequency in parentheses] and with other species.
At the COOH-terminal end of the IGF1 protein precursor, the common E region (16 amino acids) and EA peptide (19 residues) matched the same segments of human IGF1, except in the marmoset, where there was a single conservative substitution of valine to alanine at position 3 of the common E peptide [Fig. 2(e)]. The 61–amino acid EB segment was highly conserved in five of the six nonhuman primate species evaluated, with a single substitution of tryptophan to glycine corresponding to human residue 18 in chimpanzee, gorilla, macaque, and baboon, and to glutamic acid in the marmoset [Fig. 2(f)]. However, during primate speciation, the DNA of the coding part of this exon underwent several alterations. In all six nonhuman primates analyzed, an arginine codon was inserted at position 16, and in the common ancestor of macaques, baboons, and marmosets, the 3′ end of the coding segment underwent an expansion of 12 codons [Fig. 2(f)]. Moreover, in the mouse lemur, a large number of other modifications occurred, such that the EB protein is now <50% identical to the other species, and consists of 67 amino acids [Fig. 2(f)]. The latter alterations are similar to the more extensive diversification of the EB region seen in other mammalian and nonmammalian species compared with other parts of the IGF1 gene (5, 36), and this supports the contention that this segment of the IGF1 protein precursor does not have an independent functional role (37, 38).
In humans, the recent analysis of genomic DNA from ∼60,000 people by exome sequencing has revealed substantial variation among individuals within the protein coding segments of genes (33). Perusal of IGF1 demonstrates the potential existence of several fairly prevalent predicted amino acid substitutions in the population, including a change from cysteine to tryptophan at position 15 of signal peptide 1 (0.03% of alleles), putative alterations of alanines 67 and 70 to threonine in mature IGF1 (0.1% and 0.05%, respectively), and modifications of threonine 10 to methionine and alanine 53 to aspartate in the EB peptide region (0.01% and 0.2%, respectively) [Fig. 2], but no tryptophan to glycine substitution at residue 18 or insertion of an arginine at position 16 has been detected [Fig. 2(f)]. Additionally, there are possible changes at 46 other locations, including 13 different amino acid substitutions at 10 sites in the two signal peptides, 11 in mature IGF1 at 10 sites, and 23 at 22 locations in the E regions, plus one premature stop codon in the common E peptide and two frame shifts and one in-frame deletion in the EB region. Collectively, this latter group of 50 predicted alterations comprise no more than 0.2% of the ∼60,000 individuals sequenced, with most being found in a single allele (33), and it is currently unknown whether any of these modifications in genomic DNA leads to different types of expressed IGF1 in humans.
Insights into IGF1 gene regulation
Limited work during the past 25 years using reporter assays in transfected cells has defined regions within human IGF1 promoters 1 and 2 that are important for their basal transcriptional activity (16, 39–42), and also identified segments of promoter 1 that may serve as possible mediators of the actions of hepatic-enriched transcription factors on IGF1 gene expression in the liver (43–45). DNA segments also have been mapped in rat and human Igf1 promoter 1 that appear to serve as response elements for hormones that activate cyclic adenosine monophosphate and use the transcription factor C/EBPδ (46, 47), but have not been characterized functionally in other species.
Presented in Table 3 and Fig. 3 are results of analyses comparing human IGF1 promoters 1 and 2 with their orthologous regions in six other primates and in the rat. In six of seven primates, nucleotide conservation is high over a span of ∼1500 bp for each promoter, with overall DNA sequence identity ranging from 91% to 99%, and with limited decline in the distal 1000 nucleotides compared with the proximal 500 bp. The only exception is mouse lemur, with identity of promoter 1 dropping from 91% to 83% from the proximal to the distal region [Fig. 3(a) and 3(c)]. The DNA elements noted previously that have been experimentally mapped in proximal human IGF1 promoter 1 and in the noncoding region of exon 1 are variably conserved in the other species. A binding site for C/EBPδ and sites for HNF-3 are present in all seven primates, but HNF-1 and C/EBPα/β sequences are not [Fig. 3(b)].
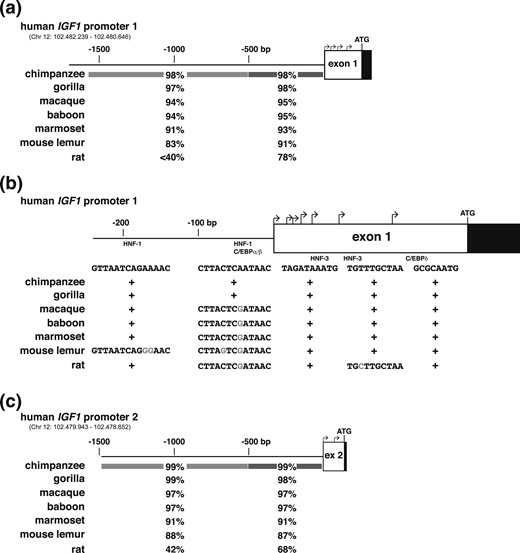
Comparison of IGF1 gene promoters. (a) Schematic of human IGF1 gene promoter 1 and exon 1. Bent arrows indicate transcription start sites in exon 1, and the location of the ATG codon is labeled. Coding DNA is in black and noncoding DNA is in white. Chromosomal coordinates for the promoter are listed. Below the map, percentage identities with human IGF1 are shown for different species for the proximal 500 and distal 1194 bp, respectively, as indicated by shading. (b) Schematic of proximal human IGF1 gene promoter 1 and exon 1, labeled as in (a), with the relative frequency of transcription start site usage depicted by the height of each bent arrow. Below the map the presence of identical sites in different species is indicated by + for HNF-1, C/EBPα/β, HNF-3, and C/EBPδ, and altered nucleotides in modified sites are shaded gray. (c) Schematic of human IGF1 gene promoter 2 and exon 2, labeled as in (a). Chromosomal coordinates for the promoter are listed. Below the map, percentage identities with human IGF1 are shown for different species for the proximal 500 and distal 956 bp, respectively, as indicated by shading.
The most important physiological activator of IGF1 is GH (48). GH stimulates Igf1 gene transcription in rats via the presumed combinatorial interplay of up to seven inducible STAT5b binding elements that are dispersed within the Igf1 locus, being found in distal 5′ flanking DNA and introns, but not near the two promoters (27, 28). These elements have the biochemical and physiological properties of transcriptional enhancers, as they bind STAT5b and cofactors, including p300, the mediator complex, and RNA polymerase II, undergo reversible histone modifications (27), and at least for several of the elements, have been shown to physically interact with Igf1 promoters in a GH-stimulated way (49). Recently, five of these regions were found to be conserved in analogous locations in the human IGF1 locus (Fig. 4), and using cells containing a single copy of the locus, it was demonstrated that three of these DNA segments were able to bind STAT5b in chromatin concurrent with GH-activated IGF1 gene transcription (32).
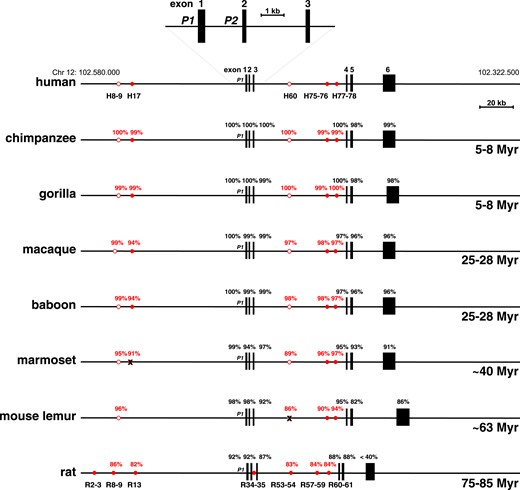
Comparison of IGF1 genes. Schematics of human IGF1, other primate IGF1, and rat Igf1 genes and loci are shown. Chromosomal coordinates for human IGF1 are indicated. Nucleotide identities with human binding sites for STAT5b (circles) are depicted in red, and identities with human IGF1 exons in black. Filled circles represent sites shown to bind Stat5b in human IGF1 or rat Igf1 chromatin; open circles represent sites that have not been confirmed experimentally. Below each map at the lower right are the evolutionary distances from humans for each species (Myr, 1 million years). H8–9, H17, H60, H75–76, H77–78, nomenclature for human STAT5b sites (49); P1, promoter 1; P2, promoter 2; R2–3, R8–9, R13, R34–35, R53–54, R57–59, R60–61, nomenclature for rat STAT5b sites (27). At the marmoset site analogous to H17 and the mouse lemur site analogous to H60 the absence of intact STAT5b binding sequences are each depicted by an X.
The same five putative STAT5b binding domains have been found in the genomes of nonhuman primates and are located within their respective IGF1 loci in positions very similar to those mapped in human IGF1 (Fig. 4; Table 4). Comparison of the DNA sequences of these elements revealed high levels of similarity with the corresponding human regions, with >99% identity in several segments in chimpanzee, gorilla, macaque, and baboon, and full conservation of the nine-nucleotide pair canonical STAT5b binding sequences, as well as near identity in spacing, as defined by the number of nucleotides residing between paired sites (Table 5). The only exceptions to this high level of conservation were seen in the more distantly related marmoset and mouse lemur. The STAT5b element human (H)17, which was not detected in mouse lemur, has a critical amino acid mutation in the nine nucleotide-pair recognition sequence in the marmoset that presumably renders it incapable of binding STAT5b (50–52) (Table 5). H60, although identified by DNA sequence similarity in mouse lemur IGF1 intron 3 with the analogous human segment, lacks a STAT5b binding site (Fig. 4; Table 5). Additionally, in the baboon region corresponding to H75 to H76 in IGF1 intron 3, a single nucleotide substitution has occurred within the central part of the 3′ STAT5b binding sequence, changing it from 5′-TTC ACA GAA-3′ to 5′-TTC GCA GAA-3′ (Table 5), but this modification is found in authentic STAT5b elements (50–52).
Location of Putative Stat5b Binding Regions in Primates
| Species | H8-9 | H17 | H60 | H75-76 | H77-78 |
|---|---|---|---|---|---|
| Human | −76,538 | −68,143 | +26,068 | +50,645 | +55,218 |
| Chimpanzee | −77,634 | −69,209 | +26,064 | +49,157 | +54,247 |
| Gorilla | −76,495 | −68,083 | +26,150 | +49,117 | +53,736 |
| Macaque | −80,511 | −69,894 | +25,939 | +48,711 | +53,376 |
| Baboon | −78,746 | −70,282 | +26,255 | +48,731 | +53,376 |
| Marmoset | −78,348 | −72,047 | +26,554 | +48,644 | +53,567 |
| Mouse lemur | −77,218 | None | +25,777 | +49,076 | +53,226 |
Locations in nucleotides are relative to the 5′ end of exon 1.
Comparison of STAT5b Binding Elements in Primate IGF1 Loci
| Human | Chimp | Gorilla | Macaque | Baboon | Marmoset | Mouse Lemur | |
|---|---|---|---|---|---|---|---|
| H8-9 (306 bp) | |||||||
| % Identity | 100 | 100 | 99.7 | 99.0 | 99.0 | 95.4 | 96.4 |
| 5′ Site | TTCTAAGAA | TTCTAAGAA | TTCTAAGAA | TTCTAAGAA | TTCTTAGAA | TTCTTAGAA | TTCTTAGAA |
| Intersite length, bp | 220 | 220 | 220 | 220 | 220 | 220 | 220 |
| 3′ Site | TTCTTAGAA | TTCTTAGAA | TTCTTAGAA | TTCTTAGAA | TTCTTAGAA | TTCTTAGAA | TTCTTAGAA |
| H17 (240 bp) | |||||||
| % Identity | 100 | 99.1 | 99.2 | 93.9 | 93.9 | 91.2 | — |
| 5′ Site | TTCCTTGAA | TTCTAAGAA | TTCTAAGAA | TTCCTTGAA | TTCCTTGAA | TTCCTTAAA | — |
| Intersite length, bp | — | — | — | — | — | — | — |
| 3′ Site | — | — | — | — | — | — | — |
| H60 (150 bp) | |||||||
| % Identity | 100 | 100 | 100 | 97.3 | 98.0 | 89.1 | 86.3 |
| 5′ Site | TTCAGGGAA | TTCAGGGAA | TTCAGGGAA | TTCAGGGAA | TTCAGGGAA | TTCAGGGAA | — |
| Intersite length, bp | — | — | — | — | — | — | — |
| 3′ Site | — | — | — | — | — | — | — |
| H75–76 (240 bp) | |||||||
| % Identity | 100 | 99.6 | 99.6 | 97.8 | 97.8 | 96.4 | 89.7 |
| 5′ Site | TTCTCAGAA | TTCTCAGAA | TTCTCAGAA | TTCTCAGAA | TTCTCAGAA | TTCTCAGAA | TTCTCAGAA |
| Intersite length, bp | 6 | 6 | 6 | 6 | 6 | 6 | 6 |
| 3′ Site | TTCACAGAA | TTCACAGAA | TTCACAGAA | TTCACAGAA | TTCGCAGAA | TTCACAGAA | TTCACAGAA |
| H77–78 (240 bp) | |||||||
| % Identity | 100 | 99.6 | 100 | 97.4 | 97.4 | 96.6 | 94.0 |
| 5′ Site | TTCCTAGAA | TTCCTAGAA | TTCCTAGAA | TTCCTAGAA | TTCCTAGAA | TTCCTAGAA | TTCCTAGAA |
| Intersite length, bp | 128 | 128 | 128 | 127 | 127 | 127 | 127 |
| 3′ Site | TTCATAGAA | TTCATAGAA | TTCATAGAA | TTCATAGAA | TTCATAGAA | TTCATAGAA | TTCATAGAA |
Boldface specifies differences in the DNA sequence.
Discussion
IGF1 is a large and complicated gene that encodes a small and relatively simple 70-residue secreted peptide (4, 5). In mammals, the protein precursor of IGF1 is translated from four types of mRNAs arising from the combinatorial interplay of several regulatory mechanisms (5, 18) [see Fig. 1(b)]. Although there are minimal data on the specifics of IGF1 gene expression and its regulation in nonhuman primates (53), based on genomic analyses in the six species evaluated in the present study, it appears that mechanisms similar to those identified in humans are potentially functional in other primates too. The genomes of the primates analyzed in this study all encode IGF1 genes that share topological features with human IGF1, including overall gene size of ∼85 to 92 kb, the presence of tandem promoters, and a structure with six exons interrupted by five introns, including a central intron of 53.7 to 55.9 kb separating exons 3 and 4 (Fig. 4; Tables 1–3). Nonhuman primate IGF1 genes also appear able to be transcribed and processed into the four types of IGF1 mRNAs found in humans and other mammals (14, 15, 18, 21–24), and potentially are translated into the same four classes of IGF1 precursor proteins (Fig. 2), although there is yet no direct experimental evidence supporting these contentions. Of note, in an analysis of the coding regions of >15,000 orthologous genes shared by five primate species (human, colobus monkey, rhesus macaque, vervet, and tamarin), IGF1 was in the top 25% of conserved proteins (54).
There also is congruence of DNA sequence identity extending for >1500 bp in each of the two IGF1 promoters among human and nonhuman primates. This includes conserved transcription factor binding sites within the noncoding part of exon 1, although there has been divergence of other elements in promoter 1, specifically those that recognize HNF-1 and C/EBPα/β in the human promoter (Fig. 3). These speculative observations suggest that similar regulatory paradigms may govern basal IGF1 gene expression in many of these species.
Perhaps more intriguing are the conserved relationships among putative GH-regulated STAT5b binding elements in primate IGF1 loci (Fig. 4; Tables 4 and 5), especially given the central role that GH plays in the molecular physiology of IGF1 (19, 25–27). In the only functional studies reported to date on this topic for human IGF1, GH was found to rapidly activate its transcription in a STAT5b-dependent way in chimeric cell lines containing a single copy per haploid genome of the human locus (32). As there is a high level of DNA sequence conservation with the homologs of the three elements found to bind STAT5b in human chromatin, H17, H75 to H76, and H77 to H78 (32), especially with chimpanzee, gorilla, macaque, and baboon (94% to 100% identity, Table 5), and of their genomic localization relative to the IGF1 promoters (Fig. 4; Table 4), it seems likely that IGF1 gene regulation by GH in these species parallels what occurs in humans.
As a growth factor with key roles in many physiological and pathophysiological processes in humans and in other mammals (1–3, 8–13), it is not surprising that IGF1 gene regulation would be under multifactorial control. Yet, perhaps because IGF1 is expressed minimally in most human and other mammalian cell lines, there was no evidence for enrichment of either transcription factor binding or epigenetic modifications within the IGF1 locus in either the Cistrome Project database (http://cistrome.org/Cistrome/Cistrome_Project.html#) or in ENCODE (https://www.encodeproject.org/).
Every human genome contains several million DNA sequence polymorphisms (55), and many of these have the potential to modify gene expression because of their location within promoters, enhancers, or other regulatory regions (56). The IGF1 locus is no exception, and single nucleotide polymorphisms have been identified in promoter 1 (57), in each of the three identified functional STAT5b binding elements recently characterized (32), and in other parts of the IGF1 locus (see the GTEx portal on human variation at http://www.gtexportal.org/), although none of these alterations has been examined for an impact on IGF1 gene regulation. To date, this wealth of data about genomic variability among humans has not been obtained in other primates, primarily because of the small number of genomes that have been sequenced, although it seems likely that similar types of individual differences will exist, including both single nucleotide polymorphisms, copy number variations, and DNA insertion-deletions (58). It has been calculated that humans and chimpanzees diverged from a common ancestor ∼5 to 8 million years ago (34, 35). During this interval the two species developed only a small number of DNA differences, such that the two genomes are at present 98.5% to 99% identical, although this extent of congruence does not take into account areas containing insertions and deletions of species-specific DNA (35). The high level of identity between IGF1 loci clearly reflects this limited divergence between humans and chimpanzees, although it is less than that found in some other genes (34). A nearly similar degree of separation exists between human and gorilla and between chimpanzee and gorilla genomes (35), although recent studies have begun to identify chromosomal segments where interprimate variability is substantial, demonstrating that evolutionary processes do not act at a steady rate throughout an entire genome (59).
Somatic growth in juveniles of many mammalian species is controlled by complex interactions that are influenced by both genetic and environmental factors (60). Many classes of genes, including GH and IGF1, have an impact on growth rates and final adult height (60, 61). Some of these genetic influences may be traced to our ancestors, not only to our common primate progenitors, but also to other no longer extant human populations, such as Neanderthals and Denisovans (60, 62, 63). Modern humans contain measurable but small amounts of introgressed DNA from past contacts with these populations, which have left a genomic imprint with the potential of modifying several traits, as detected recently for skin pigmentation and hair color, and possibly for certain disease susceptibilities (63). An initial analysis of the IGF1 locus reveals no greater differences between the reference human genome and either Neanderthals or Denisovans than is seen with 12 modern human individuals, indicating that contributions to IGF1 gene regulation from these past interactions may be very difficult to discern [University of California Santa Cruz Genome Browser, comparison with NCBI 36 (hg18) assembly]. However, recent studies detecting substantial variability among humans in protein coding regions of genes (33, 64, 65) (see Fig. 2) may lead to a re-evaluation of this postulate should more DNA sequences from Neanderthals or Denisovans become available.
The essential and multifactorial role of IGF1 in normal physiology and disease is potentially reflected in its complicated gene structure and by its complex patterns of regulation, such as its control by GH (19, 25). The fairly high level of organizational and DNA sequence similarity of the IGF1 gene and locus among the seven primate species examined in this study supports the contention that analogous regulatory paradigms have existed prior to the onset of primate speciation >85 million years ago (34, 35). These hypotheses and others generated by comparative genomics now can be tested in experimental systems and will provide new insights into the complex biology of IGF1, GH, and other key regulatory molecules.
Abbreviations:
Acknowledgments
This work was supported in part by National Institutes of Health Grant R01 DK069703-08 (to P.R.).
Disclosure Summary: The author has nothing to disclose.
References
Author notes
Address all correspondence and requests for reprints to: Peter Rotwein, MD, Department of Biomedical Sciences, Paul L. Foster School of Medicine, Texas Tech University Health Sciences Center, 5001 El Paso Drive, El Paso, Texas 79905. E-mail: [email protected].
