


Millions of levothyroxine-treated hypothyroid patients complain of impaired cognition despite normal TSH serum levels. This could reflect abnormalities in the type 2 deiodinase (D2)-mediated T4-to-T3 conversion, given their much greater dependence on the D2 pathway for T3 production. T3 normally reaches the brain directly from the circulation or is produced locally by D2 in astrocytes. Here we report that mice with astrocyte-specific Dio2 inactivation (Astro-D2KO) have normal serum T3 but exhibit anxiety-depression-like behavior as found in open field and elevated plus maze studies and when tested for depression using the tail-suspension and the forced-swimming tests. Remarkably, 4 weeks of daily treadmill exercise sessions eliminated this phenotype. Microarray gene expression profiling of the Astro-D2KO hippocampi identified an enrichment of three gene sets related to inflammation and impoverishment of three gene sets related to mitochondrial function and response to oxidative stress. Despite normal neurogenesis, the Astro-D2KO hippocampi exhibited decreased expression of four of six known to be positively regulated genes by T3, ie, Mbp (∼43%), Mag (∼34%), Hr (∼49%), and Aldh1a1 (∼61%) and increased expression of 3 of 12 genes negatively regulated by T3, ie, Dgkg (∼17%), Syce2 (∼26%), and Col6a1 (∼3-fold) by quantitative real-time PCR. Notably, in Astro-D2KO animals, there was also a reduction in mRNA levels of genes known to be affected in classical animal models of depression, ie, Bdnf (∼18%), Ntf3 (∼43%), Nmdar (∼26%), and GR (∼20%), which were also normalized by daily exercise sessions. These findings suggest that defects in Dio2 expression in the brain could result in mood and behavioral disorders.
Thyroid hormone molecules reach the brain through the circulation and within the brain undergo controlled metabolism that can either result in activation or terminal inactivation. The prohormone T4 crosses the blood-brain barrier via specific transporters, eg, organic anion-transporting polypeptide (Oatp), and can then be taken up by glial cells via monocarboxylate transporters such as monocarboxylate transporter 10 (1). Inside the glial cells, T4 is deiodinated to the active hormone T3 by the type 2 deiodinase (D2), a small integral membrane dimeric protein with a selenocysteine-containing active center embedded in a thioredoxin-like fold (2, 3). D2-generated T3 normally diffuses from the glial cells into neighboring neurons via the monocarboxylate transporter 8 (Mct8), in which it acts in a paracrine fashion to modulate T3-responsive genes (4).
Knowledge about thyroid hormone homeostasis in the brain was advanced by studies in which rats received timed injections of 125I-T4 that was followed by quantification of 125I-T3 bound to thyroid hormone receptor (TR) in whole brains. As opposed to most other tissues, there is a high degree of occupancy of TRs in the rat brain, almost saturation, with predominant contribution by locally D2-produced T3 (5, 6). Direct quantification of T3 in the brain revealed that the cerebellum, hypothalamus, and midbrain of a mouse with global inactivation of the Dio2 gene (global-D2KO) contain less T3, depending on the age of the animal (7, 8). Subsequent studies reported that the expression of only one (of 18) T3 positively regulated genes was decreased in the cerebral cortex of 21-day-old global-D2KO mice and that the expression of 12 (of the 15) T3 negatively regulated genes was increased (9). Similar results were obtained in 21- and 50-day-old global-D1/D2KO animals (10).
Neurons express the inactivating type 3 deiodinase (D3), which inactivates both T4 and T3 and has been shown to dampen thyroid hormone signaling in a cell- or tissue-specific fashion (4). In neurons D3 is located in the plasma membrane and in the membranes of dense core vesicles (11, 12). However, D3 can accumulate in the nuclear membrane under ischemic and/or hypoxic conditions, in which it dampens thyroid hormone signaling (4, 13). In addition, there is elevated T3 content in the brains of mice with inactivation of the Dio3 gene (D3KO) (14).
Therefore, thyroid hormone signaling in the brain depends on plasma T4 and T3, membrane transporters, and the expression of D2 and D3, which provides a means to localized control of thyroid hormone action. In addition, these two deiodinases also constitute a homeostatic advantage given their reciprocal response to hypothyroidism (15, 16): D2 activity accelerates and D3 activity slows down, increasing fractional conversion of T4 to T3 and decreasing T4 and T3 clearance rates (17). However, the lack of a significant neurological phenotype in the global-D2KO mouse has placed in check the relevance of the D2 pathway and the local T3 production in the brain (7). After extensive neurological testing of the global-D2KO mouse, including reflexes, olfaction, coordination of motor systems, learning and memory, and anxiety, the only finding was diminished agility (7). These minimal findings could also reflect successful activation of homeostatic processes that compensate for the lack of T3 production in the brain.
In the present study, we sought to obtain new insight into the role played by D2 pathway in the brain by phenotypically characterizing mice that have selective inactivation of Dio2 in astrocytes (Astro-D2KO). These animals are systemically euthyroid and have normal serum thyroid hormone levels (18) but do exhibit accelerated diurnal rate of fatty acid oxidation (19).
Materials and Methods
All experiments were planned according to the American Thyroid Association guide to investigating thyroid hormone economy and action in rodent and cell models (20) and were approved by the Institutional Animal Care and Use Committee at Rush University Medical Center.
Animals
Astro-D2KO mice were created and maintained as described previously (18). Briefly, floxed D2 mice (Dio2Flx) (87.5% B6, 12.5% 129sv) were crossed with transgenic mice expressing Cre recombinase under the glial fibrillary acidic protein promoter (GFAP-Cre; FVB-Tg[GFAPCre]25Mes/J; The Jackson Laboratory) backcrossed seven times with B6 mice. GFAP-Cre littermate animals were used as controls throughout the studies. In all experiments, 9- to 14-week-old male mice housed in standard plastic cages (four per cage) were kept at room temperature (22°C), with a 12-hour dark, 12-hour light cycle starting at 6:00 am. Animals were kept on standard chow diet (3.1 kcal/g; 2918 Teklad Global Protein Rodent Diet; Harlan Laboratories). All animals were killed by asphyxiation in a CO2 chamber or by transcardiac perfusion with fixative solution after anesthesia.
Comprehensive lab animal monitoring system (CLAMS)
Ambulatory activity profiles were obtained by admitting mice to individual cages with free access to food and water for 1 week in a CLAMS (Columbus Instruments). This system allows for continuous measurement of movement inside the cage: X (front to back), Y (right to left), Z (rearing), and distance (centimeters); all studies were performed after a 48-hour adaptation period. In a separate study, animals were allowed to use the free-running wheel and data reported as accumulated revolutions per 48 hours.
Behavioral testing
With the exception of the open field test (7:00–9:00 am), all behavioral tests were performed in the afternoon (3:00–5:00 pm), in the following order:
Open field test (OFT)
The OFT was used for the assessment of locomotor and exploratory activity (21). The apparatus was located in a 1.8- × 4.6-m test room with background lighting provided by a 15-lux lamp; the apparatus was washed with a 5% alcohol-water solution before placement of the animals. Animals were tested in an acrylic squared arena (72 × 72 cm) surrounded by a 30-cm wall. The floor of the arena was marked with lines delimitating sixteen 18- × 18 cm-squares; mice were placed into the center of the arena and observed for 5 minutes; all tests were recorded by video camera for later analysis of the following: 1) time in the open field center; 2) total entries in the open field center; 3) total number of lines crossed with four paws; 4) rearing; 5) freezing; and 6) grooming.
Elevated plus maze (EPM)
The EPM was made of plywood covered with plastic and consisted of two opposed open arms (30 × 5 cm) and two opposed enclosed arms (30 × 5 × 15 cm) connected by a central open square (5 × 5 cm) (21). The maze was elevated 38 cm above the floor and placed inside a room free of noise and disturbances, under laboratory dim light; the test was recorded by video camera for later analysis. Animals were placed into the central square of the maze facing one of the open arms and observed for 5 minutes for the following: 1) number of entries into open and enclosed arms; 2) time spent inside the open and enclosed arms; 3) rearing; 4) time of freezing; and 5) number of head dips (22).
Tail suspension test (TST)
The TST involves suspending a mouse by the tail and measurement of the immobility time. The mouse is suspended in the center of a container with width and depth sufficiently sized so that the mouse cannot make contact with the walls. In this setting, the approximate distance between the mouse's nose and the floor is 20–25 cm. A plastic suspension bar (1 cm height × 1 cm width × 60 cm length) used to suspend the tail is positioned on top of the box (21). Mice were suspended for 5 minutes and the test taped with a video camera for later analysis. Immobility was defined as the lack of movement of any limbs.
Forced swim test (FST)
The FST was performed in a cylindrical tank (30 cm height × 20 cm diameter) made of transparent Plexiglas (21). The water level was 15 cm from the bottom and was marked on the tank wall to ensure consistency throughout the studies. The dimensions of the tank were selected so that mice were not be able to touch the bottom of the tank, either feet or tail, during the test and tall enough to prevent the mice from escaping. Mice were place into the water (28°C-30°C) for two 5-minute sessions. Each animal underwent one test per day on 2 consecutive days. The tests were taped with a video camera for later analysis. Each animal was scored as either floating or swimming. Floating was defined as the lack of movement of any limbs. Before returning the animals to the home cages, they were dried gently and kept under a heat lamp to prevent hypothermia.
Treadmill exercise protocol
Mice were placed on the motorized treadmill (Columbus Instruments) following an exercise protocol consisting of 30 minutes of treadmill running at 13 m/min, five times a week for 4 weeks with no inclination. In separate experiments, animals underwent exercise training for 30 minutes once a day for 5 consecutive days at 60% of maximum speed (Smax). Smax was determined through the maximal exercise capacity test as previously described (23, 24). Mice were euthanized 3 hours after the last session of exercise. The brain was dissected, snap frozen, and stored in liquid nitrogen for further analysis. All exercise sessions were performed between 1:00 and 5:00 pm.
Brain regions dimensions
Sections mounted on gelatin-coated slides were dehydrated with ascending series of ethanol, treated with xylene for 5 minutes, and rehydrated in descending series of ethanol and in MilliQ water. Then the sections were treated with 1% cresyl violet (Sigma) solution for 3 minutes followed by differentiation in acetic acid in 100% ethanol (at 1:50 000 dilution) for 5 seconds. Then the sections were dehydrated in ascending series of ethanol, treated with xylene, and coverslipped using DPX mounting medium (Sigma-Aldrich, Inc). The ImageJ software (National Institutes of Health, Bethesda, Maryland) was used to perform the measurements on Nissl-stained sections (n = 6). The following parameters were measured and expressed in micrometers: hippocampus − total height and height of dentate gyrus; cerebellum − height of stratum granulosum; cerebral cortex − heights of layers 2–6.
Myelin basic protein (MBP) labeling in the hippocampus and corpus callosum
Mice were anesthetized with ketamine (100 mg/kg) and xylazine (5 mg/kg) ip and perfused transcardially with 10 mL PBS (pH 7.4) followed by 40 mL 4% paraformaldehyde in 0.1 M phosphate buffer (pH 7). Brains were removed and cryoprotected in 30% sucrose in PBS. The brains were frozen in powdered dry ice, and coronal, 25-μm-thick sections were prepared with a freezing microtome (Leica). The sections were collected in freezing solution (30% ethylene glycol; 25% glycerol; 0.05 M phosphate buffer) and stored at −20°C until used. The sections were washed three times in PBS and then in 0.5% Triton X-100 + 0.5% H2O2 in PBS 15 minutes and rinsed again in PBS three times. The nonspecific antibody binding was blocked by treatment in 2% normal horse serum in PBS for 20 minutes followed by incubation in rabbit anti-MBP primary antibody (1:250, AB980; Merck-Millipore) for 24 hours and washed in PBS. Fluorescein -conjugated antirabbit IgG (1:250; Jackson ImmunoResearch) was applied for 1.5 hours and the sections were washed again in PBS three times. The sections were mounted on glass slides and coverslipped with Vectashield mounting medium (Vector). The ImageJ software (National Institutes of Health) was used to measure total density of the whole hippocampus (n = 6).
Examination of the adult neurogenesis
Injection of 5-bromo-2′-deoxyuridine (BrdU; 80 mg/kg; sc; Sigma-Aldrich) was performed for 2 consecutive days, five times per day in 8 hours. Subsequently, animals were anesthetized and perfused with fixative and 25-μm-thick coronal brain sections were prepared as described above. The sections were also pretreated based on the above-described protocol. To label the perikarya of neurons, the sections were incubated in mouse anti-HuC/D biotinylated antibody (1:300; Life Technologies) for 2 days at 4°C. After washing in PBS, the sections were immersed in avidin-biotin complex (1:1000, ABC Elite kit; Vector) for 1 hour, followed by rinses in PBS. Sections were subjected to biotinylated tyramide amplification using the tyramide signal amplification kit according to the manufacturer's instructions (NEN Life Science Products) and then washed in PBS three times. This was followed by incubation in 2 M HCl for 2 hours and then washed in PBS four times. Section were incubated with fluorescein-conjugated streptavidin (1:250; Vector) for 1.5 hours and washed in PBS three times. This was followed by incubation in sheep anti-BrdU antibody (1:300; Abcam) for 24 hours, washed in PBS three times, and then incubated with Alexa-555-conjugated antisheep IgG (1:250; Life Technologies) and washed in PBS three times. Sections were mounted on glass slides and coverslipped with Vectashield mounting medium (Vector).
Deiodinase assays
D2 and D3 assays were performed in sonicates of brain and pituitary gland tissue in the presence of 10 mM ditiotreitol and 0.25 M sucrose as described previously (20). D2 assays were performed using 1 nM 125I-(5′) T4 (PerkinElmer) in the presence of 1 mM propylthiouracil and 10 nM T3 to minimize T4 deiodination by D3 (20). D3 activity was measured as previously described in the presence of 0.2 nM 125I-(5′) T3 (PerkinElmer). Reactions were stopped by the addition of methanol, and the products of deiodination were quantified by ultraperformance liquid chromatography (ACQUITY; Waters Corp.). Fractions were automatically processed through a Flow Scintillation Analyzer Radiomatic 610TR (PerkinElmer) for radiometry.
Gene expression analysis
Total tissue RNA was extracted from the hippocampus and cerebral cortex using the RNeasy lipid tissue minikit (QIAGEN), following the manufacturer's instructions including deoxyribonuclease treatment for 30 minutes. RNA was quantified with a NanoDrop spectrophotometer, and 0.5–1.0 μg total RNA was used to produce cDNA using the Transcriptor first-strand cDNA synthesis kit (Roche). Quantitative real-time PCR (RT-qPCR) conditions were performed as previously described (25). We used either primers designed to span exon-exon and/or intron-spanning sequences or previously validated (https://pga.mgh.harvard.edu/primerbank/). All primer sequences are listed in Supplemental Table 1. Genes of interest were analyzed (Step-One; Applied Biosystems) using PerfeCTa SYBR Green Fastmix Rox (Quantas). The melting curve protocol was used to verify the specificity of the amplicon generation. Standard curves consisted of four to five points of serially diluted mixed experimental and control group cDNA. Cyclophilin A (CycloA) was used as a housekeeping internal control gene; its expression level was similar between groups. The coefficient of correlation was greater than 0.99 for all curves, and the amplification efficiency ranged between 80% and 110%. Results were expressed as the ratio of test mRNA to CycloA mRNA.
The following genes were studied: iodothyronine deiodinase, type II (Dio2), monocarboxylate transporter 8 (Mct8), organic anion-transporting polypeptide 14 (Oatp14), myelin basic protein (Mbp), myelin-associated glycoprotein (Mag), hairless (Hr), aldehyde dehydrogenase family 1, subfamily A1 (Aldh1a1), RNA binding motif protein 3 (Rbm3), neurogranin (Nrgn), 3-hydroxy-3-methylglutaryl-coenzyme A synthase 2 (Hmgsc2), hyaluronan and proteoglycan link protein 1 (Hapln1), diacylglycerol kinase, γ (Dgkg), cold inducible RNA binding protein (Cirbp), icos ligand (Icosl), MARCKS-like 1 (Marcksl1), solute carrier family 1 (glial high affinity glutamate transporter), member 3 (Slc1a3), outer dense fiber of sperm tails 4 (Odf4), synaptonemal complex central element protein 2 (Syce2), collagen, type VI, α1 (Col6a1), sulfotransferase family 1A, phenol-preferring, member 1 (Sult1a1), ATP/GTP binding protein-like 3 (Agbl3), 5-hydroxytryptamine (serotonin) receptor 1A (Htr1a), 5-hydroxytryptamine (serotonin) receptor 1B (Htr1b), brain-derived neurotrophic factor (Bdnf), neurotrophin 3 (Ntf3), ciliary neurotrophic factor (Cntf), nerve growth factor (Ngf), vascular endothelial growth factor a (Vegfa), glutamate receptor, ionotropic, N-methyl-D-aspartate 1 (Nmdar), neuronal PAS domain protein 4 (Npas4), Nuclear receptor subfamily 3, group C, member 1 (GR).
Microarray
Hippocampi from four control and four Astro-D2KO mice were dissected as above and RNA prepared using the RNeasy lipid tissue minikit (QIAGEN) as per the manufacturer's instructions. Microarray analysis was performed by the Joslin Diabetes Center Genomics Core Laboratory (Boston, Massachusetts). Gene expression was evaluated using Genechip Mouse Gene 2.0 ST arrays (Affymetrix, Inc) that uses a whole-genome design to assess more than 35 000 transcripts. Gene expression data were preprocessed using Affymetrix Expression Console. Differential expression analysis was performed in Affymetrix transcriptome analysis console to identify individual genes demonstrating enrichment in the comparison of control vs Astro-D2KO animals. Expression values (signal) of individual genes were log2 transformed. One-way ANOVA was used to calculate the P values for each fold change (linear); multitesting correction was then performed using the Benjamini-Hochberg Step-Up false discovery rate (FDR)-controlling procedure for all the expressed genes. Individual genes demonstrating differential expression were considered statistically significant with an ANOVA P < .05; gene ontology analysis was used to determine the differences in gene sets between control and Astro-D2KO animals (Gene Set Enrichment Analysis [GSEA]); Broad Institute, Cambridge, Massachusetts). Expression values for all genes from all eight samples were used; no filter was applied to eliminate genes with low expression. GSEA included calculation of enrichment scores, estimation of significance level of enrichment scores (nominal P value), and adjustment for multiple hypothesis testing including the normalized enrichment score and FDR. There were no gene sets with an FDR of 25% or less, so a nominal value of P < 1% was chosen to indicate significance.
Statistical analyses
Data are expressed as mean ± SEM and were analyzed using PRISM software (GraphPad Software). A one-way ANOVA was used to compare more than two groups, followed by the Student-Newman-Keul's test to detect differences between groups. The Student's t test was used when only two groups were part of the experiment; P < .05 was used to reject the null hypothesis.
Results
Structural analysis and deiodinase expression in the Astro-D2KO brain
No differences in D2 activity were observed in cerebral cortex, hippocampus, or cerebellum of Dio2flx or GFAP-Cre mice when compared with wild-type animals (Supplemental Figure 1A–C). Astro-D2KO animals exhibited 70%–95% reduction in Dio2 mRNA levels and D2 activity in the cerebral cortex and hippocampus (Figure 1, A–D) when compared with GFAP-Cre (control) animals. D2 activity was preserved in the pituitary gland (Figure 1E) and hypothalamus (18); D3 activity in hippocampus was unchanged in the Astro-D2KO animals (Figure 1F). No differences in the thyroid hormone transporters Mct8 and Oatp14 mRNA levels in hippocampus or cerebral cortex were observed (Figure 1, G and H, and Supplemental Figure 1, D and E).
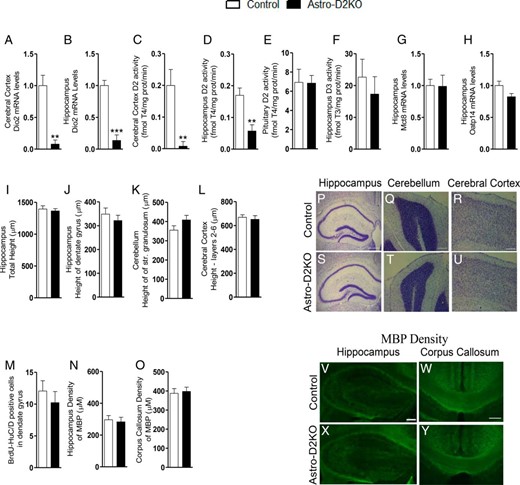
Deiodinases, gene expression, and histological structure in Astro-D2KO Brain. A and B, Dio2 mRNA levels in cerebral cortex and hippocampus. C–E, D2 activity in the cerebral cortex, hippocampus, and pituitary gland. F, D3 activity in the hippocampus. G and H, Mct8 and Oatp14 mRNA levels in the hippocampus. Nissl-stained sections: I, hippocampus, total height (μM); J, hippocampus, height of dentate gyrus (μM); K, cerebellum, height of str. granulosum (μM); and L, cerebral cortex, heights of layers 2–6 (μM). M, Number of BrdU-HuC/D-positive cells in dentate gyrus. Density of MBP: N, hippocampus (μM); and O, corpus callosum (μM). Low-power magnification images illustrating Nissl-stained sections: P–S, hippocampus (HC), Q–T, cerebellum (CB), and R–U, cerebral cortex of control and Astro-D2KO animals. Nissl hippocampus, 500 μM; Nissl stained cerebral cortex and cerebellum, 200 μM. Low-power magnification immunofluorescence images illustrating MBP expression: V–X, hippocampus and W–Y, corpus callosum in control and Astro-D2KO animals. Fluor hippocampus and corpus callosum, 200 μM. Values are the mean ± SEM (n = 5–8). **, P < .01, ***, P < .001 as compared with control mice.
The dimensions of the hippocampus (Figure 1, I, P, and S), dentate gyrus (Figure 1, J, P, and S), cerebellum (Figure 1, K, Q, and T), and cerebral cortex (Figure 1, L, R, and U) were similar in Astro-D2KO and control animals. In addition, the number of BrdU-HuC/D-positive newborn neurons in dentate gyrus (Figure 1M) and the density of MBP in the hippocampus (Figure 1, N, V, and X) and corpus callosum (Figure 1, O, W, and Y), as assessed by immunohistochemistry, was not affected as well.
The Astro-D2KO mouse exhibits anxiety-depression-like behavior
Astro-D2KO animals were housed for 7 days in rectangular cages and monitored continuously for ambulatory activity. Ambulatory activity toward the side of the cage containing food/water (x-axis) was similar in both control and Astro-D2KO animals (Figure 2, A–D). However, Astro-D2KO animals exhibited 23%–27% reduction in ambulatory activity during the light and dark periods in other areas of the cage (y-axis; Figure 2, E–H) as well as about 35% reduction in rearing during the dark period (Z-axis; Figure 2, I–L). The analyses of the combined ambulatory activity (x- plus y-axes) indicate that Astro-D2KO animals exhibit less overall activity both in the light and dark segments of the cycle, although this difference was only borderline statistically significant (Supplemental Figure 2, A–C; P = .07). At the same time, when light and day segments were combined, Astro-D2KO animals exhibited about 16% decreased ambulatory activity (Supplemental Figure 2D). The physical distance covered within the first 12 hours of being moved into the cage (Figure 2M) as well as during the whole 7-day period of observation was about 18% less in the Astro-D2KO animals (Figure 2N). In a separate experiment, all animals were allowed to use the free-running wheel for 48 hours. There were no differences between control and Astro-D2KO animals when the accumulated total number of revolutions was compared (Supplemental Figure 3A).
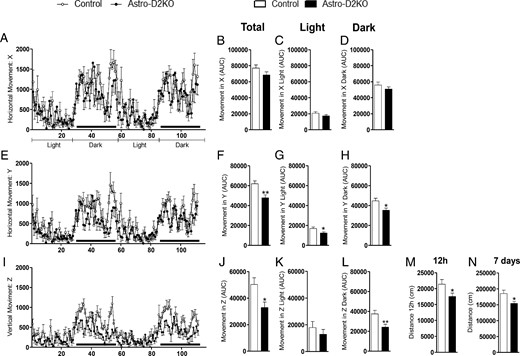
Forty-eight-hour locomotion profile in Astro-D2KO mice. A, Horizontal movement (X) registered for 48 hours during light and dark cycles. B, Area under the curve (AUC) of total X. C, AUC of X during light cycle. D, AUC of X during dark cycle. E, Same as in panel A, except that what is shown is horizontal movement (Y). F, Same as in panel B, except that what is shown is Y. G, Same as in panel C, except that what is shown is Y. H, Same as in panel D, except that what is shown is horizontal movement (Y). I, Same as in panel A, except that what is shown is vertical movement (Z). J, Same as in panel B, except that what is shown is vertical movement (Z). K, Same as in panel C, except that what is shown is vertical movement (Z). L, Same as in panel D, except that what is shown is vertical movement (Z). M, Traveled distance during the initial 12 hours in CLAMS. N, Traveled distance during 7 days in CLAMS. Values are the mean ± SEM (n = 12–13). *, P < .05, **, P < .01 compared with control mice.
The selective reduction in ambulatory activity potentially indicates the presence of mood disorders, which was subsequently tested in a series of behavioral studies. Astro-D2KO mice were first exposed to the open field under conditions of low light intensity, which sets a low emotionality context. The Astro-D2KO animals exhibited an approximately 1.8-fold increase in the number of center entries (Figure 3A) and an approximately 1.3-fold increase in rearing activity (Figure 3B), but no differences in exploratory activity (Figure 3C), time spent in the center field (Figure 3D), freezing (Figure 3E), or grooming (Figure 3F) were detected.
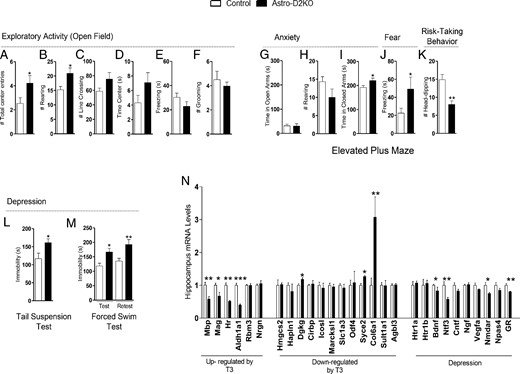
Behavior phenotype and hippocampal gene profile in Astro-D2KO mice. A–M, Behavioral tests. A–F, OFT. A, Total number of center entries. B, Total number of rearing. C, Total number of line crossing. D, Total time in center. E, Total time of freezing. F, Total number of grooming. G–K, EPM. G, Time spent in open arms. H, Total number of rearing. I, Time spent in closed arms. J, Total time of freezing. K, Total number of head dips. L, TST, time of immobility. M, FST, time of immobility. N, Gene profile in hippocampus. mRNA levels of T3-responsive genes and genes related to depression, measured by RT-qPCR and using CycloA as the internal control. Values are the mean ± SEM (n = 8–17). *, P < .05, **, P < .01, ***, P < .001 compared with control mice.
Next, animals were studied in the EPM to assess anxiety. No differences were observed on the time spent in the open arms (Figure 3G), in rearing behavior (Figure 3H), or the number of open arms entries (Supplemental Figure 2E). However, Astro-D2KO animals spent about 15% more time inside the closed arms (Figure 3I), almost doubled the time of freezing behavior (Figure 3J), exhibited approximately 42% less head dipping (Figure 3K), and 32% fewer entries in the closed arms (Supplemental Figure 2F), all results compatible with anxiety. Animals were then tested for depression using the tail-suspension and the forced-swimming tests. The Astro-D2KO animals exhibited 37%–42% more immobility time during both tests (Figure 3, L and M).
Astro-D2KO hippocampus exhibits a distinct transcriptome
An unbiased approach to gene expression in the hippocampus with microarray analysis was used to study changes resulting from astrocyte-specific Dio2 inactivation. Differential expression analysis was used to identify individual genes with significantly different expression between control and Astro-D2KO animals. At a fold change ≥ 1.3 and P < .05, 30 named genes were down-regulated in Astro-D2KO and 43 up-regulated in the Astro-D2KOs (Tables 1 and 2).
Individual Gene Transcripts Down-Regulated in Astro-D2KO Hippocampus
| Gene Symbol | Description | Fold | P Value |
|---|---|---|---|
| Dio2 | Deiodinase, iodothyronine, type II | 2.78 | .000 099 |
| Snord42a | Small nucleolar RNA, C/D box 42A | 1.82 | .036 107 |
| Snord61 | Small nucleolar RNA, C/D box 61 | 1.54 | .005 067 |
| Mir1224 | microRNA 1224; von Willebrand factor A domain containing 5B2 | 1.49 | .033 586 |
| Cyp1b1 | Cytochrome P450, family 1, subfamily b, polypeptide 1 | 1.46 | .033 156 |
| Olfr344 | Olfactory receptor 344 | 1.46 | .035 988 |
| Snord110 | Small nucleolar RNA, C/D box 110 | 1.46 | .013 684 |
| Lum | Lumican | 1.45 | .027 892 |
| Ighv10–1 | Ig heavy variable 10-1 | 1.41 | .021 021 |
| Snord69 | Small nucleolar RNA, C/D box 69 | 1.41 | .013 871 |
| Mir5127 | microRNA 5127 | 1.41 | .039 012 |
| Snord49b | Small nucleolar RNA, C/D box 49B | 1.38 | .026 267 |
| Ddit4 | DNA-damage-inducible transcript 4 | 1.37 | .010 851 |
| Ighj2 | Ig heavy joining 2 | 1.37 | .030 082 |
| Snord55 | Small nucleolar RNA, C/D box 55 | 1.37 | .030 719 |
| Cyp2j6 | Cytochrome P450, family 2, subfamily j, polypeptide 6 | 1.36 | .024 732 |
| Ankrd34c | Ankyrin repeat domain 34C | 1.36 | .023 905 |
| Phlda2 | Pleckstrin homology-like domain, family A, member 2 | 1.35 | .03 254 |
| Rhox3f | Reproductive homeobox 3F | 1.34 | .017 248 |
| Vmn1r120 | Vomeronasal 1 receptor 120 | 1.33 | .025 518 |
| Phf1 | PHD finger protein 1 | 1.32 | .047 541 |
| Myom1 | Myomesin 1 | 1.32 | .004 866 |
| Snord16a | Small nucleolar RNA, C/D box 16A | 1.32 | .011 198 |
| Snord49a | Small nucleolar RNA, C/D box 49A | 1.31 | .045 041 |
| Cyth3 | Cytohesin 3 | 1.31 | .031 086 |
| Tuba3a | Tubulin, α3A; tubulin, α3B | 1.31 | .044 086 |
| Mageb1 | Melanoma antigen, family B, 1; melanoma antigen, family B, 2 | 1.31 | .006 397 |
| Olfr1394 | Olfactory receptor 1394 | 1.3 | .029 162 |
| Lrrc16a | Leucine-rich repeat containing 16A | 1.3 | .046 377 |
| Klf15 | Kruppel-like factor 15 | 1.3 | .037 873 |
Data were analyzed using Affymetrix Transcriptome Analysis Console (Astro-D2KO, n = 4; control, n = 4) at a value of P < .05 and a fold change of 1.3 or greater or −1.3 or less in the differential analysis of the microarray data from Cre vs Astro-D2KO hippocampus.
Individual Gene Transcripts Up-Regulated in Astro-D2KO Hippocampus
| Gene Symbol | Description | Fold | P Value |
|---|---|---|---|
| Olfr1357 | Olfactory receptor 1357 | −1.3 | .028 176 |
| Rem2 | Rad and gem-related GTP binding protein 2 | −1.3 | .017 352 |
| Pnldc1 | Poly(A)-specific ribonuclease (PARN)-like domain containing 1 | −1.3 | .016 117 |
| Dennd4c | DENN/MADD domain containing 4C | −1.3 | .040 588 |
| Vmn1r9 | Vomeronasal 1 receptor 9 | −1.3 | .009 408 |
| Olfr535 | Olfactory receptor 535 | −1.3 | .013 635 |
| St8sia2 | ST8 α-N-acetyl-neuraminide α-2,8-sialyltransferase 2 | −1.3 | .020 501 |
| Fbxw20 | F-box and WD-40 domain protein 20 | −1.3 | .012 337 |
| Slc23a3 | Solute carrier family 23 (nucleobase transporters), member 3 | −1.31 | .007 156 |
| Mettl24 | Methyltransferase like 24 | −1.31 | .018 338 |
| Mir299a | microRNA 299a | −1.31 | .004 738 |
| Dsg4 | Desmoglein 4 | −1.31 | .015 903 |
| Clec4b2 | C-type lectin domain family 4, member b2 | -−.31 | .000 785 |
| Olfr593 | Olfactory receptor 593 | −1.31 | .026 543 |
| Obp1b | Odorant binding protein IB | −1.31 | .033 234 |
| Vsig8 | V-set and immunoglobulin domain containing 8 | −1.32 | .002 538 |
| Kremen1 | Kringle containing transmembrane protein 1 | −1.32 | .023 628 |
| Xlr3a | X-linked lymphocyte-regulated 3A | −1.32 | .001 963 |
| Lipg | Lipase, endothelial | −1.33 | .007 975 |
| Kir3dl1 | Killer cell Ig-like receptor, three domains, long cytoplasmic tail, 1 | −1.33 | .004 548 |
| Dydc2 | DPY30 domain containing 2 | −1.34 | .001 918 |
| Mir1971 | microRNA 1971 | −1.34 | .007 016 |
| Mir376a | microRNA 376a | −1.35 | .014 988 |
| Tmem159 | Transmembrane protein 159 | −1.35 | .036 371 |
| Tagap1 | T-cell activation GTPase activating protein 1 | −1.36 | .022 869 |
| Tex26 | Testis expressed 26 | −1.36 | .009 946 |
| Mir153 | microRNA 153 | −1.38 | .000 707 |
| Sprr1b | Small proline-rich protein 1B | −1.39 | .002 066 |
| Tas2r136 | Taste receptor, type 2, member 136 | −1.4 | .046 515 |
| Olfr853 | Olfactory receptor 853 | −1.4 | .01 169 |
| Naip6 | NLR family, apoptosis inhibitory protein 6; NLR family, apoptosis inhibitory protein 7 | −1.43 | .047 367 |
| mt-Ts2 | Mitochondrially encoded tRNA serine 2 | −1.43 | .014 508 |
| Mir1955 | microRNA 1955 | −1.44 | .010 293 |
| Olfr591 | Olfactory receptor 591 | −1.45 | .020 531 |
| Olfr811 | Olfactory receptor 811 | −1.5 | .007 783 |
| Orm3 | Orosomucoid 3 | −1.51 | .013 175 |
| Igk-V28 | Ig κ-chain variable 28 (V28) | −1.51 | .010 163 |
| LOC101055855 | Keratin-associated protein 5-5-like | −1.53 | .003 359 |
| Tspan18 | Tetraspanin 18 | −1.54 | .031 571 |
| Mir1969 | microRNA 1969 | −1.56 | .016 284 |
| mt-Ts2 | Mitochondrially encoded tRNA serine 2; mitochondrially encoded tRNA leucine 2 | −1.58 | .010 638 |
| Serinc2 | Serine incorporator 2 | −1.71 | .00 931 |
| Gpr115 | G protein-coupled receptor 115 | −2 | .039 619 |
Data are analyzed as in Table 1.
To assess the physiological context of the transcriptional changes that occur in the Astro-D2KO hippocampus, the microarray data were then analyzed by gene ontology to identify gene sets demonstrating enrichment at a nominal < 1%. GSEA revealed three gene sets down-regulated in Astro-D2KO animals (mitochondrial function, ubiquitination, and response to oxidative stress) and three gene sets up-regulated in Astro-D2KO animals (integrin complex, receptor complex, and protein heterodimerization activity) (Table 3).
Gene Ontology Sets Enriched in the Comparison of Expression Data Between Cre Versus Astro-D2KO Hippocampus Samples
| Gene Ontology | Description | Genes Enriched in Our Samples, n | Total Genes in Set, n | ES | NES | Nominal P Value |
|---|---|---|---|---|---|---|
| n | Down-regulated in Astro-D2KO | |||||
| 0015078 | Hydrogen ion transmembrane transporter activity | 11 | 25 | 0.51 | 1.58 | <.01 |
| 0016881 | Acid amino acid ligase activity | 20 | 54 | 0.33 | 1.55 | <.01 |
| 0006979 | Response to oxidative stress | 12 | 41 | 0.35 | 1.4 | <.01 |
| n | Up-regulated in Astro-D2KO | |||||
| 0008305 | Integrin complex | 9 | 18 | −0.69 | −1.58 | <.01 |
| 0043235 | Receptor complex | 22 | 53 | −0.63 | −1.53 | <.01 |
| 0046982 | Protein heterodimerization activity | 16 | 73 | −0.45 | −1.53 | <.01 |
Abbreviations: ES, enrichment score; NES, normalize enrichment score. All gene sets were significantly enriched or impoverished at a nominal value of P < 1.
Given that the Astro-D2KO brain transcriptome was only minimally affected as assessed in the microarray studies, we next used the more sensitive RT-qPCR to measure mRNA levels of candidate genes, starting with known T3-responsive genes. Accordingly, the expression of four of six positively regulated genes by T3 were found to be down-regulated in the Astro-D2KO, ie, Mbp (∼43%), Mag (∼34%), Hr (∼49%), and Aldh1a1 (∼61%) (Figure 3N), whereas the expression of 3 of the 12 negatively regulated genes by T3 were found to be up-regulated in the Astro-D2KO animals, ie, Dgkg (∼17%), Syce2 (∼26%), and Col6a1 (∼3-fold) (Figure 3N). Next we looked at the expression of genes that are known to be affected in classical animal models of depression. Notably, there was a reduction in the mRNA levels of Bdnf (∼18%), Ntf3 (∼43%), Nmdar (∼26%), and GR (∼20%) (Figure 3N).
Physical exercise rescues phenotype and hippocampal gene expression in Astro-D2KO mice
Regular exercise is known for improving depression and anxiety in rodents (26, 27). To test whether this would also be the case in the Astro-D2KO animals, animals underwent 4 weeks of regular physical activity on a treadmill for 30 minutes. At the end of the exercise period, the animals were tested as before and the differences previously observed between Astro-D2KO and control animals in the OFT (Figure 4, A–F) as well as in the EPM (Figure 4, G–K), TST (Figure 4L), and FST (Figure 4M) were eliminated.
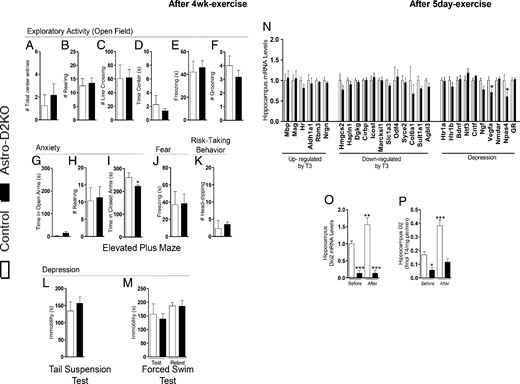
Behavior phenotype and hippocampal gene profile in Astro-D2KO mice after treadmill exercise. A–M, Behavioral tests after 4 weeks of running exercise on treadmill. A–F, OFT. A, Total number of center entries. B, Total number of rearing. C, Total number of line crossing. D, Total time in center. E, Total time of freezing. F, Total number of grooming. G–K, EPM. G, Time spent in open arms. H, Total number of rearing. I, Time spent in closed arms. J, Total time of freezing. K, Total number of head-dips. L, TST, time of immobility. M, FST, time of immobility. N–P, Astro-D2KO after treadmill exercise for 5 days. N, mRNA levels of T3 responsive genes and genes related to depression in hippocampus. O, Dio2 mRNA levels in hippocampus, before and after exercise, measured by RT-qPCR and using CycloA as the internal control. P, D2 activity in hippocampus, before and after exercise. Values are the mean ± SEM (n = 3–6). *, P < .05, ***, P < .001 compared with control mice.
In addition, only 5 days of daily exercises at 60% of Smax was sufficient to promote changes in gene expression in the hippocampus (Supplemental Figure 3C) and eliminate the hippocampal differences in mRNA levels between control and Astro-D2KO animals (Figure 4N). Notably, Vegfa and Npas4 mRNA levels decreased in Astro-D2KO animals when compared with controls after exercise (Figure 4N). Unexpectedly, hippocampal Dio2 mRNA and D2 activity increased by approximately 1.5- and 2.4-fold after daily exercises, respectively (Figure 4, O and P).
Discussion
The present studies reveal that astrocyte-specific Dio2 inactivation, which does not affect circulating T3 levels, results in a phenotype of mood dysfunction characterized by depression/anxiety-like behavior and reduced hippocampal expression of Bdnf, Ntf3, Nmdar, and GR (Figure 3N), known markers of depression in other animal models. This is likely to stem from changes in hippocampal gene expression that include diminished thyroid hormone signaling (Figure 3N), mitochondrial function, and response to oxidative stress (Table 3). Gene set analyses also indicate enrichment in genes related to immune response and inflammation (Table 3). Remarkably, daily sessions of treadmill exercise eliminated the anxiety-depression-like Astro-D2KO phenotype (Figure 4, A–M) as well as differences in hippocampal expression of depression markers (Figure 4N). In addition, physical exercise also normalized the expression of the T3-responsive genes in the Astro-D2KO hippocampus (Figure 4N). Given that greater than 90% of brain Dio2 was inactivated in the Astro-D2KO animals, it is conceivable that the normalization of gene expression by physical exercise indicates that nonthyroid-related stimuli can influence the expression T3-responsive genes.
Depression-anxiety-like behavior is typically seen in systemically hypothyroid mice and in humans (28); it has also been reported in TR-α1 knockout mice (22, 29, 30). In all cases this is the result of decreased thyroid hormone action in the brain. Here we defined that brain hypothyroidism resulting from astrocyte-specific Dio2 disruption is also associated with depressive behavior. This was first suspected in the analysis of 24-hour ambulatory profiles later confirmed by standard tests such as the TST (Figure 3L) and FST (Figure 3M). In addition, results obtained in the EPM (Figure 3, G–K) revealed anxiety-like behavior, with the Astro-D2KO animals spending more time in the closed arms of the maze (Figure 3I), more freezing time (Figure 3J), and less head dips (Figure 3K). Notably, the OFT (Figure 3, A–F) revealed no indication of increased emotionality, which could be explained by differences in its emotional context: the OFT was performed under low luminosity, which triggers exploration of the new environment. In contrast, the EPM is a test with high emotionality, which normally triggers an underlining anxiety behavior.
Reduced locomotor activity is a known confounder in interpreting behavioral tests of anxiety-like and depressive-like behavior. For example, reduced entries into open arms, reduced struggling, or reduced swimming might be explained just by reduced locomotor activity. However, the data indicate otherwise: the reduction in ambulatory movements of the Astro-D2KO animals was selective, ie, only in the Y but not the X component (Figure 2, A–H); in addition, the Astro-D2KO animals performed similarly as the control animals in the following: 1) the Smax and the 5-day treadmill sessions (Supplemental Figure 3B); 2) the total number of entries in the open arms of the EPM (the reduction in the number of entries in the closed arms is because the residence time inside the closed arms was longer; Supplemental Figure 2E-F); and 3) in the 48-hour accumulated number of revolutions in the free-running wheel (Supplemental Figure 3A). All of these factors suggest the unlikelihood that the reduced locomotor activity in Astro-D2KO animals, as assessed through ambulatory movement in the CLAMS (Figure 2), influenced the behaviors observed in the formal tests of anxiety-like and depressive-like behavior (Figure 3).
In other mouse models of brain hypothyroidism, the mechanism leading to depression seems to involve decreased T3 signaling in the hippocampus, which reportedly leads to impaired neurogenesis (31). Even though neurogenesis was unaffected in the Astro-D2KO hippocampus (Figure 1M), the altered expression of T3-responsive genes (Figure 3N) supports diminished thyroid hormone signaling after Dio2 disruption. This explains the present findings of depression/anxiety-like behavior in the Astro-D2KO.
Overall, the changes in gene expression observed in the Astro-D2KO hippocampus were not dramatic. The reduction in mitochondrial genes observed in the GSEA of Astro-D2KO hippocampus is reminiscent of the well-known metabolic effects of T3, which could also justify the decreased expression in genes involved in response to oxidative stress (Table 3). An unexpected finding, however, was the observation of multiple genes related to inflammation and immune response in the three gene sets enriched in the Astro-D2KO hippocampus (Table 3). It is unclear at the moment how dampening thyroid hormone signaling in the hippocampus results in such changes in transcriptome. Nonetheless, it is well known that central nervous system (CNS) inflammation underlies depression models (32), which could be a contributing factor in the depression-anxiety-like behavior observed in the Astro-D2KO mouse.
It is remarkable that repeated exercise sessions eliminated the mood dysfunction (depression/anxiety-like behavior) and alterations in hippocampal gene expression (Figure 4N). In fact, treadmill exercise ameliorates symptoms of hypothyroidism through enhanced neurogenesis (33). In the case of depression, the efficacy of exercise is well known, and it has been classically attributed to changes in neurotransmitter metabolism, neurotrophic factors, and/or neuroinflammation (34–37). Along these lines, it is notable that Dio2 expression in the hippocampus increases with exercise sessions in the control animals (Figure 4, O and P), whereas the serum T3 and T4 levels remained stable (23); this could theoretically be an adjuvant mechanism through which exercise improves depression. However, exercise was very effective in correcting depression in the Astro-D2KO animals, suggesting that Dio2 activation probably plays only a minor role if any in this process.
Absence of D2-mediated T3 production in different development organs underlies permanent defects that are carried through adulthood such as in the inner ear (38), brown adipose tissue (39), and liver (40). Given that the developing brain also expresses Dio2, a major CNS phenotype in the Astro-D2KO animals would be expected, especially given that congenital hypothyroidism in animal models and humans is associated with brain structural abnormality (41), diminished number of cells in granular layers of the hippocampus and cerebellum (41), and delayed/poor myelinization (42, 43). Thus, it is indeed notable that the global-D2KO mouse lacks a major CNS phenotype, exhibiting only agility impairment (7), and the Astro-D2KO exhibits a reversible mood dysfunction phenotype (Figure 4, A–M). In fact, Astro-D2KO animals exhibit normal morphology as seen in the hippocampus, dentate gyrus, cerebellum, and cerebral cortex (Figure 1, I—L and P–U). Neurogenesis is unaffected in the dentate gyrus (Figure 1M), and myelin density in the hippocampus and corpus callosum is normal (Figure 1, N–O, and V–Y). Thus, it is conceivable that the early D2 inactivation in the global-D2KO or Astro-D2KO animals sets off compensatory mechanisms that obviate the role played by D2 in the adult CNS.
Previous studies suggest that deiodination in the brain might play a role in mood disorders. For example, administration of antidepressants increases D2 activity in the rodent brain (44, 45). At the same time, a mouse that is resistant to stress-induced depression exhibits increased hippocampal expression of Dio2 and Dio3 (46). In contrast, a mouse with global inactivation of Dio3 exhibits aggressive behavior and indifference toward pups due to brain thyrotoxicosis (14). Clinical studies are unfortunately limited to patients with hypo- or hyperthyroidism, with the former exhibiting variable degrees of cognitive dysfunction, depression, and mood disorders (47). Indeed, the use of magnetic resonance imaging spectroscopy and positron emission tomography has confirmed that thyroid hormones act in the human limbic system (48); they also potentiate the efficacy of antidepressant agents when given to euthyroid individuals (49). A potential clinical role played by deiodinases is much less clear. Whereas mutations that interfere with the D2 pathway have not been identified, a prevalent single-nucleotide polymorphism in the Dio2 gene (Thr92AlaD2) that is present in 12%–36% of individuals in the general population has been associated with mental and psychological disorders, such as mental retardation, bipolar disorder, and low intelligence quotient (47). The Thr92AlaD2 polymorphism is also associated with a preference for levothyroxine plus liothyronine combination therapy vs levothyroxine monotherapy among carriers with hypothyroidism (50).
In summary, studies in mice with astrocyte-specific Dio2 inactivation suggest a role played by D2 in thyroid hormone signaling in the brain, the disruption of which leads to a mood/behavior phenotype. The data highlight that potential defects in the D2 pathway might have clinical relevance; possibly constituting a risk factor for mood or behavioral disorders. The finding that physical exercise reverts the Astro-D2KO phenotype is exciting, opening the fascinating possibility that physical exercise could be used to improve mood disorders in hypothyroid patients.
Appendix
See Table 4.
Antibody Table
| Target | Name | Manufacturer, Catalog Number | Species Raised (Monoclonal, Polyclonal), Dilution |
|---|---|---|---|
| Human MBP | Anti-MBP | Merck-Millipore, AB980 | Rabbit polyclonal, 1:250 |
| BrdU | Anti-BrdU | Abcam, Ab1893 | Sheep polyclonal, 1:300 |
| Anti HuC + HuD neuronal protein | Life Technologies/ThermoFisher Scientific | ||
| Human HuC/HuD | Antibody, biotin conjugate | A-21272 | Mouse monoclonal, 1:300 |
Acknowledgments
We thank Dr Mary-Elizabeth Patti from the Joslin Diabetes Center (Boston, Massachusetts) for processing the microarray samples and Dr Kalipada Pahan for assisting with the open field test.
The funding agencies had no role in the study design, data collection and analysis, decision to publish, or preparation of the manuscript.
This work was supported by National Institute of Diabetes and Digestive and Kidney Diseases Grant R01 65055 (to A.C.B.), the Hungarian Brain Research Program Grant NAP A I/3-4 (to B.G., C.F.), a Coordination for the Improvement of Higher Education Personnel Grant, Coordination for the Improvement of Higher Education Personnel (CAPES), Brazil (to M.O.R., B.M.L.C.B.).
Disclosure Summary: The authors have nothing to disclose.
Abbreviations
- Astro-D2KO
inactivation of Dio2 in astrocytes
- BrdU
5-bromo-2′-deoxyuridine
- CLAMS
comprehensive lab animal monitoring system
- CNS
central nervous system
- CycloA
cyclophilin A
- D2
type 2 deiodinase
- D3
type 3 deiodinase
- EPM
elevated plus maze
- FDR
false discovery rate
- FST
forced swim test
- global-D2KO
global inactivation of the Dio2 gene
- GSEA
Gene Set Enrichment Analysis
- MBP
myelin basic protein
- Mct8
monocarboxylate transporter 8
- Oatp
organic anion-transporting polypeptide
- OFT
open field test
- RT-qPCR
quantitative real-time PCR
- Smax
maximum speed
- TR
thyroid hormone receptor
- TST
tail-suspension test.
