


CRH neurons in the hypothalamic paraventricular nucleus (PVN) play a central role in regulating the hypothalamus-pituitary-adrenal (HPA) axis and are directly influenced by 17β-estradiol (E2). Although compelling evidence has suggested the existence of membrane-associated estrogen receptors (mERs) in hypothalamic and other central nervous system neurons, it remains unknown whether E2 impacts CRH neuronal excitability through this mechanism. The purpose of the current study is to examine the existence and function of mER signaling in PVN CRH neurons. Whole-cell recordings were made from CRH neurons identified by Alexa Fluor 594 labeling and post hoc immunostaining in ovariectomized female mice. E2 (100nM) rapidly suppressed the M-current (a voltage-dependent K+ current) and potentiated glutamatergic excitatory postsynaptic currents. The putative Gq-coupled mER (Gq-mER) characterized in hypothalamic proopiomelanocortin neurons initiates a phospholipase C-protein kinase C-protein kinase A pathway; therefore, we examined the involvement of this pathway using selective inhibitors. Indeed, the ER antagonist ICI 182780 and inhibitors of Gq-phospholipase C-protein kinase C-protein kinase A blocked E2's actions, suggesting dependence on the Gq-mER. Furthermore, STX, a selective ligand for the Gq-mER, mimicked E2's actions. Finally, to examine the in vivo effect of Gq-mER activation, E2 or STX injection increased c-fos expression in CRH neurons in the PVN, suggesting CRH neuronal activation. This corresponded to an increase in plasma corticosterone. We conclude that the Gq-mER plays a critical role in the rapid regulation of CRH neuronal activity and the HPA axis. Our findings provide a potential underlying mechanism for E2's involvement in the pathophysiology of HPA-associated mood disorders.
Hyperactivity of the neuroendocrine stress axis, the hypothalamus-pituitary-adrenal (HPA) axis (1), is a key phenomenon in depressive disorders (2). Produced by parvocellular neurons in the hypothalamic paraventricular nucleus (PVN), CRH acts as the driving force of HPA axis activation (3). Importantly, the sex hormone 17β-estradiol (E2) plays a key role in regulating hypothalamic CRH expression and HPA axis activity (4, 5). Moreover, the existence of estrogen-responsive elements in the CRH gene promoter region provides evidence for direct estrogenic regulation of CRH expression (6).
Until now, most studies investigating estrogenic regulation of CRH focused on gene expression (4, 7). Little evidence is available regarding as to whether E2 can directly regulate cellular excitability of CRH neurons. The rapid regulation of neuronal excitability by E2 in the central nervous system has been extensively studied (8–14). Electrophysiological evidence has further characterized membrane-initiated E2 signaling (15, 16). For example, a putative Gq-coupled, membrane-associated estrogen receptor (Gq-mER) identified in hypothalamic proopiomelanocortin (POMC) neurons rapidly activates a phospholipase C (PLC)-protein kinase C (PKC)-protein kinase A (PKA) signaling cascade (17, 18). Activation by STX, a selective ligand of the Gq-mER, has been reported to control arcuate nucleus gene expression, energy metabolism, thermoregulation, and bone remodeling (19, 20).
A potential target for the Gq-mER is the neuronal M-current (KCNQ/Kv7 channels), a subthreshold, noninactivating, voltage-dependent outward K+ current that controls action potential generation and neuronal excitability (21–23). The M-current is a target of numerous neurotransmitters with Gq-coupled G protein-coupled receptors, including serotonin and acetylcholine (24, 25). Suppression of the M-current allows neurons to fire more rapidly (22) and increases cellular responses to excitatory synaptic inputs (26). E2 has been found to regulate KCNQ2/3 channels in PC-12 cells (27) and KCNQ5 channels (and the M-current) in neuropeptide Y neurons (28). Therefore, we hypothesize that E2 could directly regulate the M-current in PVN CRH neurons. Moreover, CRH neurons in the PVN receive multiple excitatory synaptic inputs (29, 30), which increase their activity and release of CRH into the pituitary portal circulation. Elevated excitatory innervation of parvocellular neurons may predict HPA axis activation (31). Recently, E2 was found to potentiate glutamatergic synaptic transmission in the hippocampus through distinct receptor subtype (ERα, ERβ, G protein-coupled estrogen receptor 1 (GPER1))-mediated mechanisms in a sex-dependent manner (12). However, no study has examined the effects of E2 on the excitatory postsynaptic current (EPSC) in PVN CRH neurons.
To address these questions, in the present study, we performed electrophysiological recordings in PVN CRH neurons and studied the direct regulatory effects of E2. We examined whether 1) the excitability of CRH neurons could be subjected to a rapid modulation by E2, and 2) whether this modulation is mediated by the Gq-mER pathway similar to that characterized in arcuate POMC neurons (17, 18). Indeed, our data suggest that activation of Gq-mER by E2 or STX rapidly suppresses the M-current and enhances glutamatergic neurotransmission in PVN CRH neurons through the Gq-coupled PLC-PKC-PKA signaling pathway.
Materials and Methods
Animals and treatments
All animal procedures are in accordance with institutional guidelines based on National Institutes of Health standards and approved by the Rutgers Institutional Animal Care and Use Committee. All mice used were adult female mice (6–8 wk of age). Wild-type (WT) C57BL/6 mice (The Jackson Laboratory) were bred in-house. Ex3a ERα knockout (ERα KO) mice, recently developed by Dr Ken Korach (NIEHS) (32), were generated from breeding pairs of heterozygous WT/KO. Weanlings were genotyped as previously described (33). All animals were housed with littermates and maintained under controlled temperature (22°C) and photoperiod conditions (12-h light, 12-h dark cycle; lights on between 6 am and 6 pm) with a low-phytoestrogen chow (5V75; Lab Diets) and water ad libitum. They were ovariectomized (ovx) under isoflurane anesthesia and allowed to recover for 1 week before electrophysiology. Ovx females were provided with pain relief for 48 hours after surgery by a daily injection of carprofen (4 mg/kg, Rimadyl)
Drugs
All drugs were purchased from Tocris unless otherwise specified. Tetrodotoxin (TTX) was dissolved in ultrapure H2O (1mM stock); pH 4–5. E2 (Steraloids) and the ER antagonist ICI 182780 (ICI) were dissolved in dimethyl sulfoxide (DMSO) (1mM and 10mM stock, respectively). 2-(4-hydroxyphenyl)-3-phenylpent-2-enoic acid 4-(2-dimethylaminoethoxy)phenylamide (E-enantiomer) (STX), the Gq-mER-selective ligand, was produced by AAPharmaSyn (34) and provided as a gift from Dr Martin J. Kelly and Dr Oline K. Rønnekleiv (Oregon Health & Science University). STX was dissolved in DMSO (1mM stock). 10, 10-bis(4-pyridinylmethyl)-9(10h)-anthracenone dihydrochloride (XE991), a KCNQ channel blocker, was dissolved in ultrapure H2O (1mM stock). The PKA inhibitor H-89 dihydrochloride (10mM stock), the PKA activator forskolin (50mM stock), the PKC inhibitor rottlerin (10mM stock), the PLC inhibitor U73122 (20mM stock) and its inactive analog U73343, and the ERβ agonist diarylpropionitrile (DPN) (1mM stock) were all dissolved in DMSO. The nonhydrolyzable GDP analog guanosine 5′-[β-thio]diphosphate trilithium salt (GDP-β-S-Li3) (Sigma-Aldrich), which was used to prevent G protein-mediated signaling, was dissolved in H2O and applied in the final concentration (2mM) through patch pipette immediately before use (35). Aliquots of the stock solutions were stored at −20°C until needed. Picrotoxin (PTX) (50mM stock; Sigma-Aldrich) as well as 6-cyano-7-nitroquinoxaline-2,3-dione disodium (CNQX) disodium salt (20mM stock) and D-2-amino-5-phosphonovalerate (D-APV) (50mM stock) were dissolved in ultrapure H2O.
Tissue preparation
Slices were prepared as described previously. Mice were decapitated quickly at 10–11 am. The brain was rapidly removed from the skull, and a block containing the hypothalamus was immediately dissected and submerged in cold (4°C), oxygenated (95% O2, 5% CO2), high-sucrose artificial cerebrospinal fluid (aCSF) consisting of 208mM sucrose, 2mM KCl, 26mM NaHCO3, 10mM glucose, 1.25mM NaH2PO4, 2mM MgSO4, 1mM MgCl2, and 1mM HEPES (pH 7.3; 300 mOsm). Coronal slices (250 μm) were cut on a vibratome at 4°C. The slices were transferred to an auxiliary chamber where they were kept at room temperature (25°C) in aCSF consisting of 124mM NaCl, 5mM KCl, 2.6mM NaH2PO4, 2mM MgCl2, 2mM CaCl2, 26mM NaHCO3, and 10mM glucose (pH 7.3; 310 mOsm) until recording (recovery for 1–2 h). A single slice was transferred to the recording chamber mounted on an Olympus BX51W1 upright microscope. The slice was continually perfused with warm (35°C), oxygenated aCSF at 1.5 mL/min. Targeted neurons were viewed with an Olympus ×40 water-immersion lens.
Electrophysiological recordings
Electrophysiology was performed as described previously (28). In hypothalamic slices, standard whole-cell patch recording procedures and pharmacological testing were used. Whole-cell voltage-clamp recordings were performed using pipettes made of borosilicate glass and pulled using a P-97 Flaming/Brown Micropipette Puller (Sutter Instrument). An Axopatch 700B amplifier, Digidata 1322A Data Acquisition System, and pCLAMP software (version 10.2; Molecular Devices) were used for data acquisition and analysis.
CRH neurons were identified based on a combination of anatomical, morphological, and immunohistochemical criteria: 1) anatomical criterion: the location of the parvocellular neurons in the PVN (dorsal portion of the medial parvocellular division [mpd] region, between the third ventricle and lateral cluster of large neurons) (36, 37); and 2) morphological criterion: small and usually fusiform somata (38–40). Confirmation of a CRH phenotype was conducted using post hoc histological identification. The recorded neurons were first labeled with Alexa Fluor 594 via recording patch clamp (added intracellularly 0.1% in the internal solution; Life Technologies) and then identified by post hoc immunohistochemical analysis. Sections were fixed with 4% paraformaldehyde (Sigma-Aldrich) overnight at 4°C. Immunohistochemistry was performed with anti-CRH primary antibody (rabbit, 1:1000; Abcam) and goat-antirabbit Alexa Fluor 633 secondary antibody (1:1000; Life Technologies) (40, 41). Only the identified CRH+ neurons were subsequently analyzed.
Current-voltage (I-V) plots were constructed by voltage steps from −50 to −140 mV at 10-mV increments applied at 1-second intervals from a holding potential of −60 mV. The input resistance (Rin) was determined from the slope of each I-V plot in the range between −60 and −80 mV. Input resistance, series resistance, and membrane capacitance were monitored throughout the experiments. Only cells with stable series resistance (<30 MΩ; <20% change over the course of the recording) and input resistance (>500 MΩ) were used for analysis.
To record M-currents, pipettes (3- to 5-MΩ resistance) were filled with an internal solution containing 10mM NaCl, 128mM K-gluconate, 1mM MgCl2, 10mM HEPES, 1mM ATP, 1.1mM EGTA, and 0.25mM GTP (pH 7.3; 300 mOsm). In voltage clamp, a standard deactivation protocol (24, 28) was used to measure K+ currents elicited during 500-millisecond voltage steps from −30 to −75 mV in 5-mV increments after a 300-millisecond prepulse to −20 mV. The amplitude of the M-current relaxation or deactivation was measured as the difference between initial (<10 ms) and sustained current (>475 ms) of the current trace in the control conditions (1μM TTX; 5 min). After baseline recording (∼5 min), E2 or STX (100nM both with 1μM TTX) (17, 18) was perfused for 10 minutes, and the protocol was repeated and followed by perfusion of the KCNQ channel blocker, XE991 (40μM with 1μM TTX) (24). Deactivation protocol was repeated twice for each perfusion condition and averaged for analysis.
To study synaptic transmission in CRH neurons, pharmacologically isolated spontaneous EPSC (sEPSC) or miniature EPSC (mEPSC) were performed at a holding potential of −60 mV (42). PTX (50μM) was added to block inhibitory synaptic transmission mediated by γ-aminobutyric acid A receptors, and the N-methyl-D-aspartate receptor antagonist D-APV (50μM) was added to block currents mediated by N-methyl-D-aspartate receptors. To record mEPSC, TTX (1μM) was added to block action potential in addition to PTX and D-APV. The internal solution contained 40mM CsCl, 10mM HEPES, 0.05mM EGTA, 1.8mM NaCl, 3.5mM KCl, 1.7mM MgCl2, 2mM Mg-ATP, 0.4mM Na4-GTP, 10mM phosphocreatine, and 5mM N-(2,6-Dimethylphenylcarbamoylmethyl)triethylammonium(pH 7.3; 280–290 mOsm). After a stable baseline measurement of an approximately 5-minute period (control condition), E2 or STX was perfused in the bath with the slice for approximately 10 minutes. The sEPSC/mEPSC properties recorded during final 5 minutes of the E2- or STX-perfusion period were compared with the properties recorded in the 5-minute time window of the control condition.
Acute effect of E2 and STX in vivo
For the acute experiment, 12 mice were assigned to a control (n = 4), E2 (n = 4), or STX (n = 4) group. Each group was given an acute sc injection of vehicle control (50-μL DMSO), E2 (estradiol benzoate, 1 μg in 50-μL DMSO), or STX (500 μg in 50-μL DMSO) (43), respectively. All animals were injected and then perfused 30 minutes later.
Plasma corticosterone (CORT) assay
Cardiac blood samples were collected between 9–11 am in heparin-coated tubes during perfusion, immediately chilled on ice, and centrifuged at 4000 revolutions per minute for 15 minutes at 4°C. Plasma was stored at −80°C for measuring plasma CORT using an ImmuChem Double Antibody Corticosterone RIA kit (MP Biomedicals).
Brain tissue, immunofluorescence, and image acquisition
All animals were anesthetized in the morning (9–11 am) with ketamine (100 mg/kg)/xylazine (10 mg/kg) in their individual cages. They were perfused transcardially with saline followed by 4% paraformaldehyde. Brains were cut into 40-μm-thick sections. Immunohistochemical staining of c-fos and CRH was performed in sections collected along the rostrocaudal axis throughout the PVN (bregma, −0.58 to −1.22 mm), with primary antibodies of anti-CRH (rabbit, 1:1000; Abcam) and anti-c-fos (mouse, 1:1000; Santa Cruz Biotechnology, Inc) incubation overnight at 4°C. The following day, sections were incubated for 2 hours in goat-antirabbit Alexa Fluor 546 or goat-antimouse Alexa Fluor 633 secondary antibodies (both 1:1000; Life Technologies) at room temperature. After washing, they were embedded in Vectashield (Vector Laboratories) for confocal imaging using an LSM-700 confocal microscope (Zeiss). The c-fos+/CRH+ double-labeled cells in the PVN were counted by ImageJ software (NIH).
Data analysis
Comparisons of the I-V plots between control and subsequent drug conditions were performed at each voltage (−30 to −75 mV) using a repeated-measures two-way ANOVA with post hoc Newman-Keuls comparisons. Maximum current at −35 mV was analyzed with paired Student's t test. For sEPSC and mEPSC recordings, amplitude and frequency of currents were analyzed off-line using the Mini Analysis software (Synaptosoft). Comparisons of the amplitude of sEPSC and mEPSC between the control condition and subsequent drug conditions were performed using paired Student's t tests. Comparisons of the c-fos+/CRH+ double-labeled cells in the PVN and plasma CORT concentration between the control and E2 or STX conditions were performed using a one-way ANOVA with post hoc Newman-Keuls comparison. All statistical analysis was conducted using GraphPad Prism (GraphPad). Data were considered significant when P < .05. All data values were presented as mean ± SEM. The each n represents the number of cells examined.
Results
Identification of recorded CRH neurons in the hypothalamic PVN
To identify individual PVN CRH neurons after recording, a combination of anatomical, morphological, and immunohistochemical criteria was applied. Figure 1A shows a schematic representation of the mouse PVN, highlighting the location of putative neuroendocrine CRH neurons in the mpd region. Because CRH neurons are thought to be located mainly in the mpd region (40, 44), which is enriched with parvocellular cells (36), we first applied the following criteria before recording: 1) only cells within the mpd region were considered; and 2) within the mpd, we selected cells with small and fusiform somata (38). Using these anatomical and morphological criteria, the qualified neurons were identified as putative parvocellular neurons (36–38). Confirmation of CRH+ cells was done by filling recorded cells with Alexa Fluor 594 dye, which was in the internal solution, followed by post hoc immunohistochemical analysis using the CRH antibody. Only cells that were confirmed after validation of their CRH-immunopositive profile were analyzed. An example of a typical CRH neuron is shown in yellow color (Figure 1B) designated by an arrow. The overall success rate at patching CRH neurons was approximately 40%.
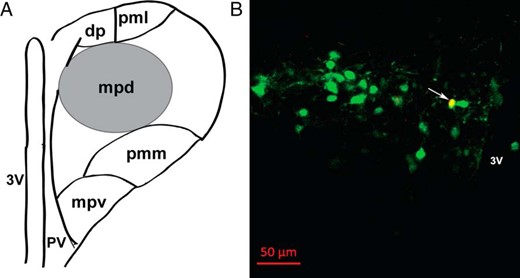
Identification of recorded CRH neurons in hypothalamic paraventricular nucleus (PVN) region. A, Schematic representation of the mouse PVN, highlighting the anatomical location of putative neuroendocrine CRH neurons in the mpd region (black circle), located between the third ventricle and lateral cluster of large neurons. B, Confirmation of the neurochemical profile of recorded CRH neurons after patch clamp recording by intracellular dye labeling (Alexa Fluor 594, added 0.1% intracellularly into internal solution) followed by immunohistochemical analysis. A representative image is shown as an example (yellow; see arrow) of an identified CRH-immunopositive (Alexa Fluor 633, green) neuron in the PVN region of a coronal mouse brain slice, with its recorded location labeled with Alexa Fluor 594 (red). Scale bar, 50 μm. Abbreviations: dp, dorsal parvocellular division; mpd, dorsal portion of the medial parvocellular division; mpv, ventral portion of the medial parvocellular division; pmm, medial portion of posterior magnocellular division; pml, lateral portion of posterior magnocellular division; pv, periventricular parvocellular division; 3V, third ventricle.
E2 and STX rapidly suppresses the M-current in PVN CRH neurons
First, we sought to determine the role of the M-current in modulating CRH neuronal excitability. Under current clamp, the firing activity of CRH neurons was continuously monitored under control conditions with XE991 (40μM), a selective blocker of KCNQ channels (Figure 2A). After bath perfusion of approximately 3 minutes, XE991 application induced action potentials. After ∼7 minutes, robust firing bursts were observed, suggesting significant activation of the recorded neurons.
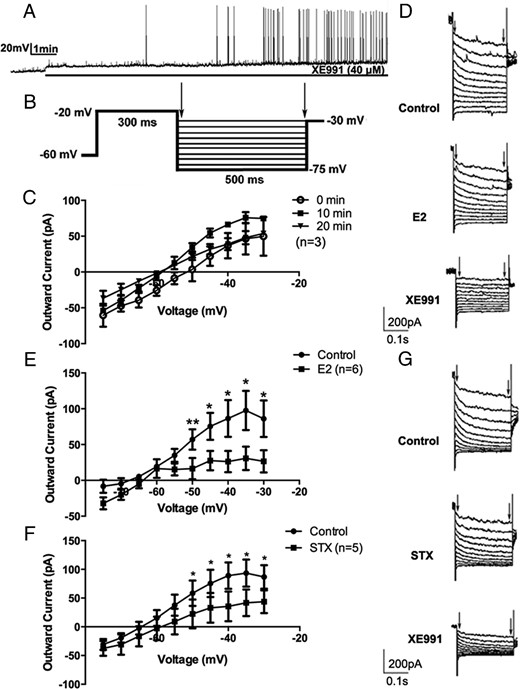
17β-estradiol (E2) and STX rapidly suppressed the M-current in recorded PVN CRH neurons. A, An example of continuous firing activity in a recorded CRH+ neuron during perfusion of selective KCNQ channel blocker XE991 (40μM) for 10 minutes. B, The deactivation protocol used to record the M-current in CRH neurons: from a holding potential of −60 mV, a voltage jump to −20 mV (300 ms) was followed by steps from −30 to −75 mV in 5-mV increments (500 ms). C, No M-current rundown was observed over a 20-minute duration (n = 3). D, Example of M-current traces under control conditions (control) and after perfusion with E2 (10 min, 100nM) and subsequent perfusion with XE991 (10 min, 40μM). E, I-V plot of M-current from −75 to −30 mV under control conditions compared with after bath perfusion with E2 (10 min, 100nM, n = 6). F, I-V plot of M-current from −75 to −30 mV under control conditions and after bath perfusion with STX (10 min, 100nM, n = 5). G, Example of M-current traces under control conditions (control) and after perfusion with STX (10 min, 100nM) and subsequent perfusion of XE991 (10 min, 40μM). All I-V plots were analyzed with a repeated-measures, two-way ANOVA, and post hoc Newman-Keuls comparisons. Maximum peak current was analyzed by a paired Student's t test (*, P < .05; **, P < .01).
Next, we directly measured the M-current in CRH neurons using a deactivation protocol (Figure 2B). This protocol examined the voltage range (−75 to −30 mV), in which the M-current has its most profound effect on neuronal excitability (28). The M-current was calculated by subtracting current relaxation, the difference between the instantaneous and steady state (highlighted by arrows), in the control and treated conditions (E2/STX) (28). The maximum M-current was recorded at −35 mV (Figure 2C). Over a period of 20 minutes, the M-current did not significantly rundown (n = 3) (Figure 2C), and this 20-minute time period exceeded the typical recording time (10 min) for perfusion and evaluation of effects of E2, STX, or the various pharmacological agents used in this study.
We next examined the effects of E2 on the M-current in CRH neurons, with 1μM TTX present to block Na+-spike-dependent synaptic inputs. After 10 minutes of E2 (100nM) perfusion, the outward M-current was attenuated, especially at the higher voltages (P < .05 at −50, −45, −40, −35, and −30 mV, n = 6), with a significant effect of E2 (F1,110 = 31.9, P < .0001) (Figure 2, D and E). Subsequent application of XE991 robustly decreased the M-current (Figure 2D), suggesting that the current responses were indeed mediated by KCNQ channels. At −35 mV, the outward M-current peak value decreased from 97.5 ± 27.5 (control) to 30.8 ± 16.3 pA (n = 6, P < .05) after E2 application. Consequently, E2 application depolarized the resting membrane potential (RMP) and increased Rin in CRH neurons (Table 1).
RMP and Rin Before and After E2 or STX
| Control | Gq-mER Ligand | |
|---|---|---|
| E2 | ||
| RMP (mV) | −68.31 ± 5.86 | −60.54 ± 6.39b |
| Rin (GΩ) | 0.93 ± 0.12 | 1.24 ± 0.03a |
| STX | ||
| RMP (mV) | −68.42 ± 5.71 | −63.34 ± 5.99b |
| Rin (GΩ) | 0.95 ± 0.07 | 1.38 ± 0.15a |
| Control | Gq-mER Ligand | |
|---|---|---|
| E2 | ||
| RMP (mV) | −68.31 ± 5.86 | −60.54 ± 6.39b |
| Rin (GΩ) | 0.93 ± 0.12 | 1.24 ± 0.03a |
| STX | ||
| RMP (mV) | −68.42 ± 5.71 | −63.34 ± 5.99b |
| Rin (GΩ) | 0.95 ± 0.07 | 1.38 ± 0.15a |
Data were analyzed by Student's paired t test. RMP, resting membrane potential; Rin, input resistance.
P < .05, compared with control; n = 5–6 cells/drug.
P < .01, compared with control; n = 5–6 cells/drug.
Because the effect of E2 on the M-current occurs within minutes (∼10 min), we hypothesized that this rapid effect may be mediated by the Gq-mER, as previously identified in arcuate POMC neurons (17, 18). We tested this hypothesis by directly applying the Gq-mER-specific ligand STX. As expected, a 10-minute perfusion of STX (100nM) attenuated the M-current. At all higher voltages, the M-current was decreased (P < .05 at −50, −45, −40, −35, and −30 mV, n = 5) (Figure 2, F and G), with a significant effect of STX (F1,88 = 13.04, P < .001). The peak M-current at −35 mV decreased from 93.5 ± 23.6 (control) to 41.7 ± 23.3 pA (n = 5, P < .05) after STX application. Subsequent application of XE991 (40μM) robustly decreased the M-current (Figure 2G). Similarly, STX application depolarized CRH neurons and increased their input resistance (Table 1). In summary, both E2 and STX rapidly increased CRH neuronal excitability by suppressing the M-current and depolarizing CRH neurons.
Gq-mER mediates the effects of E2 or STX on the M-current in PVN CRH neurons by activating a PLC-PKCδ-PKA signaling pathway
To confirm the role of Gq-mER signaling pathway (PLC-PKCδ-PKA) activated by E2 and STX (17, 18) in attenuating the M-current in PVN CRH neurons, we applied a series of specific pharmacological interventions. First, to determine the involvement of an ER, we coperfused E2 (n = 5) (Figure 3A) or STX (n = 5) (Figure 3B) together with the ER antagonist ICI (1μM). Treatment with 1μM ICI eliminated the effect of E2 and STX, suggesting they are indeed mediated by an ER.
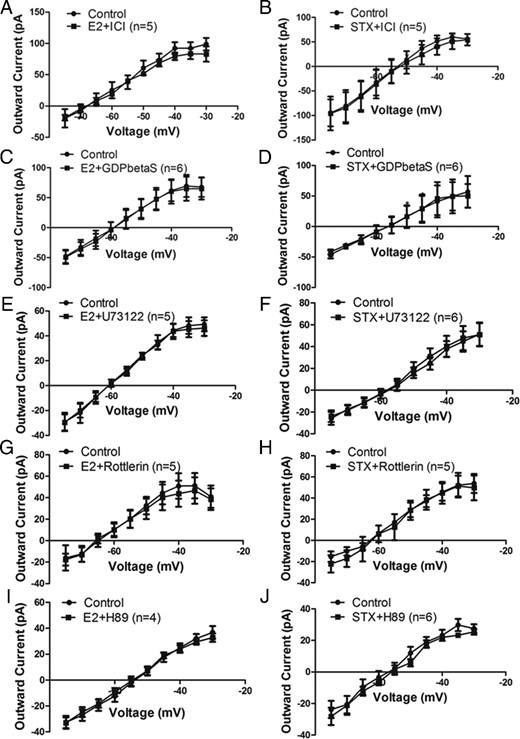
Gq-mER mediates the inhibitory effect of E2 and STX on the M-current via PLC-PKCδ-PKA signaling pathway in PVH CRH neurons. I-V plots of M-current from −75 to −30 mV under control conditions and E2 (100nM) or STX (100nM) when coperfused with (A and B) ER antagonist ICI (1μM, both n = 5), (C and D) with Gq inhibitor GDPβS (2mM, both n = 6) intracellularly dialyzed through patch pipette, (E and F) with PLC inhibitor U73122 (10μM, E2: n = 5, STX: n = 6), (G and H) with selective PKCδ inhibitor rottlerin (5μM; both n = 5), and (I and J) with specific PKA inhibitor H89 (10μM, E2: n = 4, STX: n = 6). All data were analyzed with a repeated-measures, two-way ANOVA and post hoc Newman-Keuls comparisons.
Second, to determine whether Gq signaling is involved, we introduced specific Gq inhibitor GDP-β-S-Li3 (2mM) by intracellular dialysis through the patch pipette for 5 minutes before recording the effects of E2 (n = 6) (Figure 3C) and STX (n = 6) (Figure 3D). GDP-β-S is a nonhydrolyzable form of GDP that blocks the GTPase cycle in an inactive state and competes with intracellular GTP for the binding site of G protein (45). Therefore, GDP-β-S prevents G protein-mediated signaling during receptor activation. In cells dialyzed with GDP-β-S, the inhibitory effect of E2 and STX on the M-current was completely blocked, suggesting that the inhibition is indeed dependent on Gq-coupled signaling.
Finally, activation of the α-subunit of Gq family activates PLC to hydrolyze phosphatidylinositol 4,5-bisphosphate (PIP2) in the membrane into diacylglycerol (DAG) and inositol triphosphate. DAG, in turn, activates PKCδ and PKA (17, 18, 46). If activation of this pathway is required, then each inhibitor should be able to abrogate the cellular response to E2 or STX. First, we coperfused E2 (n = 5) (Figure 3E) or STX (n = 6) (Figure 3F) with U73122 (10μM), an inhibitor of PLC. U73122 significantly abrogated the effects of E2 and STX, suggesting involvement of PLC. Moreover, U73343, the inactive analog of U73122, did not block either E2 or STX (data not shown). Because PKCδ and PKA is implicated downstream of PLC (17, 18), we next examined the elective PKCδ inhibitor rottlerin (5μM) and PKA inhibitor N-[2-(p-Bromocinnamylamino)ethyl]-5-isoquinolinesulfonamide · 2HCl hydrate (H-89) (10μM), respectively. Both rottlerin and H-89 blunted the ability of E2 (rottlerin, n = 5 [Figure 3G]; H-89, n = 4 [Figure 3I]) and STX (rottlerin, n = 5 [Figure 3H]; H-89, n = 6 [Figure 3J]) to inhibit the M-current, suggesting the requirement of PKCδ and PKA activation in the inhibition. These data are consistent with our hypothesis that both E2 and STX attenuated the M-current through the Gq-mER linked to activation of PLC-PKCδ-PKA signaling.
E2 and STX potentiates the amplitude of sEPSCs and mEPSCs in PVN CRH neurons
Previous studies have shown that E2 acutely potentiate EPSCs in the hippocampus and suprachiasmatic nucleus (47, 48). Because suppression of the M-current increases cellular responses to excitatory synaptic inputs (26, 49), we hypothesized that acute E2 application would alter the excitatory neurotransmission (measured by EPSCs) into PVH CRH neurons. To test the effect of E2 on the sEPSCs, we perfused CRH neurons with E2 for 10 minutes. E2 rapidly enhanced the average amplitude of sEPSCs (a representative trace is shown in Figure 4A) from 17.2 ± 2.2 (control) to 25.8 ± 4.7 pA (E2, n = 6, P < .05) (Figure 4B). There was no significant change in the frequency of sEPSC (control: 7.1 ± 1.9 Hz vs E2: 4.7 ± 1.3 Hz, n = 6) (Figure 4C). Similarly, after a 10-minute STX application, the average amplitude of sEPSCs increased (a representative trace is shown in Figure 4D) from 14.8 ± 1.6 (control) to 20.3 ± 2.7 pA (STX, n = 6, P < .05) (Figure 4E). No significant change in the average frequency of sEPSCs was found either (control: 7.9 ± 2.1 Hz vs STX: 5.8 ± 1.2 Hz, n = 6) (Figure 4F). In summary, both E2 and STX rapidly potentiated the amplitude of sEPSCs in PVN CRH neurons.
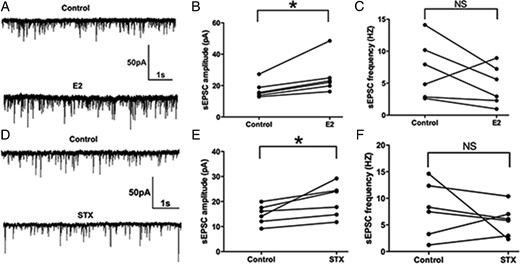
E2 and STX rapidly potentiated the amplitude of spontaneous excitatory postsynaptic currents (sEPSCs) in PVN CRH neurons. A, An example of sEPSC during control conditions and perfusion of E2 (10 min, 100nM). B, Average sEPSC amplitude increased after E2 perfusion. C, Average sEPSC frequency did not change after E2 perfusion. D, An example of sEPSC during control conditions and perfusion of STX (10 min, 100nM). E, Average sEPSC amplitude increased after perfusion of STX. F, Average sEPSC frequency did not change after STX perfusion. Scale bars shows a 50-pA amplitude and 1-second duration. Data were analyzed by a paired Student's t test (*, P < .05). NS, no significant difference (P > .05).
Because the effect of E2 and STX on sEPSCs (enhancing amplitude without changing frequency) may indicate a postsynaptic effect, we next sought to examine the effect of E2 and STX on the mEPSCs. A 10-minute perfusion of E2 rapidly enhanced the average amplitude of mEPSCs (a representative trace is shown in Figure 5A) from 15.2 ± 2.3 (control) to 18.1 ± 2.3 pA (E2, n = 5, P < .01) (Figure 5B). There was no significant change in the average frequency of mEPSCs (control: 7.4 ± 1.1 Hz vs E2: 5.2 ± 1.0 Hz, n = 5) (Figure 5C). Similarly, after a 10-minute STX perfusion, the average amplitude of mEPSCs was rapidly increased (a representative trace is shown in Figure 5D) from 14.0 ± 2.7 (control) to 16.8 ± 2.6 pA (STX, n = 5, P < .01) (Figure 5E). No significant change in the average frequency of mEPSCs was found either (control: 5.7 ± 1.7 Hz vs STX: 5.3 ± 0.6 Hz, n = 5) (Figure 5F). In summary, both E2 and STX rapidly potentiated the amplitude of mEPSCs in PVN CRH neurons.
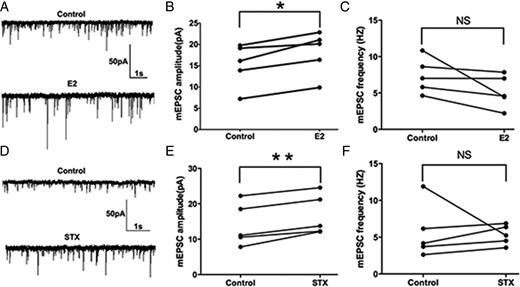
E2 and STX rapidly potentiated the amplitude of miniature EPSCs (mEPSC) in PVH CRH neurons. A, An example of mEPSC during control conditions and perfusion of E2 (10 min, 100nM). B, Average mEPSC amplitude increased after perfusion of E2. C, Average mEPSC frequency did not change after E2 perfusion. D, An example of mEPSC during control conditions and perfusion of STX (10 min, 100nM). E, Average mEPSC amplitude increased after perfusion of STX. F, Average mEPSC frequency did not change after STX perfusion. Scale bar shows a 50-pA amplitude and 1-second duration. Data were analyzed by a paired Student's t test (*, P < .05; **, P < .01). NS, no significant difference (P > .05).
Gq-PLC-PKCδ-PKA signaling mediates the potentiation of mEPSC by E2 and STX
To determine whether the Gq-mER signaling pathway (PLC-PKCδ-PKA) mediates the rapid potentiation of mEPSC amplitude by E2 and STX in PVN CRH neurons, we coperfused E2 or STX with inhibitors of each signaling molecule. First, we perfused E2 or STX with the ER antagonist ICI (1μM). ICI eliminated the effect of E2 and STX. With ICI, average mEPSC amplitude did not change after E2 (control: 16.6 ± 2.2 pA vs E2+ICI: 17.8 ± 5.5 pA, n = 6) (Figure 6A) or STX (control: 15.5 ± 2.5 pA vs STX+ICI: 13.0 ± 3.1 pA, n = 5) (Figure 6B), suggesting involvement of an ER.
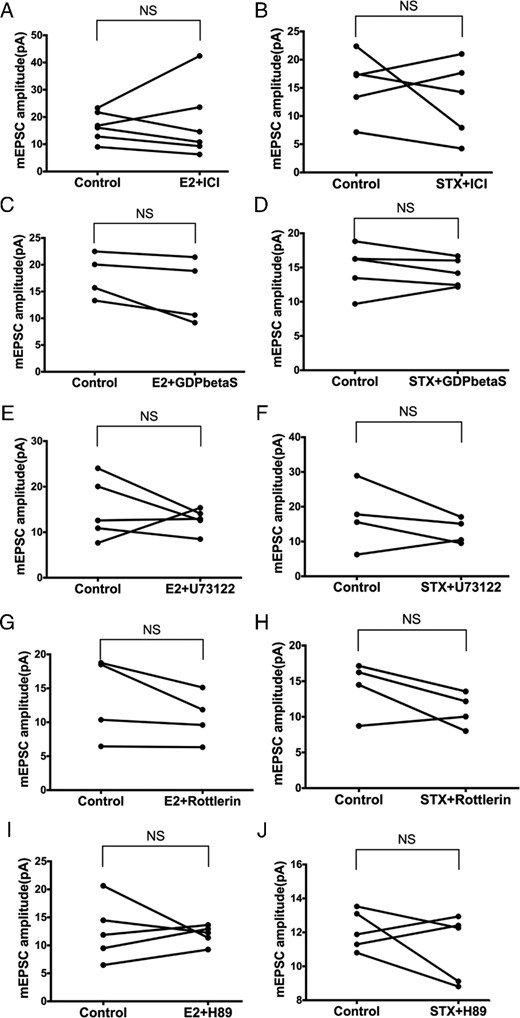
The rapid effects of E2 and STX on mEPSC are mediated by the Gq-mER linked to PLC-PKCδ-PKA signaling in PVH CRH neurons. No significant differences in the mEPSC amplitude were found between control conditions and E2 (10 min, 100nM) or STX (10 min, 100nM) coperfusion with (A and B) ERα antagonist ICI (1μM, E2: n = 6, STX: n = 5), (C and D) with Gq inhibitor GDPβS (2mM, E2: n = 4, STX: n = 5) intracellularly dialyzed through patch pipette, (E and F) with PLC inhibitor U73122 (10μM, E2: n = 5, STX: n = 4), (G and H) with selective PKCδ inhibitor rottlerin (5μM, both n = 4), or (I and J) with specific PKA inhibitor H89 (10μM, both n = 5). Data were analyzed by a paired Student's t test. NS, no significant difference (P > .05).
Second, intracellular dialysis with GDP-β-S (2mM) for 5 minutes before experimentation also prevented the augmentation of mEPSC amplitude by E2 (control: 17.9 ± 2.1 pA vs E2+GDP-β-S: 15.0 ± 3.0 pA, n = 4) (Figure 6C) and STX (control: 14.9 ± 1.6 pA vs STX+GDP-β-S: 14.3 ± 0.9 pA, n = 5) (Figure 6D), suggesting dependence on G protein signaling. Third, we coperfused E2 or STX with the PLC inhibitor U73122 (10μM). Again, U73122 abrogated the effects of E2 (control: 15.0 ± 3.0 pA vs E2+U73122: 12.7 ± 1.2 pA, n = 5) (Figure 6E) and STX (control: 17.1 ± 4.7 pA vs STX+U73122: 13.0 ± 1.8 pA, n = 4) (Figure 6F).
Next, we coperfused E2 or STX with the selective PKCδ inhibitor rottlerin (5μM). Rottlerin abolished the ability of both E2 (control: 13.5 ± 3.1 pA vs E2+rottlerin: 10.7 ± 1.9 pA, n = 4) (Figure 6G) and STX (control: 14.1 ± 1.9 pA vs STX+rottlerin: 10.9 ± 1.2 pA, n = 4) (Figure 6H) to potentiate the amplitude of mEPSC. Finally, the selective PKA inhibitor H-89 (10μM) also abrogated E2's effect (control: 12.6 ± 2.4 pA vs E2+H-89: 11.9 ± 0.8 pA, n = 5) (Figure 6I) and STX's effect (control: 12.1 ± 0.5 pA vs STX+H-89: 11.1 ± 0.9 pA, n = 5) (Figure 6J). In summary, the rapid potentiation of mEPSC by E2 and STX in PVN CRH neurons was largely mediated through the Gq-mER signaling linked to PLC-PKCδ-PKA pathway.
PKCδ activation lies upstream of PKA activation in the Gq-mER pathway
To determine the sequence of PKCδ and PKA kinase activation in the Gq-mER signaling pathway, we perfused the PKA activator forskolin (10μM) with or without the selective PKCδ inhibitor rottlerin (5μM). When used alone, forskolin inhibited the M-current (F1,66 = 13.44, P < .001, n = 4) (Figure 7A). At all higher voltages, the M-current was suppressed (P < .05 at −55, −50, −45, −40, −35, and −30 mV). Interestingly, forskolin alone also potentiated the amplitude of mEPSC (control: 16.3 ± 2.2 pA vs forskolin: 23.9 ± 2.7 pA, n = 4, P < .01) (Figure 7B), without changing the frequency (data not shown). Forskolin alone also potentiated the amplitude of sEPSC (control: 16.0 ± 1.8 pA vs forskolin: 21.0 ± 2.2 pA, n = 4, P < .01) (Figure 7C), without changing the frequency (data not shown). These data suggest that PKA activation alone could mimic the effect of E2 and STX in PVN CRH neurons.
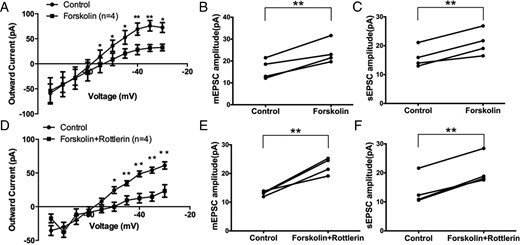
PKCδ activation lies upstream of PKA activation in the Gq-mER pathway in PVH CRH neurons. Application of PKA activator forskolin (10 min, 10μM) (A) inhibited the M-current (n = 4) and (B) potentiated mEPSC amplitude (n = 4) and (C) sEPSC amplitude (n = 4). Coperfusion of forskolin (10 min, 10μM) with the PKCδ inhibitor rottlerin (5μM) (D) inhibited the M-current (n = 4) and (E) potentiated mEPSC amplitude (n = 4) and (F) sEPSC amplitude (n = 4). Data were analyzed by a paired Student's t test (*, P < .05; **, P < .01).
If PKCδ lies upstream of PKA activation, then blocking PKCδ should not attenuate the effect of PKA activation by forskolin. Indeed, coperfusion of the selective PKCδ inhibitor rottlerin (5μM) with forskolin (10μM) inhibited the M-current (F1,66 = 36.45, n = 4, P < .0001) (Figure 7D). At all higher voltages, the M-current was suppressed (P < .05 at −50, −45, −40, −35, and −30 mV). Also, forskolin, when coperfused with rottlerin, still potentiated the amplitude of mEPSC (control: 13.1 ± 0.4 pA vs forskolin+rottlerin: 22.6 ± 1.4 pA, n = 4, P < .01) (Figure 7E). No significant change in the frequency of mEPSC was found (data not shown). For sEPSC, forskolin coperfused with rottlerin also potentiated the amplitude of sEPSC (control: 13.8 ± 2.6 pA vs forskolin+rottlerin: 20.7 ± 2.6 pA, n = 4, P < .01) (Figure 7F). There was no significant change in the frequency was found (data not shown). In summary, these data indicated that PKCδ activation lies upstream of PKA activation in PVN CRH neurons, which is also consistent with previous studies on the Gq-mER (17).
Effects of E2 and ERβ agonist DPN in ERα KO mice
Because ERβ is considered to be the predominant ER subtype in the parvocellular CRH neurons in the PVN (7, 50, 51) and ERα expression in the PVN is relatively limited (51, 52), we examined the effects of E2 and DPN (the ERβ-selective agonist) separately in PVN CRH neurons of ERα KO mice to validate our hypothesis that the rapid effects of E2 in the PVN were largely mediated through the Gq-mER. E2 (100nM, 10 min) perfusion in ERα KO mice inhibited the M-current in PVN CRH neurons (F1,80 = 14.01, P < .001 n = 5) (Figure 8A). At higher voltages, the M-current was suppressed (P < .05 at −40, −35, and −30 mV). Again, E2 application also potentiated the amplitude of mEPSC (control: 13.2 ± 0.7 pA vs E2: 21.4 ± 1.3 pA, n = 4, P < .05) (Figure 8B), without changing the frequency (control: 5.1 ± 0.7 Hz vs E2: 4.9 ± 0.2 Hz, n = 4) (Figure 8C). E2 application also potentiated the amplitude of sEPSC (control: 16.2 ± 4.3 pA vs E2: 24.2 ± 3.8 pA, n = 4, P < .05) (Figure 8D), without changing the frequency (control: 5.8 ± 0.8 Hz vs E2: 5.6 ± 0.8 Hz, n = 4) (Figure 8E). These data suggest E2's rapid effects on PVN CRH neurons do not require ERα.
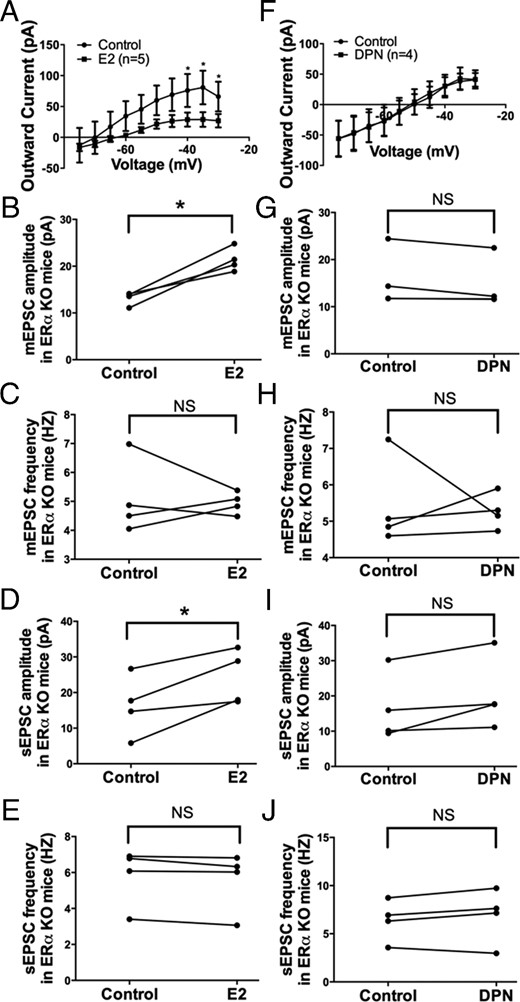
E2, but not the ERβ-selective agonist DPN, modulates M-current, mEPSC, and sEPSC in PVN CRH neurons from ERα KO females. A, I-V plot of M-current from −75 to −30 mV under control and E2 (10 min, 100nM) conditions in ERα KO females (n = 5, P < .05 at −40, −35, and −30 mV). E2 perfusion rapidly potentiates (B) the amplitude but not (C) the frequency of mEPSC and (D) the amplitude but not (E) the frequency of sEPSC in ERα KO females (n = 4 each). DPN (10 min, 100nM) perfusion in ERα KO females had no significant effect on (F) the M-current, mEPSC (G) amplitude or (H) frequency, or sEPSC (I) amplitude or (J) frequency (n = 4 each). All I-V plots were analyzed with a repeated-measures, two-way ANOVA and post hoc Newman-Keuls comparisons. EPSC data were analyzed by a paired Student's t test (*, P < .05). NS, no significant difference (P > .05).
To determine whether ERβ is involved, DPN (100nM) was perfused for 10 minutes in ERα KO mice and DPN did not affect the M-current (n = 4) (Figure 8F). Moreover, DPN perfusion had no significant effect on the amplitude (control: 15.6 ± 3.0 pA vs DPN: 14.5 ± 2.7 pA, n = 4) (Figure 8G) or the frequency (control: 5.4 ± 0.6 Hz vs DPN: 5.3 ± 0.2 Hz, n = 4) (Figure 8H) of mEPSC. Similarly, DPN perfusion had no effect on the amplitude (control: 16.4 ± 4.8 pA vs DPN: 20.4 ± 5.1 pA, n = 4) (Figure 8I) or the frequency (control: 6.4 ± 1.1 Hz vs DPN: 6.9 ± 1.4 Hz, n = 4) (Figure 8J) of sEPSC. These data indicate that ERβ is not involved in the rapid effects of E2, which is consistent with a previous study reporting that DPN had no effect on basal plasma CORT concentration when directly infused into the PVN (53). In summary, our data support the notion that ERβ and ERα is not involved in the membrane-initiated effects of E2. Furthermore, we performed recordings on CRH neurons from WT mice with DPN, which did not inhibit the M-current or augment EPSCs in CRH neurons (Supplemental Figure 1). Therefore, the membrane-initiated effects of E2 described in this study in CRH neurons are likely mediated by the Gq-mER.
In vivo activation of the Gq-mER by STX stimulates CRH neurons and basal plasma CORT
Because the above electrophysiological results suggested a rapid, membrane-initiated activation of PVN CRH neurons by E2 and STX, we hypothesized that E2 or STX may also rapidly activate CRH neurons in the hypothalamic PVN after in vivo application. Therefore, we administered E2 or STX in ovx female mice and examined c-fos activation in PVN CRH neurons 30 minutes after injection. Interestingly, we found that both injection of E2 (Figure 9, B, E, and H) and STX (Figure 9, C, F, and I) increased the number of c-fos+/CRH+ double-immunopositive neurons in the PVN compared with control (F2,8 = 9.9, P < .01) (Figure 9, A, D, and G). The average number of c-fos+/CRH+ neurons was increased in the E2 (371 ± 50 cells, n = 4, P < .01) and STX (333 ± 56 cells, n = 4, P < .01) groups compared with the control group (111 ± 23 cells, n = 4) (Figure 9J), indicating that stimulation of the Gq-mER activates CRH neurons.
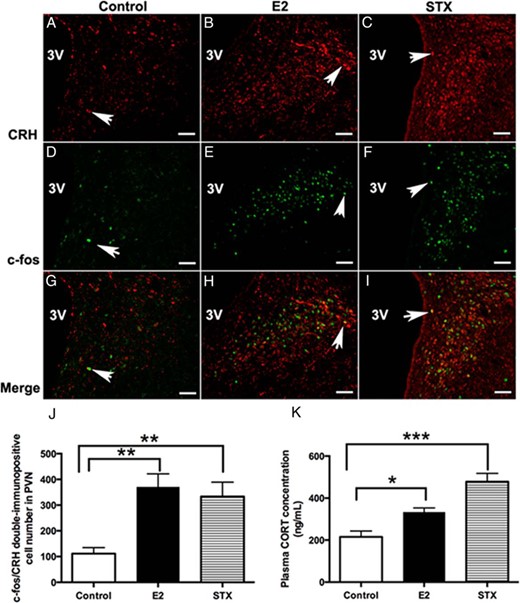
Comparison of the average number of c-fos+/CRH+ double-labeled neurons in the PVN and basal plasma corticosterone (CORT) concentration between E2- or STX-treated females and controls. A–C, Examples of CRH immunofluorescence labeling in the PVN from control (DMSO) and E2- and STX-treated, ovx females. D–F, Examples of c-fos immunofluorescence labeling in the PVN from control and E2- and STX-treated, ovx females. G–I, Merged panels from A+D, B+E, and C+F, respectively, demonstrating typical examples of c-fos+/CRH+ double-labeling in each group. Arrows point to examples of c-fos+/CRH+ double-labeled neurons. Scale bar, 50 μm. J, The average number of c-fos+/CRH+-labeled neurons in control, E2, or STX groups (n = 4 each). E2 (P < .01) and STX (P < .01) increased the number of c-fos+/CRH+-labeled neurons in the PVN. K, Basal plasma CORT levels in control, E2, or STX groups (n = 4 each). E2 (P < .05) and STX (P < .001) increased basal plasma CORT level compared with control. Data were analyzed by a one-way ANOVA with post hoc Newman-Keuls comparisons (*, P < .05; **, P < .01; ***, P < .001).
We next examined whether activation of Gq-mER and CRH neurons in vivo by E2 or STX would result in a rapid activation of the HPA axis. Basal plasma CORT levels were elevated in both E2- and STX-treated groups compared with the control group (F2,9 = 19.0, P < .001) (Figure 9K). The average plasma CORT concentration increased 30 minutes after injection with E2 (333.9 ± 19.5 ng/mL, n = 4, P < .05) or STX (478.0 ± 39.5 ng/mL, n = 4, P < .001) compared with control (215.1 ± 28.3 ng/mL, n = 4), suggesting a rapid activation of HPA axis.
Discussion
In the present study, we have defined a novel membrane-initiated (mER) mechanism for estrogenic control of CRH neuronal excitability in the hypothalamic PVN that is dependent on Gq-coupled PLC-PKCδ-PKA signaling pathway (shown in Figure 10), similar to the one previously identified in POMC neurons (17, 18). In addition, the Gq-mER plays an important role in the rapid regulation of HPA axis activity in vivo. Clinical studies have demonstrated that HPA axis activity is associated with stress-related neuropsychiatric disorders (eg, depression and posttraumatic stress disorder) (54, 55). Exploring the detailed mechanisms by which E2 stimulates CRH neuronal activity provides an important neuroendocrine mechanisms underlying the risk for these HPA-associated mood disorders.
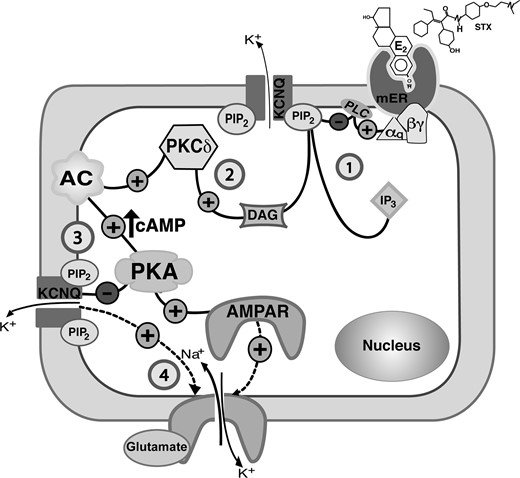
A model cell illustrates the Gq-mER signaling pathway in hypothalamic PVN CRH neurons that mediates the modulatory effect of E2 (or STX) on the M-current and on mEPSCs (1). E2 (or STX) activates a membrane-associated ER (mER) that is Gq coupled. The Gq protein activates PLC to catalyze the hydrolysis of membrane-bound PIP2 into IP3 and DAG (2). DAG activates PKCδ to augment adenylyl cyclase (AC) activity and generate cAMP, which in turn activates PKA (3). PKA phosphorylates KCNQ subunits to inhibit the M-current. Meanwhile, the hydrolysis of PIP2 (in step 1) in the membrane inhibits KCNQ activity. The change in ion (K+) conductance may alter the properties of EPSC (amplitude or frequency). The activation of PKA may also lead to the phosphorylation of AMPAR subunit (eg, GluR1-containing) augmenting membrane trafficking and recruitment to rapidly increases the amplitude of AMPAR currents (4).
In the current study, E2 (and STX) was found to rapidly increase excitability of PVN CRH neurons by suppressing the M-current and facilitating excitatory glutamatergic neurotransmission. We selected the current dose of 100nM, because it was previously shown to rapidly and effectively modulate GABA-B receptor-mediated K+ current in the hypothalamus of female mice (17, 18, 56). This dose of E2 and STX has been found to effectively promote rapid pharmacokinetics in brain slices (17, 57, 58). In addition, all the female mice were ovx. This was to ensure that all the E2-relevant studies were done in an estrogen-free environment and to exclude the possible interference of any cycling endogenous estrogens.
Our results demonstrated that the rapid effect of E2 or STX is abolished by the antiestrogen ICI, suggesting dependence on an ER. Potential ER candidates in the hypothalamus may include ERα, ERβ, ER-X, Gq-mER, and GPR30 (GPER1) (59). Among these, ER-X is enriched in postnatal but not adult cortical membranes (60, 61) and is ICI insensitive (62). GPR30 is expressed in the hypothalamus (58) but is not involved in the actions of STX (63). Recently, E2 was found to potentiate hippocampal glutamatergic neurotransmission, with distinct ERs (ERα, ERβ, GPER1) mediating the presynaptic vs postsynaptic potentiation in a sex-dependent manner (12). Therefore, in different brain regions E2 could signal via multiple distinct receptors through totally different mechanisms. In the current study, the characterized mER is neither ERα nor ERβ, as it was activated by STX, which does not bind to either ERα or ERβ (17, 18). In addition, our data elucidating the Gq-PLC-PKC-PKA pathway further validated our hypothesis that the Gq-mER is mediating most of the rapid effects of E2. Moreover, the lack of a rapid effect of DPN in ERα KO mice (and in WT mice) suggests that, at least for the estrogenic-initiated rapid cascades we examined, ERβ was not involved and ERα was not required. However, it remains possible that activating other ER subtypes (ie, ERα, GPER1) may modulate activity of CRH neurons through an upstream, presynaptic mechanism.
The rapid effect with E2 or STX (within 10 min) in inhibiting the M-current is compatible with a membrane-initiated mechanism, which may involve two concurrent mechanisms. The first involves the PLC-induced hydrolysis of and depletion in the local concentration of PIP2 in the membrane (22, 64), which has been found to decrease the M-current (64, 65). Another mechanism involves phosphorylation-induced regulation of the M-current (66), by which PKA may act as a final effector. Collectively, phosphorylation of KCNQ subunits in combination with PIP2 depletion could contribute to rapid inhibition of the M-current (as illustrated in Figure 10).
In addition to suppressing the M-current, Gq-mER activation also enhanced excitatory glutamatergic neurotransmission in CRH neurons. The increased amplitude of both sEPSCs and mEPSCs without a change in frequency indicated a postsynaptic effect (67). Such an increased synaptic response could be due to an increased density of glutamate receptors α-amino-3-hydroxy-5-methyl-4-isoxazoleproprionic acid receptors (AMPAR)) expressed on the postsynaptic membrane (68–70). One potential cellular mechanism could be increased AMPAR surface trafficking (ie, recruited by phosphorylation) (71, 72), which has been suggested to underlie mEPSC potentiation (73, 74). Importantly, approximately 46% of CRH neurons express glutamate receptor 1 (GluR1), which is the predominant AMPAR subunit (75). Because protein phosphorylation is a major cellular mechanism in regulating receptor trafficking (76) and phosphorylation of GluR1 subunit is closely correlated with AMPAR membrane redistribution (77), we propose that the Gq-mER activates PLC-PKC-PKA kinases and triggers rapid phosphorylation of AMPAR (ie, GluR1 containing) and surface trafficking. Indeed, both PKC (78, 79) and PKA (80, 81) were reported to increase AMPAR trafficking through direct phosphorylation of GluR1 subunits.
Another possible cellular mechanism may involve modulation of ion conductances across AMPAR through altered M-current activity and increased membrane excitability. Although the interaction between the M-current and EPSCs in hypothalamic neurons remains unknown, several studies have examined the role of the M-current in modulating EPSCs. In cultured hippocampal neurons treated for 12–14 days with linopirdine, a KCNQ blocker, the frequency of mEPSCs was reduced without changing the mEPSC amplitude (82). Slice perfusion of XE991 increased the frequency of mEPSCs in CA1 pyramidal neurons through a calcium-dependent (P/Q- and N-type Ca2+ channel) mechanism (83) and increased the amplitude of EPSC in pyramidal neurons of the A1 layer 2/3 auditory cortex (84). These data support the hypothesis that suppressing M-current activity augments properties of EPSC in CRH neurons. Collectively, our results support the view that E2-induced potentiation of mEPSC is likely a consequence of increased AMPAR surface trafficking (as illustrated in Figure 10) and/or increased ion conductance across the AMPAR.
Hypophysiotropic parvocellular CRH neurons (85) are densely innervated by excitatory glutamatergic fibers (29, 86–88). Therefore, Gq-mER-mediated augmentation of glutamatergic neurotransmission into PVN CRH neurons contributes to HPA axis activation. This was confirmed by our in vivo study, showing that acute E2 and STX administration activates PVN CRH neurons and stimulates the HPA axis. Such fast adaptive changes ensure a rapidly measured stress response. If the current findings are extrapolated to extrahypothalamic CRH neurons, such as those located in the locus coeruleus-norepinephrine arousal system, the bed nucleus of the stria terminalis, or the amygdala (89, 90), then rapidly enhanced emotional-arousal responses (eg, vigilance-checking and waking) would be expected (91, 92). This potentially benefits females in the short-term. However, overactivation of glutamatergic neurotransmission to CRH neurons has been linked to depressive disorder (93). Thus, persistent activation of CRH neurons and a subsequent persistent HPA hyperactivation could produce stress hypersensitivity in females (1, 2).
In summary, we have provided electrophysiological evidence that activation of the Gq-mER rapidly stimulates PVN CRH neurons by suppressing the M-current and potentiating glutamatergic neurotransmission. This is the first study reporting that the Gq-mER plays a critical role in the rapid control of PVN CRH neuronal activity and HPA axis activation. Although the exact molecular nature of this particular Gq-mER has not yet been precisely characterized, our findings contribute towards a better understanding of the rapid actions of E2 in the hypothalamus and provide a potential underlying mechanism for the involvement of E2 in the pathophysiology of HPA-associated mood disorders.
Appendix
Antibody Table
| Peptide/Protein Target | Antigen Sequence (if Known) | Name of Antibody | Manufacturer, Catalog Number, and/or Name of Individual Providing the Antibody | Species Raised in; Monoclonal or Polyclonal | Dilution Used |
|---|---|---|---|---|---|
| CRH | Row CRH: rat CRH, 1–41 aa | Anti-CRH | Abcam, ab8901 | Rabbit | 1:1000 |
| c-fos | Row c-fos: human, 120–155 aa | Anti-c-fos | Santa Cruz Biotechnology, Inc, (c-10) sc-271243 | Mouse | 1:1000 |
| Alexa Fluor 546 | Antirabbit Alexa 546 | Life Technologies, A11035 | Goat | 1:1000 | |
| Alexa Fluor 633 | Antimouse Alexa 633 | Life Technologies, A21052 | Goat | 1:1000 |
Acknowledgments
We thank Dr Martin J. Kelly and Dr Oline K. Rønnekleiv (Oregon Health & Science University) for the kind gift of STX and for helpful criticisms of the manuscript.
This work was supported by National Institutes of Health Grants R00DK083457, R00DK083457-S1, and P30ES005022 and the United States Department of Agriculture-National Institute of Food and Agriculture Grant NJ06107. J.L. is supported by the American Heart Association Postdoctoral Fellowship 16POST27710022.
Disclosure Summary: The authors have nothing to disclose.
Abbreviations
- aCSF
artificial cerebrospinal fluid
- AMPAR
α-amino-3-hydroxy-5-methyl-4-isoxazolepropionic acid receptor
- CORT
corticosterone
- DAG
diacylglycerol
- D-APV
D-2-amino-5-phosphonovalerate
- DMSO
dimethyl sulfoxide
- DPN
diarylpropionitrile
- E2
17β-estradiol
- EPSC
excitatory postsynaptic current
- ERα KO
ERα knockout
- GDP-β-S-Li3
GDP analog guanosine 5′-[β-thio]diphosphate trilithium salt
- GluR1
glutamate receptor 1
- GPER1
G protein-coupled estrogen receptor 1
- Gq-mER
Gq-coupled, membrane-associated estrogen receptor
- H-89
N-[2-(p-Bromocinnamylamino)ethyl]-5-isoquinolinesulfonamide · 2HCl hydrate
- HPA
hypothalamus-pituitary-adrenal
- ICI
ICI 182780
- IP3
inositol triphosphate
- I-V
current-voltage
- mEPSC
miniature EPSC
- mpd
medial periventricular subdivision
- ovx
ovariectomized
- PIP2
phosphatidylinositol 4,5-bisphosphate
- PKA
protein kinase A
- PKC
protein kinase C
- PLC
phospholipase C
- POMC
proopiomelanocortin
- PTX
picrotoxin
- PVN
hypothalamic paraventricular nucleus
- Rin
input resistance
- RMP
resting membrane potential
- sEPSC
spontaneous EPSC
- TTX
tetrodotoxin
- WT
wild type
- XE991
10,10-bis(4-pyridinylmethyl)-9(10h)-anthracenone dihydrochloride.
