


Postmenopausal women who have had polycystic ovary syndrome (PCOS) and chronic hyperandrogenemia may be at a greater risk for cardiovascular disease than normoandrogenemic postmenopausal women. The cardiometabolic effect of chronic hyperandrogenemia in women with PCOS after menopause is unclear. The present study was performed to test the hypothesis that chronic hyperandrogenemia in aging female rats would have more deleterious effects on metabolic function, blood pressure, and renal function than in normoandrogenemic age-matched females. Female Sprague Dawley were implanted continuously, beginning at 4–5 weeks, with dihydrotestosterone (postmenopausal hyperandrogenemic female [PMHAF]) or placebo pellets (controls), and were studied at 13 months of age. Plasma DHT was 3-fold higher, and estradiol was 90% lower in PMHAF than controls. Body weights were higher; EchoMRI showed greater fat and lean mass; and computed tomography showed more sc and visceral adiposity in PMHAF, but with similar femur length compared with controls. Insulin resistance was present in PMHAF with higher plasma insulin, normal fasting blood glucose, abnormal oral glucose tolerance test, and higher nonfasting blood glucose. Blood pressure (radiotelemetry) was significantly higher and heart rate was lower, and renal function (glomerular filtration rate) was reduced by 40% in PMHAF. Thus the aging chronically hyperandrogenemic female rat is a new model of postmenopausal PCOS, which exhibits insulin resistance and visceral obesity, hypertension, and impairment in renal function. This new model provides a unique tool to study the deleterious effects of chronic androgen excess in postmenopausal females rats.
Polycystic ovary syndrome (PCOS) is the most common endocrine pathology in women during their reproductive years, affecting 5–10% of the population, often beginning in adolescence (1–3). PCOS in young women is characterized by hyperandrogenemia, increased visceral adiposity and insulin resistance, and modest increases in blood pressure (BP) that are rarely treated (1–5).
With aging, hyperandrogenemia in women with PCOS decreases only modestly (6) or not at all (7) even following menopause. Whether the chronic hyperandrogenemia that is present with PCOS throughout life, is also associated with metabolic syndrome, overweight or obesity, and insulin resistance that will translate into increased cardiovascular disease after menopause is controversial. Hyperandrogenemic postmenopausal women in the Women's Ischemia Syndrome Evaluation (WISE) study had a higher incidence of central adiposity and coronary artery disease than women without hyperandrogenemia (8). In contrast, Schmidt and colleagues (9) reported that hyperandrogenemic, postmenopausal women from Sweden, age 61–79 years, exhibited only elevated triglycerides and were as likely to experience myocardial infarction and stroke as age-matched controls. However, one observation that was consistent between these studies was that hyperandrogenemic postmenopausal women in both studies had a higher prevalence of hypertension than normoandrogenemic postmenopausal women (8, 9). Hypertension is a leading risk factor for cardiovascular disease. In addition, Chen and colleagues (10) reported that the levels of androgens correlate well with the level of BP in women with PCOS.
Several epidemiological studies in men have shown an inverse relationship between plasma T and several cardiovascular risks factors, such as diabetes mellitus, obesity, visceral adiposity, and metabolic syndrome (11, 12). Whether the inverse correlation between lower T levels and obesity, metabolic syndrome, and cardiovascular disease in men is a cause/effect relationship, or whether the lower T levels are a consequence of the metabolic alterations and cardiovascular disease remains to be determined. In contrast, in women, regardless of the presence of PCOS, elevated plasma levels of androgens have been positively correlated with obesity and metabolic syndrome (13). The mechanisms behind the differential action of androgens in males and females remain unclear.
Therefore, to address whether the presence of chronic hyperandrogenemia leads to metabolic dysfunction and cardiovascular-renal disease in a new rat model of postmenopausal polycystic ovary syndrome (PCOS), we implanted 4-week old female rats with dihydrotestosterone (DHT) pellets and evaluated them at 13 months of age. We refer to this model as the postmenopausal hyperandrogenemic female (PMHAF) rat.
Materials and Methods
Rats
Female Sprague Dawley rats were obtained from the vendor (Harlan SD) at weaning (age 3 wk) and implanted with DHT (7.5 mg pellets/90 d; 83 μg/d; Innovative Research) or placebo pellets beginning at 4–5 weeks of age, as we previously described (14). Pellets were changed every 85 days. Rats were allowed to age to 13 months. These rats are termed “postmenopausal hyperandrogenemic females (PMHAF)” and “aging control (placebo-treated) females.” Rats were maintained throughout the studies on standard rat chow (Harlan 8640, Harlan SD), and housed in temperature-controlled rooms with a constant light/dark cycle (12 h/12 h) and ad libitum access to water. Protocols complied with the Guidelines for the Care and Use of Laboratory Animals by the National Institutes of Health and were reviewed and approved by the Institutional Animal Care and Use Committee of the University of Mississippi Medical Center.
Measurement of plasma steroids and estrous cycle
Plasma DHT (n = 6 per group) was measured in PMHAF and aging control rats, using commercially available RIA kits (DHT: DSL4900 Active DHT kit; Diagnostic Systems Laboratories, Inc.; Beckman Coulter), as previously described (14, 15). Plasma estradiol was measured in young control and DHT-treated females (n = 4 per group) and in old PMHAF rats and controls (n = 8–10 per group) by liquid chromatography–mass spectroscopy in the Clinical Laboratory, Mayo Clinic. DHT and estradiol are presented as picograms per mililiter.
Metabolic parameters
Metabolic parameters were measured as previously described (14). Blood glucose, fasted (18 h) or nonfasted, was determined from blood obtained from the tail vein of the rats (n = 6 per group), using a glucometer (Accu-check Advantage; Roche). Plasma insulin and leptin were measured by RIA (n = 6 per group), according to the manufacturer's recommendations using commercially available kits (Linco Research). Oral glucose tolerance test was performed in rats (n = 6 per group) fasted for 18 hours. Briefly, rats were given an oral glucose load (D-(+)-glucose) in water; Sigma) by gavage (2 g/kg body weight; total volume = 500 μL). Prior to and every 30 minutes after the glucose load, a drop of blood was obtained from a tail cut, and glucose levels were measured by Accu-Chek Advantage glucometer. Data were evaluated as area under the curve (AUC) and shown graphically.
Body composition by EchoMRI
In PMHAF rats and aging controls (n = 6 per group), body composition, including total body fat mass, lean mass, total body water, was measured by EchoMRI (4in1–900 model Body Composition Analyzer, EchoMRI), according to manufacturer's directions. Data are presented in grams and total body adipose fat was factored for body weights in all animals and expressed as a percentage.
Computed tomography scans
Computed tomography (CT) scans to evaluate abdominal adiposity in the PMHAF rats and aging controls were done as previously described (15). Briefly, rats (n = 5–6 per group) were individually placed inside cardboard boxes and imaged in the prone position using a Siemens Sensation 64 CT scanner. As shown in Figure 1, the field of view was made as small as possible in the X–Y direction (∼10 cm) and included the whole body (nose through the hindfeet) in the Z direction. A modification of a clinical abdominal protocol was selected, and included the following parameters: helical mode, pitch 1.0, 120 kVp, 400 mAs, 1-second gantry rotation, 0.6-mm collimator, 0.6-mm axial slice thickness, 0.6-mm axial slice interval, 512 × 512 pixel matrix, and B50s (medium sharp) reconstruction algorithm. The estimated voxel size was 0.2 × 0.2 mm in the X–Y plane and 0.6 mm in the Z direction. For measurement of abdominal fat, each rat was scanned twice. Five sequential 0.6-mm slices (3-mm slab) located immediately cranial to the tip of the iliac crests were loaded into the Phillips Brilliance 3-dimensional software viewer. Total abdominal fat (TAF) was selected using Hounsfield Unit (HU) threshold technique assuming that fat attenuation is between –30 and –190 HU. The sc abdominal fat (SAF) and visceral abdominal fat (VAF) compartments were separated by a region of interest drawn along the abdominal wall musculature as an anatomic landmark separating the two compartments. TAF, VAF, and SAF volumes were measured using the two separate image datasets for each rat, and the mean of each compartment was used for comparison between rats. Data are presented as mean ± SEM with units: cubic millimeters factored for body weight (g).

Representative CT scans of aging controls (left) and PMHAF rats (right). Rats (n = 5–6 per group) were scanned in the prone position as described in Methods. Images on the left are aging controls; images on right are PMHAF rats.
Measurement of mean arterial BP
Under gas anesthesia with isofluorane (Mallinckrodt Veterinary) and with aseptic technique, PMHAF rats and aging controls (n = 5–6 per group) were implanted at 13 months of age with radiotelemetry transmitters (TA11PA-C40; Data Sciences International) into the abdominal aorta below the renal arteries, as we previously described (14, 15). Rats were placed into individual cages above a receiver (RLA-3000) and allowed 2 weeks of recovery. Telemetry BP (mean arterial pressure [MAP]) and heart rate measurements were obtained during a 10-second sampling period (500 Hz), recorded and averaged every 5 minutes for 24 hours per day for 5 days. Data are presented as mean ± SEM, and averaged for each group of rats.
Renal function
Glomerular filtration rate (GFR) was measured in PMHAF rats and placebo controls (n = 5–6 per group), as previously described (14). Briefly, 3H-inulin (20 μCi/mL 0.9% NaCl; at 2 mL/h), was infused into rats throughout the study. After 2 hours' equilibration, three blood samples (50 μL each) were taken at 30-minute intervals. GFR was calculated as cpm for infusate × infusion rate divided by cpm for plasma samples. Data are expressed as mean mL/min/g kidney weight ± SEM.
Urinary protein, kidney injury molecule-1, and nitrate/nitrite excretion
Rats (n = 8 per group) were placed in metabolic cages without food, and urine was collected for 24 hours. Urinary protein excretion was measured by the Bradford method, using a commercially available reagent (Bio-Rad). Data are expressed as mg excreted per day. Kidney injury molecule-1 (KIM-1), a sensitive biomarker for proximal tubular injury, was measured using a commercially available kit (R&D Systems; RKM100), according to the manufacturer's instructions, as we previously described (16, 17). Data are expressed as picograms excreted per day. Urinary nitrate/nitrite excretion was measured, as we previously described (18). Data are expressed as nmol excreted per day per kg body weight.
Statistical analyses
All data are expressed as mean ± SEM. Data were analyzed by Student t test (for two groups). Differences were considered statistically significant at P < .05. Statistical analyses were performed with SigmaStat software package version 3.1 (Systat Software, Inc.).
Results
Measurement of plasma steroids
Plasma DHT and estradiol were measured in PMHAF rats and aging controls at 13 months of age. As we showed previously in young females given DHT (14), plasma DHT was approximately 3-fold higher in PMHAF rats than aging controls (79.3 ± 9.9 vs 273.0 ± 87.1 pg/mL). As shown in Figure 2, plasma levels of estradiol were not different in young female controls or DHT-treated rats. In contrast, estradiol levels were reduced by approximately 54% in old controls compared with young controls. Estradiol levels were reduced by almost 90% in PMHAF rats compared with age-matched controls.
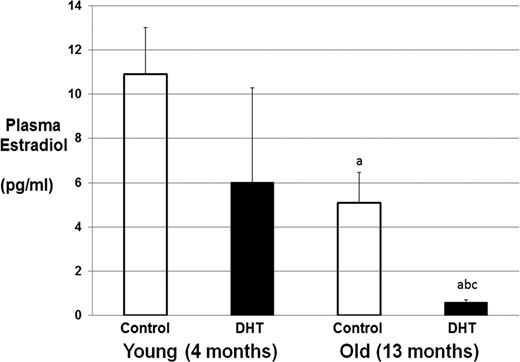
Plasma estradiol levels in young (5 mo) and old DHT-treated and control rats. Plasma was taken from young (n = 4 group) and PMHAF (n = 8–10 group) and control rats. Estradiol was measured by liquid chromatography–mass spectroscopy as described in Methods. a, P < .05 compared with young controls; b, P < .05 compared with young DHT; c, P < .05 compared with old controls.
Metabolic parameters
As shown in Table 1, body weights were significantly higher in PMHAF rats, and EchoMRI showed that both fat mass and lean mass were higher in PMHAF rats, as was the ratio of total adipose fat (TAF) to body weight. Plasma leptin was approximately 2-fold higher in PMHAF rats than in aging controls.
Body Composition by EchoMRI in Control and PMHAF Rats
| Characteristic | Aging Controls | PMHAF |
|---|---|---|
| Body weight, g | 307.9 ± 20.1 | 397.3 ± 9.4a |
| Fat mass, g | 39.0 ± 6.8 | 65.6 ± 7.4a |
| Lean mass, g | 246.2 ± 14.4 | 302.8 ± 6.7a |
| Total water, g | 187.4 ± 11.5 | 228.4 ± 5.8a |
| TAF/g BW, % | 12.4 ± 1.6 | 16.4 ± 1.6a |
| Characteristic | Aging Controls | PMHAF |
|---|---|---|
| Body weight, g | 307.9 ± 20.1 | 397.3 ± 9.4a |
| Fat mass, g | 39.0 ± 6.8 | 65.6 ± 7.4a |
| Lean mass, g | 246.2 ± 14.4 | 302.8 ± 6.7a |
| Total water, g | 187.4 ± 11.5 | 228.4 ± 5.8a |
| TAF/g BW, % | 12.4 ± 1.6 | 16.4 ± 1.6a |
Abbreviations: TAF/g BW, total adipose fat per gram of body weight.
P < .05.
As shown in Table 2, in another set of rats, CT scans were performed, and body weights, SAF, VAF, and TAF, all factored for body weights, were higher in PMHAF rats than aging controls. Femur lengths were not different between PMHAF rats and aging controls, suggesting that DHT did not cause the rats to grow longer.
Abdominal Adiposity by CT Scans in Control and PMHAF Rats
| Characteristic | Aging Controls | PMHAF |
|---|---|---|
| Body weight, g | 318.3 ± 22.3 | 381.7 ± 13.0a |
| SAF, mm3/g | 2.1 ± 0.1 | 2.9 ± 0.3a |
| VAF/g BW | 3.45 ± 0.07 | 4.60 ± 0.30a |
| TAF/g BW | 5.5 ± 1.0 | 7.9 ± 0.5a |
| Femur length, cm | 3.47 ± 0.11 | 3.58 ± 0.09 |
| Characteristic | Aging Controls | PMHAF |
|---|---|---|
| Body weight, g | 318.3 ± 22.3 | 381.7 ± 13.0a |
| SAF, mm3/g | 2.1 ± 0.1 | 2.9 ± 0.3a |
| VAF/g BW | 3.45 ± 0.07 | 4.60 ± 0.30a |
| TAF/g BW | 5.5 ± 1.0 | 7.9 ± 0.5a |
| Femur length, cm | 3.47 ± 0.11 | 3.58 ± 0.09 |
Abbreviation: BW, body weight.
n = 5–6 per group.
P < .05.
As shown in Figure 3, plasma insulin (Figure 3A) was significantly higher in PMHAF rats than aging controls. Nonfasted blood glucose (Figure 3B) was also higher in PMHAF rats. Fasted blood glucose (Figure 3C) was not different in PMHAF rats than aging controls, but the AUC for oral glucose tolerance test (OGTT) was higher in PMHAF rats.
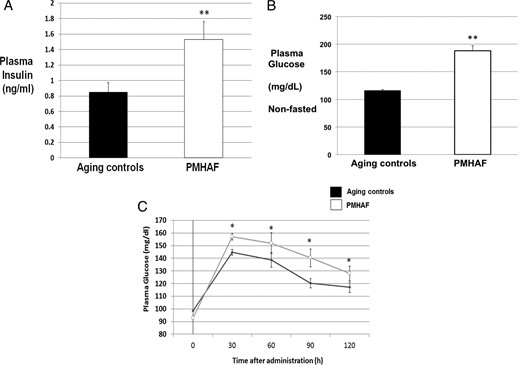
Plasma insulin, nonfasted glucose and OGTT in PMHAF rats and aging controls. PMHAF rats had higher plasma insulin (A) and nonfasted glucose levels (B) than did aging controls. Oral glucose tolerance test (C) AUC was also higher in PMHAF rats. Fasted glucose (C) was not different between the groups however. *, P < .05, PMHAF vs aging controls.
MAP, heart rate, and renal function
As shown in Figure 4A, MAP as measured by radiotelemetry, was significantly higher in PMHAF rats than in aging controls, whereas heart rate (Figure 4B) was significantly lower in PMHAF rats. As shown in Table 3, kidney weights and kidney weight factored for body weight tended to be higher in PMHAF rats but did not reach significance. However, GFR was significantly lower in PMHAF rats than in aging controls. Indicators of renal injury, urinary protein, and KIM-1 excretion were both significantly higher in PMHAF rats than controls. Urinary nitrate/nitrite excretion, an indication of total body nitric oxide (NO) levels, was significantly lower in PMHAF rats than controls.
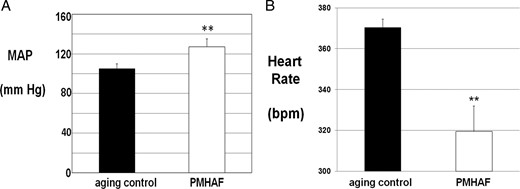
MAP (A) was significantly higher and heart rate (B) was lower in PMHAF rats than aging controls. MAP and heart rate were measured by radiotelemetry for 5 d and the data were averaged, as described in Methods. **, P < .01, PMHAF vs aging controls.
Characteristics of Blood Pressure and Renal Function in PMHAF Rats
| Characteristic | Aging Controls | PMHAF |
|---|---|---|
| Kidney weights, g | 2.32 ± 0.39 | 3.03 ± 0.27 |
| KW/BW ratio, x103 | 6.36 ± 0.37 | 6.85 ± 0.49 |
| GFR, ml/min/g KW | 1.39 ± 0.06 | 1.06 ± 0.08a |
| Proteinuria, mg/d | 12.8 ± 5.2 | 140.4 ± 34.5b |
| Urinary KIM-1, pg/mL | 189 ± 43 | 492 ± 64a |
| Urinary nitrate/nitrite, nmol/d/kg BW | 217.3 ± 65.9 | 38.4 ± 19.5 |
Abbreviation: KW/BW, kidney weight to body weight ratio.
n = 5 per group.
P < .05.
P < .001.
Discussion
We sought to characterize the PMHAF rat as a model of chronic androgen excess as is found in postmenopausal women with PCOS throughout their reproductive lives. The elevated levels of androgens do not abate with menopause and aging in these women (7, 8). Thus we performed this study to evaluate the consequences of long-term androgen excess with the intent to determine whether the PMHAF rats would exhibit adverse metabolic, cardiovascular and renal effects when compared with their aging controls. Indeed, we found that PMHAF exhibited: 1) an increase in body weight, fat and lean mass, sc and VAF, but not femur length, showing they had developed obesity with aging; 2) an increase in plasma insulin, nonfasted blood glucose, and abnormal OGTT, suggesting they exhibited insulin resistance; 3) an increase in MAP, with a reduction in heart rate; and 4) a reduction in renal function with reductions in GFR and an increase in renal injury with increases in protein and KIM-1 excretion; and 5) a reduction in nitrate/nitrite excretion.
In our previous characterization of young females given DHT from 4–5 weeks of age and studied at 16 weeks of age, we found that the DHT-treated females had a greater food intake and thus a greater body weight than did control females (14). This trend was sustained in our current study in which the PMHAF rats were also heavier and had higher nonfasted blood glucose levels. However, although the PMHAF rats had insulin resistance with higher insulin levels than aging controls, fasting blood glucose levels were the same as in aging controls. It is surprising that with the insulin resistance that was present in the young DHT-treated animals in our previous study (14), PMHAF did not become overtly diabetic by 13 months of age, especially with the further increase in body weight sustained by the PMHAF rats with aging. However, in comparison with young rats in our previous study (14), both PMHAF and aging controls gained weight, and plasma insulin levels increased with aging in both aging controls and PMHAF rats to maintain fasting glucose levels at fairly normoglycemic levels. The lack of overt diabetes is different than occurs in most women with PCOS who frequently develop type 2 diabetes with aging and menopause mainly as a result of weight gain (4, 6).
One effect of aging we found in the present study is the change in the deposition of abdominal fat. In a previous study, CT scans in young DHT-treated female rats showed that only sc abdominal fat was increased compared with placebo controls (14). These data were surprising to us given that women with PCOS are typically found to have an increase in VAF (2). With aging, however, we found that both sc and visceral adipose fat were increased in PMHAF rats. These changes were despite the fact that femur length was not different between the groups showing that hyperandrogenemia did not cause the rats to grow in length, as would be expected in male rats with androgens. The fact that both visceral and sc fat depositions are increased in the PMHAF rats is more consistent with postmenopausal women who have hyperandrogenemia (7, 8).
Leptin levels in PMHAF rats in this study were increased by approximately 2-fold. Pre- and postmenopausal women typically have higher leptin levels than men (19). However, given that leptin is an anorexic and the PMHAF rats weigh more than the controls, the data suggest that PMHAF rats may be leptin resistant. Future studies will be necessary to determine whether this is the case.
Another major goal of these studies was to determine whether PMHAF rats exhibit adverse cardiovascular and renal effects from chronic DHT. In young females given DHT for 11–12 weeks, there is an increase in MAP of approximately 10 mm Hg compared with their placebo-treated controls (14). In the present study we found that with aging, BP was increased by approximately 20 mm Hg in the PMHAF rats compared with aging controls. Young females typically have MAPs of 100 mm Hg (14, 20), whereas the aging controls in the present study have MAPs of 105 mm Hg. Thus it is possible that the MAPs in the controls also increased with age.
In young females treated with DHT, GFR was increased slightly compared with placebo controls with no glomerular or tubular injury as determined by morphology (14). With aging, the increase in both proteinuria and KIM-1 excretion in PMHAF rats suggests that they have now developed significant renal injury and thus have a reduction in GFR compared with the aging controls that have a typical GFR of ≈1 mL/minute per g kidney weight. The proteinuria in PMHAF rats may also be due to the increase in BP with glomerular injury. However, an increase in KIM-1 is indicative of proximal tubular injury (21). Our previous studies with Sprague Dawley females have shown that under normal aging conditions, they are resistant to renal injury up to 22–24 months of age (20). Importantly, the reduction in GFR in the PMHAF rats is only approximately 40%. Reductions in GFR of up to 75% are necessary before compromised renal function is typically treated (21). Patel and colleagues reported that increased microalbuminuria in young women with PCOS was associated with prevalence of metabolic syndrome and hypertension (22). However, to our knowledge there are no studies in which chronic renal disease has been evaluated in postmenopausal women who had PCOS or hyperandrogenemia throughout their reproductive life.
We also found that urinary nitrate/nitrite levels were significantly reduced in PMHAF rats compared with aging controls. Urinary nitrate/nitrite is a biomarker for nitric oxide (NO) synthesis in the body. Reductions in NO are associated with endothelial dysfunction and increased oxidative stress. In our previous studies in young females given DHT, we found that the enzymes that control oxidative stress in the kidney were increased (14). Oxidative stress has been shown to contribute to hypertension in males due to the binding of NO by superoxide to produce the strong oxidant peroxynitrite (23). Thus chronic oxidative stress that reduces NO could contribute to the elevated BP in our PMHAF rats. Future studies will be necessary to determine all of the mechanisms that contribute to the 20-mm-Hg increase in BP in our PMHAF rat model.
With regard to human studies, the controversy remains regarding whether women who have PCOS have early cardiovascular disease, especially with menopause. Armeni and colleagues (24) reported that arterial stiffness was greater in nondiabetic postmenopausal women who had PCOS than in age-matched controls. Our model closely represents this population of women. In addition, as mentioned earlier, postmenopausal women in the WISE cohort who fit the characteristics of PCOS with hyperandrogenemia had a greater risk of cardiovascular disease than did the non-PCOS cohort (7). In a separate report, McGowan (25) also suggested that postmenopausal women with PCOS may have a greater cardiovascular risk. However, as mentioned earlier, Schmidt and colleagues (9) reported that women who had PCOS during their reproductive years and had been initially seen 21 years previously, were now 61–79 years of age, and did not have a greater incidence of myocardial infarction, stroke, or mortality than did the age-matched controls. However, Fauser and Bouchard (26) pointed out in their commentary on the paper that it is possible that by that age, the non-PCOS postmenopausal women in the study caught up to the PCOS women with regard to cardiovascular events given that they were all many years postmenopause. In addition, whether the “control” cohort had similar levels of metabolic dysfunction or hypertension that could have contributed to their prevalence of cardiovascular disease outcomes was not evaluated in the study. Thus, future studies in women with PCOS must be performed at an earlier age to evaluate their cardiovascular disease risk shortly after menopause.
One common denominator for all the studies discussed above is the presence of hypertension in postmenopausal women who had PCOS during their reproductive years. This was the case in both the Schmidt and colleagues study (9), the Shaw and colleagues study of the WISE cohort (8), and in the Armeni study (24). Although hypertension itself is one of the most common risk factors for cardiovascular disease, the mechanisms responsible for hypertension in hyperandrogenemic postmenopausal women are not clear. Furthermore, and most importantly, the guidelines for treatment of hypertension in aging women are not currently different than men despite several studies that show that hypertension in aging women is not as well controlled as in age-matched men (27), suggesting that novel mechanisms may be responsible for hypertension in aging women, especially those with hyperandrogenemia. Schlaich and colleagues (28) reported that radiofrequency renal nerve ablation reduced BP in two young women with PCOS, suggesting a sympathetic component to the hypertension associated with PCOS, as we found previously in young DHT-treated females (15). Thus, future studies must address whether the mechanisms responsible for the hypertension in hyperandrogenemic postmenopausal women are different than in normoandrogenemic postmenopausal women to provide a better quality of life for aging women in general.
Although estradiol levels were not different in young (age 5 mo) DHT-treated females compared with controls [in the present study and Yanes et al (14)], it is possible that some of the cardiovascular and metabolic effects that we find in our aging animal model of PCOS could be due to reduced levels of estradiol rather than the increase in androgens. However, similar conclusions could be drawn for postmenopausal women who have had PCOS throughout their lives and, with menopause, have reduced levels of estrogens in the face of elevated androgens.
In summary, we have described a new model of chronic hyperandrogenemia in aging postcycling female rats that exhibit many characteristics of postmenopausal women who have had PCOS and hyperandrogenemia throughout their lives. As shown in Table 4, the model mimics the chronic hyperandrogenemia, overweight/obesity, abdominal adiposity, insulin resistance, and hypertension of postmenopausal women who have had PCOS throughout their reproductive lives. The model is not a model of overt diabetes in aging women with PCOS given that they have insulin resistance but normal fasting blood glucose. The model also shows early renal insufficiency and whether this is the case in postmenopausal women with PCOS remains to be studied thoroughly. The PMHAF rat constitutes a novel model in which to study the deleterious effect of chronic hyperandrogenemia in females.
PMHAF Model
| Characteristic | PMW With PCOS | PMHAF Rats |
|---|---|---|
| Overweight/Obesity | Yes | Yes |
| Hyperandrogenemia | Yes | Yes |
| Insulin resistance | Yes | Yes |
| Diabetes (including fasting glucose) | Not all | No |
| Abdominal adiposity | Visceral | sc and visceral |
| Hypertension | Yes | Yes |
| Renal function | Unknown | Reduced |
Abbreviations: Inc, increased; PMW, postmenopausal women; sc, subcutaneous.
The PMHAF model mimics many of the characteristics found in newly postmenopausal women who have had PCOS throughout their reproductive lives.
Acknowledgments
This work was supported by the National Institutes of Health National Heart, Lung, and Blood Institute RO1s HL66072 and HL69194 and PO1 HL51971 (to J.F.R.), and the American Heart Association Scientific Development Grant No. 0830239N (to L.L.Y.), and American Heart Association Southeast Affiliate Postdoctoral Fellowship Award 14POST18640015 (to R.M.).
Disclosure Summary: The authors have nothing to disclose.
Abbreviations
- AUC
area under the curve
- BP
blood pressure
- CT
computed tomography
- GFR
glomerular filtration rate
- HU
Hounsfield Unit
- KIM
kidney injury molecule-1
- MAP
mean arterial pressure
- NO
nitric oxide
- OGTT
oral glucose tolerance test
- PCOS
polycystic ovary syndrome
- PMHAF
postmenopausal hyperandrogenemic female
- SAF
sc abdominal fat
- TAF
total abdominal fat
- VAF
visceral abdominal fat
- WISE
Women's Ischemia Syndrome Evaluation.
References
Author notes
C.D. and R.M. contributed equally to the study.
