


p53 is a well-known tumor suppressor that plays multiple biological roles, including the capacity to modulate metabolism at different levels. However, its metabolic role in brown adipose tissue (BAT) remains largely unknown. Herein we sought to investigate the physiological role of endogenous p53 in BAT and its implication on BAT thermogenic activity and energy balance. To this end, we generated and characterized global p53-null mice and mice lacking p53 specifically in BAT. Additionally we performed gain-and-loss-of-function experiments in the BAT of adult mice using virogenetic and pharmacological approaches. BAT was collected and analyzed by immunohistochemistry, thermography, real-time PCR, and Western blot. p53-deficient mice were resistant to diet-induced obesity due to increased energy expenditure and BAT activity. However, the deletion of p53 in BAT using a Myf5-Cre driven p53 knockout did not show any changes in body weight or the expression of thermogenic markers. The acute inhibition of p53 in the BAT of adult mice slightly increased body weight and inhibited BAT thermogenesis, whereas its overexpression in the BAT of diet-induced obese mice reduced body weight and increased thermogenesis. On the other hand, pharmacological activation of p53 improves body weight gain due to increased BAT thermogenesis by sympathetic nervous system in obese adult wild-type mice but not in p53−/− animals. These results reveal that p53 regulates BAT metabolism by coordinating body weight and thermogenesis, but these metabolic actions are tissue specific and also dependent on the developmental stage.
Thermogenesis in brown adipose tissue (BAT) is a key component of energy expenditure in mammals and have an impact on long-term energy balance and hence body weight (1–6). Thermogenesis is facilitated via uncoupling of mitochondrial respiration from ATP production, mediated by uncoupling protein 1 (UCP1) (7–9). Increasing evidence reveals that BAT also causes plasma triglyceride clearance (10) and improved glucose homeostasis (11, 12) through its ability in uptake and disposal of large quantities of lipid and glucose from the circulation for use as substrates during thermogenesis (7, 10). Since the demonstration that BAT in human adults is active (13–17), it has emerged as a target to combat obesity and related metabolic disorders.
p53 is an exhaustively studied protein, primarily as a tumor suppressor in humans and other mammals. However, recent publications are demonstrating that p53 also exerts important functions in energy homeostasis (18, 19). Among several tissues, p53 was found in white adipose tissue (WAT), in which it is highly induced in obese, leptin-deficient mice (20). In line with this, the up-regulation of p53 in WAT caused an inflammatory response that led to insulin resistance (21), whereas its inhibition produced the opposite effects (21). In humans, the expression of p53 seems to be altered in the adipose tissue of obese subjects and is related with inflammation and insulin resistance (22). In terms of differentiation, p53 suppresses the differentiation of white adipocytes, whereas potentiates brown adipocyte differentiation (23–26). Finally, a recent report has demonstrated that p53-null mice are resistant to diet-induced obesity (DIO), and this resistance may be explained by increased UCP1 expression in both BAT and WAT (27). According to the important metabolic role of p53, patients with the Li Fraumeni syndrome, which is an autosomal dominant cancer predisposition disorder caused by some p53 mutations, have increased oxidative phosphorylation of skeletal muscle (28). In line with this, there is a clinical trial (number NCT00406445) looking specifically at whether a mutated p53 gene causes metabolic changes in humans. In addition, the so-called p53 signature, indicator of higher ovarian cancer risk in BRCA patients due to the presence of a concomitant congenital p53 mutation in the normal cells, includes low body mass index at one of the associated risk factors in the signature together with low parity and others (29).
Given the cumulative evidence of p53 as a relevant metabolic regulator of adipose tissue and the recent renaissance of BAT research due to the discovery of its activity in adult humans, in the present study, we have assessed the specific physiological role of p53 in BAT.
Materials and Methods
Animals
Animal protocols were approved by the Committee at the University of Santiago de Compostela (Spain) and the German Institute of Human Nutrition Potsdam-Rehbrücke (Nuthetal, Germany). The experiments were performed in agreement with the Rules of Laboratory Animal Care and International Law on Animal Experimentation. Mice were housed in air-conditioned rooms (22°C-24°C) under a 12-hour light, 12-hour dark cycle. After weaning, mice were fed standard chow or a high-fat diet (HFD; 12451, 45% by energy, or D12492, 60% by energy; Research Diets) until the animals were killed. Homozygous wild-type (WT) and knockout (KO) mice were originated from heterozygous mating, so for each experiment, only littermate WT and KO animals were compared. WT and p53-null mice (C57BL/6J and 129/Sv background) were previously described (30, 31) and were housed in air-conditioned rooms (22°C-24°C) under a 12-hour light, 12-hour dark cycle. After weaning, mice were fed standard chow or a high-fat diet during 11 weeks (45% by energy; Research Diets). WT and Myf5-Cre driven p53 KO were fed standard chow or a high-fat diet (Research Diets 12451; 45% by energy; Research Diets) during 11 weeks.
To generate conditional KO mice for p53, animals expressing Cre-recombinase under control of the Myf5-promoter with C57BL6/129S4 background (strain number 007845; The Jackson Laboratory) were crossed to homozygous mice carrying a floxed allele of the Trp53 gene with FVB.129 background (strain number 01XC2; National Cancer Institute, Frederick Mouse Repository).
Drugs and treatments
The widely used p53 activator adriamycin (Doxorubicin) (32) was ip injected at different doses during 9 days in DIO mice previously fed a HFD during 2 months. Body weight and food intake were monitored and the phenotypic characterization was performed. In a separate experiment, adriamycin was also injected in WT and p53−/− mice during 9 days to test the specificity of the drug action. Finally, to test the contribution of the sympathetic nervous system (SNS), a specific antagonist of the β3-adrenergic receptor, SR59230A (3 mg/kg·d, twice daily; Tocris Bioscience Bristol) (33, 34), was administrated sc in an independent cohort of DIO mice during the course of the experiment (11 d).
Determination of body composition and energy balance
Whole-body composition was measured using nuclear magnetic resonance imaging (whole body composition analyzer; EchoMRI). Animals were monitored in a custom 12-cage indirect calorimetry, food intake and locomotor activity monitoring system (TSE LabMaster; TSE Systems) as previously described (35, 36). Mice were acclimated for 48 hours to the test chambers and then were monitored for an additional 48 hours. Data collected from the last 48 hours were used to calculate all parameters for which results are reported.
In vivo adenoviral gene transfer and green fluorescent protein (GFP) immunofluorescence
The adenoviral injection procedure was adapted from methods described previously (37). Male C57/BL6 WT mice were anesthetized by an ip injection of ketamine/xylacine cocktail mixture (ketamine 15 mg/kg body weight and xylazine 3 mg/kg body weight). Adenoviral vectors encoding GFP alone (Ad-GFP), double-mutant kinase dead p53 regulating kinase (DNTp53RK) acting as a dominant negative (the TP53RK clone was then mutated at g217a and a218t to E73M) that block p53 activation and function (Ad-DNp53RK) or overexpressing p53 (Ad-p53) (1 × 10¹⁰ PFU) (reference number SL100708, reference number SL115889, and reference number SL109638, respectively) were bilaterally injected in vivo into the BAT. Briefly, we made an incision in the skin at the level of the interscapsular area and carefully held BAT fat using tweezers. After that we injected adenovirus into the fat pad using a 1-cc syringe. Each virus was diluted using sterile saline and was injected in 50 μL of 10−9 PFU/fat pad.
To control for efficiency of infection, a group of injected animals were perfused with saline, fixed with commercial buffered formalin, and BAT pads dissected including broad margins. Samples were cryoprotected at 4°C in sacarose until floating, included in optimum cutting temperature and frozen at −20°C for at least 1 day. Twenty-micrometer sections were mounted in coated glass slides (Thermo) and dried at 37°C for 4 hours. Slides were mounted with GelMount (Biomeda) containing 20 μg/mL 4′,6-diamidino-2-phenylindole (DAPI; Sigma) to counterstain the nuclei. Photographs were obtained in a T-SP2 confocal microscope (Leica) equipped with three lasers. GFP was obtained by excitation at 480 nm and collecting at 500–550 nm; Hemo-containing proteins autofluorescence (mytochondria and muscle myoglobin) were obtained by excitation at 550 nm and collecting at 570–620 nm. DAPI was obtained by excitation at 350 nm and collecting at 450–500 nm.
Hematoxylin/eosin staining and Immunohistochemistry
After perfusion, BAT samples were postfixed in 10% formalin buffer for 24 hours and then dehydrated and embedded in paraffin by a standard procedure. Sections of 3 μm were prepared with a microtome and stained using a standard hematoxylin/eosin alcoholic (BioOptica) procedure according to the manufacturer's instructions (38). Alternative sections of paraffin were used for the immunohistochemistry detection of UCP1. Immunohistochemistry was performed as described (38, 39) using a rabbit anti-UCP1 (1:2000; Abcam). UCP1-positive cells were counted by using ImageJ-1.33 (National Institutes of Health, Bethesda, Maryland). Three to five animals per experimental group were used and four pictures per each image sections were analyzed.
Quantitative RT-PCR analysis
RNA was extracted using Trizol reagent (Invitrogen) according to the manufacturer's instructions. Two micrograms of total RNA were used for each reverse transcriptase reaction, and cDNA synthesis was performed using the SuperScript first-strand synthesis system (Invitrogen) and random primers as previously described (40). Negative control reactions, containing all reagents except the sample, were used to ensure specificity of the PCR amplification. For analysis of gene expression, we performed real-time RT-PCR assays using a fluorescent temperature cycler (TaqMan; Applied Biosystems) following the manufacturer's instructions. Five hundred nanograms of total RNA were used for each reverse transcriptase reaction. The PCR cycling conditions included an initial denaturation at 50°C for 10 minutes followed by 40 cycles at 95°C for 15 seconds and 60°C for 1 minute. The oligonucleotide specific primers are shown in Supplemental Table 1. For analysis of the data, the input value of gene expression was standardized to the 18S value for the sample group and expressed as a comparison with the average value for the control group. All samples were run in duplicate and the average values were calculated.
Western blot analysis
Western blots were performed as previously described (38, 39, 41) Briefly, total protein lysates from BAT (20 μg) were subjected to SDS-PAGE, electrotransferred onto a polyvinylidene difluoride membrane and probed with the indicated antibodies: p53 (number 2524), phospho-p53 (number 9284), and bone morphogenetic protein (BMP)-7 (number 4693) (Cell Signaling); Tp53RK (number ab37606), UCP1 (number ab10983), UCP3 (number ab3477), PRDM16 (number ab106410), β3-adrenoreceptor (number ab694506) and fibroblast growth factor 21 (FGF21) antibody (number ab64857) (Abcam), monoclonal anti-α-tubulin (number T5168) (Sigma-Aldrich). For protein detection we used horseradish peroxidase-conjugated secondary antibodies and chemiluminescence (Amersham Biosciences). Protein levels were normalized to α-tubulin for each sample. Cells were grown in multiwell 6 (160 000 cells/well) with the methodology described below. Dishes were washed, and cells were scraped in sodium dodecyl sulfate (1%) and boiled before lysis buffer addition. The samples were separated with SDS-PAGE (12%–8% polyacrylamide gels), transferred onto nitrocellulose, and probed with polyclonal/monoclonal antibodies.
Somatotroph cell line culture and transfection
Rat GH4C1 pituitary cell were cultured in DMEM plus 10% fetal calf serum. Transfection was performed with Amaxa (3.5 μg pRc and RET plasmids) (42). Transfected cells were seeded in full medium (50 000 cells/well in mw 24 dishes) for 24 hours being cotransfected with adenovirus TP53RK (dominant negative) from Sigma Gen: C20orf64, viral titer: 110 to 111 PFU/mL) and GFP, as control. A range of 1–50 multiplicity of infection (MOI) was used and after waiting overnight, cells were washed and cultured in DMEM 0.1% BSA (high grade BSA; Sigma) for 24–48 hours. Apoptosis was detected by Hoechst staining as described (43).
Data analysis and statistics
Values are plotted as the mean ± SEM for each genotype. Protein and mRNA data were expressed in relation (percentage) to control (vehicle or Ad-GFP treated) mice. Statistical analysis was performed using a Student's t test. A value of P < .05 was considered statistically significant.
Results
p53-null mice fed a standard diet do not show changes in body weight or adiposity
Age-matched male WT and p53-KO mice were maintained on a standard diet from 4 weeks of age for 8 weeks to assess their metabolic phenotypes. No differences were found in body weight or food intake (Figure 1, A and B) among the genotypes. Consistently, body composition (fat mass and nonfat mass) was not altered (Figure 1, C and D). Indirect calorimetry was used to determine both locomotor activity and energy expenditure. Both parameters remained unchanged when WT and p53-deficient mice were fed a standard diet (Figure 1, E and F).
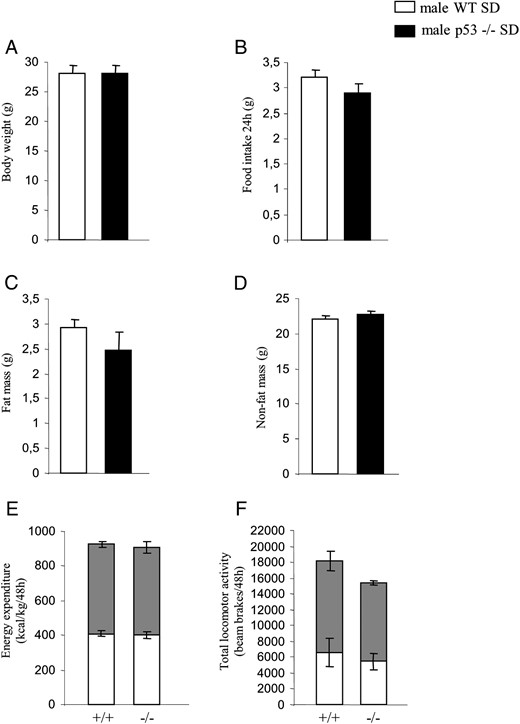
Metabolic phenotype of male p53-deficient mice fed a chow diet. A, Body weight of male mice after 10 weeks of free access to chow diet. B, Cumulative food intake over 24 hours. C, Fat mass. D, Nonfat mass. E, Forty-eight hours of total energy expenditure determined by indirect calorimetry. Measurements were taken every 45 minutes. Gray squares indicate lights-off. F, Locomotor activity during a 48-hour period (n = 7–8 per group).
p53-null mice fed a HFD have reduced body weight and adiposity
Age-matched male WT and p53-deficient mice were maintained on HFD from 4 weeks of age (45% kcal fat, 4.73 kcal/g) during 11 weeks to assess their metabolic phenotypes. The p53-null mice on a HFD gained significantly less body weight than their WT littermates (Figure 2A). Changes in body weight could not be explained by daily reductions in total food intake (Figure 2B). Body composition revealed that p53-null mice accrued less fat mass compared with WT mice after 11 weeks on a HFD with no changes in nonfat mass (Figure 2C). Energy expenditure levels were higher in p53-null mice than in WT mice in both light and dark phases (Figure 2D), and this increase was also evident when energy expenditure was corrected for lean mass (Figure 2E). Spontaneous locomotor activity (Figure 2F) and respiratory quotient (Figure 2, G-I) remained unchanged between WT and p53 KO mice fed a HFD. To investigate the potential mechanism responsible for increased energy expenditure in p53 KO mice fed a HFD, we analyzed in detail the functional status of BAT because it plays a key role in thermogenesis. BAT interscapular temperature was increased in p53 KO mice fed a HFD (Figure 2J), and analysis of histological sections revealed smaller lipid droplets in adipocytes of BAT from p53-deficient mice following a HFD (Figure 2K), suggesting higher thermogenic activity. Accordingly, we found higher protein levels of UCP1 (Figure 2L) and increased mRNA expression of UCP3 and Prdm16 (Figure 2M). Finally, to assess whether heat dissipation was altered in p53-null mice, we measured the surface temperature in the tail of the animals maintained at room temperature, but we failed to detect any significant differences between WT and p53-null mice (Figure 2N), suggesting that heat dissipation is not involved in heat conservation.
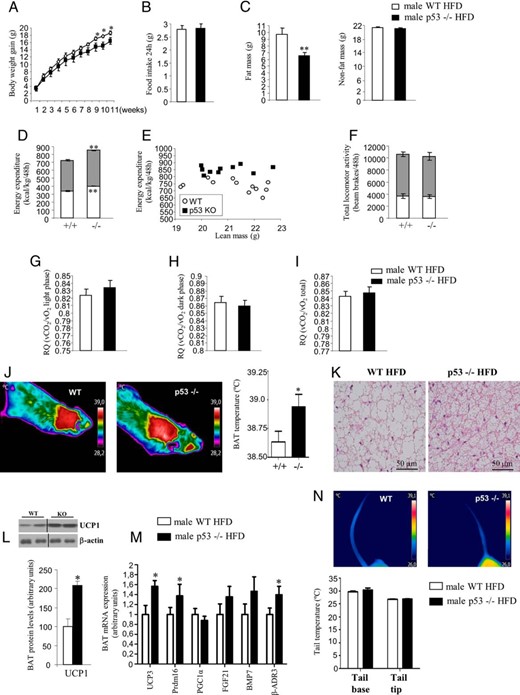
Metabolic phenotype and BAT metabolism of male p53 global-deficient mice fed a HFD. A, Body weight of male mice after 11 weeks of free access to HFD. B, Cumulative food intake over 24 hours. C, Fat mass and nonfat mass. D, Forty-eight hours of total energy expenditure determined by indirect calorimetry. Measurements were taken every 45 minutes. Gray squares indicate lights-off. E, Energy expenditure corrected by kilogram of nonfat mass (right panel). F, Locomotor activity during a 48-hour period. Respiratory quotient during light phase (G), dark phase (H), and mean over 24 hours (I, right panel). J, Representative pictures and BAT interscapular temperature in animals housed at room temperature. K, Representative pictures of BAT histology after 11 weeks of HFD. L, Protein levels of UCP1 in BAT of WT and p53-null mice. M, BAT mRNA expression of factors involved in thermogenesis: UCP3, Prdm16, PGC1α, FGF21, BMP7, and β-AR3. N, Representative pictures of tail temperature in animals housed at room temperature. Dividing lines indicate splicings in the figure. *, P < .05, **, P < .01, ***, P < .001 (n = 7–8 per group).
Conditional p53-null mice in BAT do not show changes in body weight or adiposity
Because the global p53-null mice are resistant to DIO, we next generated a conditional, Myf5-Cre-driven p53 KO to test the specific physiological role of BAT p53 on energy balance. As was shown previously, Myf5-Cre specifically targets progenitors, giving rise to the interscapular depots of BAT and skeletal muscle in addition to some minor depots of WAT (44–46). BAT expression of p53 was significantly lower in the BAT of Myf5-Cre driven p53 KO compared with littermate control mice not expressing Cre-recombinase (Figure 3A). In contrast to our expectation, these mice did not show any difference in body weight when fed a chow diet (Figure 3B) or HFD (Figure 3C). Consistent with this, body composition and BAT UCP1 expression remained unaltered between WT and Myf5-Cre driven p53 KO (Figures 3, D–F).
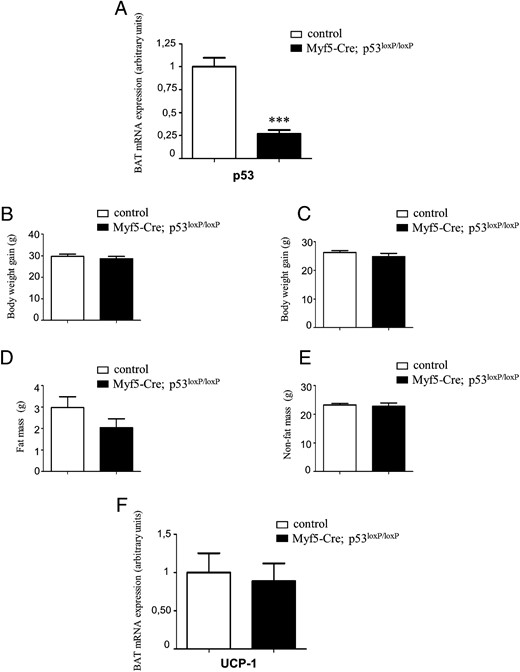
Metabolic phenotype of conditional, Myf5Cre-driven p53 KO mice. A, p53-mRNA expression in BAT from conditional KO mice (black bars; genotype: Myf5-Cre+/−; p53-lox+/+) and littermate controls (white bars; genotype: p53-lox+/+). B, Body weight gain of male mice maintained on a chow diet. C, Body weight gain of male mice maintained on a HFD. Fat mass (D) and nonfat mass (E) from mice maintained on a 45% HFD are shown. F, UCP1-mRNA expression in BAT. *, P < .05, **, P < .01, ***, P < .001 (n = 4–6 per group).
Genetic inhibition of p53 in the BAT of adult mice increases weight gain and decreases activity of BAT
Given that BAT emerges during fetal development, reaching maximum size close to birth and declining afterward (47), we next used virogenetic approaches to inhibit p53 acutely in the BAT of adult mice to avoid any possible compensatory mechanisms during fetal development. For this, we injected Ad-GFP alone or a mutant Tp53RK acting as a dominant negative (Ad-DNp53RK) that blocks p53 activation and function together with GFP in the BAT. Functional efficiency of the Ad-DNp53RK was studied also in vitro using one good model of p53-dependent action in the endocrine system, the pituitary somatotroph cells. It is well known that, in the absence of ligand glial cell line-derived neurotropic factor, the RET receptor in these cells induces apoptosis in a p53-dependent manner (43). This is reproduced in vitro when the pituitary somatotroph cell line GH4C1 is transfected with RET (43). RET-dependent apoptosis was not altered when cells were infected with the control Ad-GFP virus (Figure 4A). However, infection with DNTP53RK virus blocked RET-induced apoptosis in a dose-dependent manner (Figure 4A). DNTP53RK reduced p53 protein induction and Ser15-p53 phosphorylation in RET-transfected cells (Figure 4B).
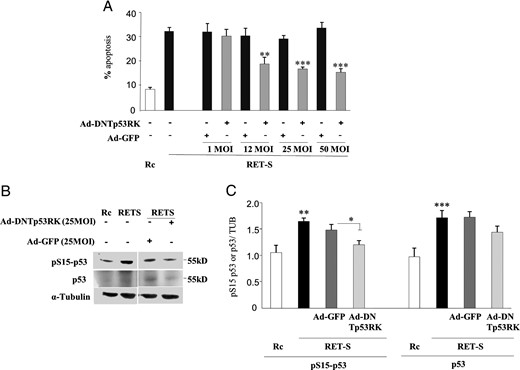
Functional inhibition of endogenous p53 through DNp53RK. A, Pituitary GH4C1 cells die of apoptosis when transfected with the RET-S receptor (black bars) but not with the empty vector (Rc; white bar) (see reference 37). Apoptosis is blocked when cells were previously infected with Ad-DNp53RK in a dose-response manner with increasing MOI units (1, 12, 25, 50 MOIs). Infection with control virus Ad-GFP did not alter RET-induced apoptosis. B, Expression of the RET-S receptor induces p53 expression and p53 activation as seen by serine 15 phosphorylation (pS15–p53). Infection with Ad-DNp53RK, but not Ad-GFP, blocks both p53 increase and activation. C, Quantitative evaluation of multiple Western blots showing significant reduction of p53 expression and activation in cells infected with Ad-DNp53RK, in relation with the apoptosis blockade. No change is observed in cells infected with Ad-GFP.
Once we determined that the p53 regulating kinase adenovirus was a reliable tool to decrease p53 activity, we sought to investigate its in vivo effects. The injections of the viral vectors were administered bilaterally into the two lobes of interscapular BAT (Figure 5A). The specificity of the injections was demonstrated by the visualization of GFP in BAT but not muscle and the colocalization of DAPI, GFP, and mitochondria in the BAT but not muscle after the local injection of Ad-GFP (Figure 5B). As expected, the levels of Tp53RK were significantly elevated, whereas the levels of phospho-p53 were inhibited in Ad-DNp53RK-treated animals compared with Ad-GFP-injected controls (Figure 5, C and D).
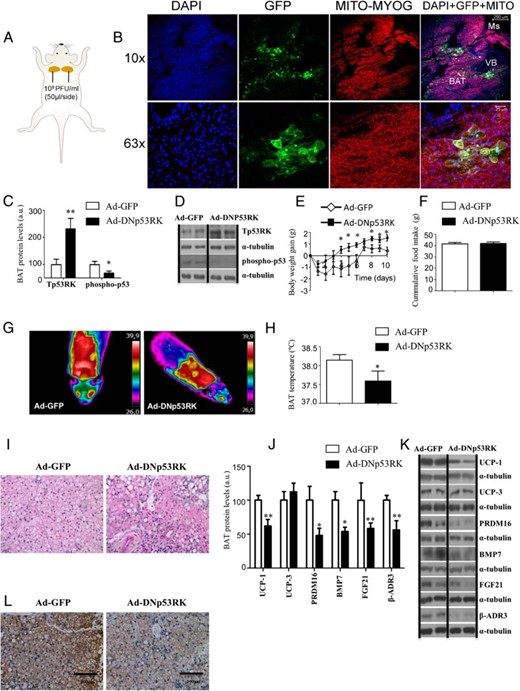
Metabolic phenotype and BAT metabolism in WT mice fed a chow diet after the genetic down-regulation of p53 specifically in BAT. A, Bilateral injections and doses of Ad-GFP or Ad-DNp53RK in the two lobes of BAT. B, Immunofluorescence of DAPI (blue), GFP (green), mitochondria (red), and colocalization of DAPI, GFP, and mitochondria in the BAT of mice after the local injection of Ad-GFP. GFP is not detected in muscle (Ms; myoglobin also fluorescent in red) or in the vessel bundle (VB; only positive for DAPI). C and D, Protein levels of Tp53RK and phospho-p53 after Ad-GFP and Ad-DNp53RK(−) delivery on BAT. E, Body weight gain of male WT mice on chow diet after 10 days after adenoviral inoculation. F, cumulative food intake. G, representative pictures of BAT interscapular temperature in animals housed at room temperature. H, BAT temperature. I, Representative pictures of BAT histology. J and K, Protein levels of UCP1 UCP3, Prdm16, BMP7, FGF21, and β-AR3 after Ad-GFP and Ad-DNp53RK(−) delivery on BAT. L, Representative pictures of BAT UCP1 immunohistochemistry. Divided lines indicate splicings in the figure. *, P < .05, **, P < .01, ***, P < .001 (n = 7–8 per group).
The inactivation of p53 in BAT was sufficient to induce a mild but significant body weight gain in adult mice fed a standard diet (Figure 5E). The increased weight gain was not accompanied by changes in food intake (Figure 5F). The inactivation of p53 in BAT significantly decreased the BAT interscapular temperature (Figure 5, G and H) and increased the size of the lipid droplets in the BAT (Figure 5I). Consistent with these data, we also found decreased protein levels of the thermogenic markers UCP1, PRDM16, BMP7, and FGF21 as well as a down-regulation of β-adrenoreceptor 3 (β-AR3) (Figure 5, J and K). The lower protein levels of BAT UCP1 after the inactivation of p53 in BAT were also corroborated by immunohistochemistry (Figure 5L).
Genetic overexpression of p53 in BAT ameliorates obesity in adult mice by induction of BAT thermogenic activity
Because the acute inhibition of p53 in the BAT of adult mice induces weight gain and decreases BAT thermogenic activity, we hypothesized that the specific overexpression of p53 in the BAT of obese mice might be sufficient to increase the BAT thermogenic activity and to ameliorate weight gain. For this, we injected adenoviruses encoding either Ad-GFP or Ad-p53+ together with GFP in the BAT. The efficiency of adenoviruses overexpressing p53 was demonstrated by increased levels of phosphorylated p53 (Figure 6, A and B). The overexpression of p53 in the BAT of obese mice decreased body weight (Figure 6C) and adiposity (Figure 6E) without changes in food intake (Figure 6D) or nonfat mass (Figure 6F) compared with control-injected viral vectors. In line with the decreased body weight, we found that the overexpression of p53 in the BAT significantly increased the BAT interscapular temperature (Figure 6, G and H) and decreased the size of the lipid droplets in the BAT (Figure 6I). Consistent with these data, we also found increased protein levels of the thermogenic marker UCP1 as well as an up-regulation of β-AR3 (Figure 6, J and K). The higher UCP1 protein levels in BAT after local overexpression of p53 were also corroborated by immunohistochemistry (Figure 6L).
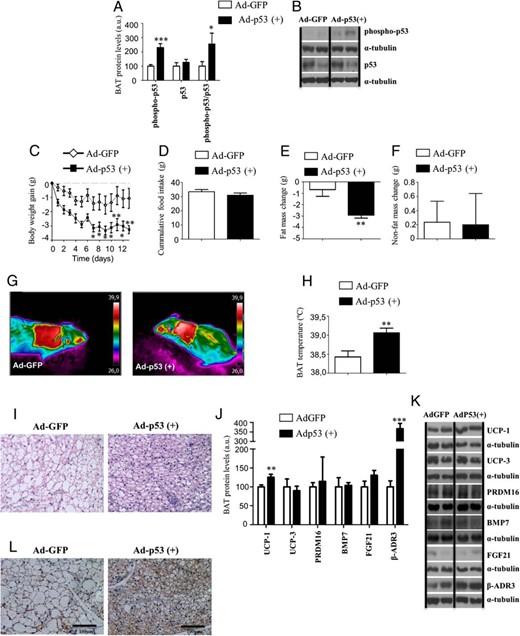
Metabolic phenotype and BAT metabolism in WT mice fed a HFD after genetic overexpression of p53 specifically in BAT. A and B, Phospho-p53 and p53 ratio in BAT of adult obese WT mice after Adp53(+) delivery compared with Ad-GFP controls. C, Body weight gain of male WT mice on HFD after 13 days after adenoviral inoculation. D, Cumulative food intake. E, Fat mass. F, Nonfat mass. G, Representative pictures of BAT interscapular temperature in animals housed at room temperature. H, BAT temperature. I, Representative pictures of BAT histology. J and K, Protein levels of UCP1 UCP3, Prdm16, BMP7, FGF21, and β-AR3 after Ad-GFP and AdP53(+) delivery on BAT. L, Representative pictures of BAT UCP1 immunohistochemistry. Divided lines indicate splicings in the figure. *, P < .05, **, P < .01, ***, P < .001 (n = 7–8 per group).
Pharmacological stimulation of p53 ameliorates obesity in DIO mice
Because the acute genetic manipulation of p53 in the BAT of adult mice regulates weight gain and BAT activity, we next tested the effects of the pharmacological stimulation of p53. For this end, we injected different doses of a specific p53 agonist named adriamycin in DIO mice during 9 days and found that it decreased body weight (Figure 7A) independent of changes in food intake (Figure 7B).
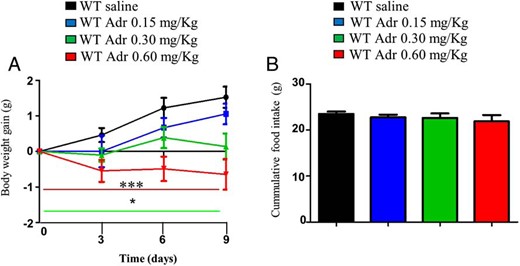
Pharmacological stimulation of p53 reduces weight gain in DIO mice and stimulates BAT activation. A, Body weight of male mice treated with adriamycin during 9 days and with free access to HFD. B, Cumulative food intake in mice with free access to HFD treated with vehicle or adriamycin. The red and green lines below indicate significant differences in the correspondent groups when compared to WT saline. *, P < .05, **, P < .01, ***, P < .001 (n = 7–8 per group).
p53 agonism ameliorates obesity in DIO mice by activation of SNS
The control of BAT thermogenesis is regulated by the SNS, thought the β-adrenergic receptors. As we described above, WT mice treated with either Ad-DNp53RK or Adp53(+) specifically in BAT has decreased and increased, respectively, the levels of β3-asdrenergic receptor (β3-Adr), probably indicating that changes in thermogenesis are driven by the SNS. In order to corroborate this, we treated mice with a β3-Adr antagonist (SR59230A) together with adriamycin. We found that pharmacological stimulation of p53 reduced HFD-induced weight gain. However, when the selective β-3 receptor antagonist SR59230A was coadministered with adriamycin, this effect was blocked (Figure 8A) without changes in food intake (Figure 8B). In line with these changes in body weight, the actions of SR59230A were expanded to BAT because the increased UCP1 staining in mice treated with adriamycin was also blunted by SR59230A (Figure 8C).

Pharmacological stimulation of p53 with adriamycin blunts HFD-induced weight gain via the SNS. A, Body weight of male mice treated with adriamycin (11 d) and β3-Adr antagonist (SR59230A) with free access to HFD. B, Cumulative food intake over 24 hours. C, Representative pictures of BAT UCP1 immunohistochemistry of male mice treated with adriamycin (11 d) and β3-Adr antagonist (SR59230A) with free access to HFD. *, P < .05, **, P < .01, ***, P < .001 (n = 6–8 per group).
Pharmacological stimulation of p53 ameliorates obesity in WT mice but not in p53 null mice
To know whether the metabolic actions of adriamycin are specifically mediated by p53, we treated both WT and p53 null mice with the p53 agonist. Although adriamycin decreased weight gain in WT mice (Figure 9A) independent of food intake (Figure 9B), no differences were found in body weight or food intake in p53 null mice (Figure 9, C and D). In addition, the effects of adriamycin in BAT lipid droplets and UCP1 staining failed to occur in p53-null mice (Figure 9, E and F).
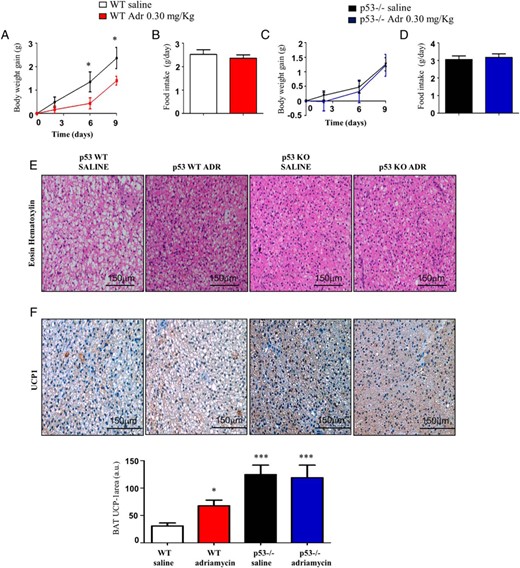
The effects of adriamycin on body weight and BAT metabolism are blocked in p53-null mice. A and B, Body weight gain and cumulative food intake of male WT mice and (C and D) p53-null mice on HFD after 9 days of adriamycin treatment. E, Representative pictures of BAT histology of male WT mice and p53 null mice. F, Representative pictures of BAT UCP1 immunohistochemistry after adriamycin treatment of male WT mice and p53 null mice. *, P < .05, **, P < .01, ***, P < .001 (n = 6 per group).
Discussion
Our current data demonstrate that global p53-null mice challenged with HFD gain less weight and fat mass before they develop any sign of tumor incidence. These features may be explained by the higher energy expenditure and the increased BAT thermogenic activity, which is consistent with earlier observations (27). However, this metabolic phenotype is not reproduced when p53 is specifically manipulated in the BAT. For instance, the lack of p53 in BAT in embryonic stages does not protect against DIO, and the genetic manipulation of p53 specifically in the BAT of adult mice shows opposite results to global p53-null mice. More specifically, the inhibition of BAT p53 caused a mild increase in body weight, decreased BAT activity, and lower expression of thermogenic markers in BAT. However, the overexpression of p53 in the BAT of DIO mice decreased body weight, increased BAT activity, and up-regulated UCP1 levels. In keeping with these results, the pharmacological stimulation of p53 ameliorates obesity in DIO mice by the activation of BAT thermogenesis via the SNS. Importantly, these changes in BAT activity are not related with an alteration in heat dissipation.
Although p53 has been exhaustively studied as a tumor suppressor (48), it also plays an important role in different biological functions including longevity, stress, aging (49), and metabolism (18, 19). p53 is activated in metabolic tissues during dietary and genetically-induced obesity (20, 50) and the lack of p53 in WAT results in profound alterations in insulin sensitivity (21, 51). The metabolic phenotype of global p53-null mice is, however, controversial because one report found that p53-deficient mice gained more weight compared with WT mice and had lower levels of UCP1 in BAT (23), whereas another report showed that these mice were resistant to DIO and had higher levels of UCP1 in both BAT and WAT (27). Our results are in agreement with the latter study because we found that p53-null mice gained less weight when fed a HFD, showed increased energy expenditure, and had higher BAT UCP1 levels than their littermates. All these changes are independent of food intake, respiratory exchange ratio, locomotor activity, or energy dissipation. Therefore, these findings suggest that energy is dissipated to generate heat in the BAT. In addition to the possible explanations for these opposite results, which have been already discussed in detail (27), p53 is ubiquitously expressed, and therefore, it seems plausible to hypothesize that to investigate the tissue-specific role for p53 is essential for the accurate understanding of its metabolic actions.
Herein we have focused on the metabolic action of p53 in BAT because this is an important metabolic organ with increasing functional relevance in human adults (7, 52). Therefore, we first generated a conditional mouse model in which p53 is ablated in progenitors of the developing BAT, but contrary to our expectations, we found that these mice were phenotypically indistinguishable from their WT littermates. The fact that mice lacking p53 in BAT were not resistant to HFD as observed in the global p53-null mice indicates that tissues other than BAT are necessary to explain the DIO resistance in the global KO model. In this sense, a previous report indicates that p53 interacts with the proopiomelanocortin promoter centrally (53), and it is well known that the central melanocortin system is a powerful regulator of food intake and energy expenditure. The fact that β-AR3 expression is increased in the BAT of p53 global KO mice compared with WT littermates suggests that the SNS tone is increased in p53-null mice. This means that the metabolic phenotype of p53-null mice might be explained, at least partially, by the central effects of p53. Indeed, there are many examples in which the ablation of a gene in embryonic stages does not cause any alteration on growth or feeding in the adult. This is a very common feature in metabolism because energy balance is controlled by complex and redundant systems in which compensatory mechanisms have overlapping functions and has been described previously in the context of brown adipogenesis (46). Therefore, we next performed gain-and-loss-of-function studies silencing and overexpressing p53 in the BAT of adult mice to address a more acute regulatory role of p53. These experiments showed that the inhibition of p53 in BAT caused a mild increase in body weight and a reduction in BAT activity, whereas the overexpression of p53 in the BAT of DIO mice reduced body weight and increased BAT activity. Therefore, these results indicate again that the metabolic phenotype of global p53-null mice fed a HFD cannot be explained by the specific effects of p53 in BAT. These experiments using virogenetic approaches in adult mice suggest that p53 deficiency leads to abnormalities in BAT activity, an observation that is in line with a previous report indicating that the loss of p53 activity impairs brown adipocyte differentiation (23). These findings are also in agreement with the reduced weight gain and adiposity after the pharmacological stimulation of p53 using adriamycin (32).
Our in vivo results indicate also that the dysfunction of BAT activity after p53 inactivation is related to the reduced action of the SNS because we detect diminished levels of β-AR 3 in the BAT in which p53 was inhibited. Consistently, p53 overexpression in BAT induces β-AR3 levels. An intact SNS is essential to maintain BAT activation, as evidenced by previous reports indicating that interruption of the sympathetic nerves leading to BAT activation reduced metabolic BAT activity, and the administration of propranolol, a β-adrenoreceptor antagonist, also diminished BAT activity (13, 54, 55). Our results demonstrating that a β-AR3 antagonist blocks the effects of adriamycin on body weight, adiposity, and BAT activity supports the importance of the SNS as a mediator of the actions of p53 in BAT.
Antibody Table
| Peptide/Protein Target | Antigen Sequence (if Known) | Name of Antibody | Manufacturer, Catalog Number, and/or Name of Individual Providing the Antibody | Species Raised (Monoclonal or Polyclonal) | Dilution Used |
|---|---|---|---|---|---|
| Tp53RK | Anti-Tp53RK | Abcam, ab37606 | Rabbit, polyclonal | 1:500 | |
| p53 | p53 (1C12) mouse mAb | Cell Signaling, 2524 | Mouse, monoclonal | 1:1000 | |
| Phospho-p53 | Phospho-p53 (Ser15) antibody | Cell Signaling, 9284 | Rabbit, polyclonal | 1:500 | |
| BMP7 | BMP7 antibody | Cell Signaling, 4693 | Rabbit, polyclonal | 1:1000 | |
| UCP1 | Anti-UCP1 antibody | Abcam, ab10983 | Rabbit, polyclonal | 1:10 000 | |
| PRDM16 | Anti-PRDM16 antibody | Abcam, ab106410 | Rabbit, polyclonal | 1:1000 | |
| β3-Adr | Anti-β 3 adrenergic receptor antibody | Abcam, ab94506 | Rabbit, polyclonal | 1:1000 | |
| FGF21 | Anti-FGF21 antibody | Abcam, ab64857 | Rabbit, polyclonal | 1:1000 | |
| α-Tubulin | Monoclonal anti-α-tubulin | Sigma Aldrich, T5168 | Mouse, monoclonal | 1:10 000 |
Abbreviation: mAb, monoclonal antibody.
Taken together, our findings corroborate that p53-deficient mice are protected from DIO, an effect that is mediated by the increased energy expenditure and BAT thermogenic activity. However, our in vivo results show for first time the following: 1) the ablation of p53 in BAT during embryogenesis does not alter energy balance in mice, 2) the inhibition of p53 in the BAT of adult mice impairs BAT activity, 3) the overexpression of p53 in the BAT of adult mice enhances BAT activity and causes weight loss in DIO mice, and 4) the pharmacological stimulation of p53 reduces weight gain in DIO mice by activation of BAT function through the SNS.
These results reveal also that p53 regulates BAT metabolism coordinating body weight and thermogenesis, but its metabolic actions are tissue specific and depend on its manipulation in embryonic or adult stages and suggest that p53 might be a potential target in the treatment of obesity and metabolic syndrome.
Acknowledgments
This work was supported by grants from Ministerio de Economia y Competitividad Grants BFU2013-46109 (to C.V.A.), BFU2011 (to C.D.), and BFU2012-35255 (to R.N.); Xunta de Galicia Grants R2014/050 (to C.V.A.), EM 2012/039, and 2012-CP069 (to R.N.); Instituto de Salud Carlos III Grant PI12/01814 (to M.L.); and Centro de Investigación Biomédica en Red de Fisiopatología de la Obesidad y Nutrición. The Centro de Investigación Biomédica en Red de Fisiopatología de la Obesidad y Nutrición is an initiative of the Instituto de Salud Carlos III of Spain, which is supported by Fondo Social Europeo of the European Community funds. The European Community's Seventh Framework Programme supported this work under Grants FP7/2007-2013 (number 245009) from NeuroFAST (to C.D. and R.N.), and Grant ERC-2011-StG-OBESITY53-281408 (to R.N.). The research leading to these results has received funding from the European Community's Seventh Framework Programme (FP7/2007-2013) under Grant 245009 and the National Development Agency (Grant BONUS HU 08/2-2011-0006). M.Q. is a recipient of a postdoctoral fellowship from the Galician Government (Xunta de Galicia Grant ED481B2014/039-0). O.A.-M. is supported by the Instituto de Salud Carlos III/Servicio Galego de Saude (SERGAS) through Research Contract “Sara Borrell” (CD14/00091). T.J.S. is supported by the German Research Foundation (DFG Grant SCHU 2445/2-1) and the European Research Council (Grant ERC-2012-StG-AgeingStemCellFate-311082). T.J.S. is also supported by the German Center for Diabetes Research.
Disclosure Summary: The authors have nothing to disclose.
Abbreviations
- Ad-GFP
adenoviral vectors encoding GFP alone
- β-Adr
β3-adrenergic receptor
- β-AR3
β-adrenoreceptor 3
- BAT
brown adipose tissue
- BMP
bone morphogenetic protein
- DAPI
4′,6-diamidino-2-phenylindole
- DIO
diet-induced obesity
- FGF21
fibroblast growth factor 21
- GFP
green fluorescent protein
- HFD
high-fat diet
- KO
knockout
- MOI
multiplicity of infection
- SNS
sympathetic nervous system
- UCP1
uncoupling protein 1
- WAT
white adipose tissue
- WT
wild type.
References
Author notes
O.A.-M. and B.P. contributed equally to this work.
