


Abstract
Leptin treatment has beneficial effects on plasma lipids in patients with lipodystrophy, but the underlying mechanism is unknown. Proprotein convertase subtilisin/kexin type 9 (PCSK9) decreases low-density lipoprotein (LDL) clearance, promotes hypercholesterolemia, and has recently emerged as a novel therapeutic target. To determine the effect of leptin on PCSK9, we treated male and female ob/ob mice with leptin for 4 days via sc osmotic pumps (∼24 μg/d). Leptin reduced body weight and food intake in all mice, but the effects of leptin on plasma PCSK9 and lipids differed markedly between the sexes. In male mice, leptin suppressed PCSK9 but had no effect on plasma triglycerides or cholesterol. In female mice, leptin suppressed plasma triglycerides and cholesterol but had no effect on plasma PCSK9. In parallel, we treated female lipodystrophic patients (8 females, ages 5–23 y) with sc metreleptin injections (∼4.4 mg/d) for 4–6 months. In this case, leptin reduced plasma PCSK9 by 26% (298 ± 109 vs 221 ± 102 ng/mL; n = 8; P = .008), and the change in PCSK9 was correlated with a decrease in LDL cholesterol (r2 = 0.564, P = .03). In summary, in leptin-deficient ob/ob mice, the effects of leptin on PCSK9 and plasma lipids appeared to be independent of one another and strongly modified by sex. On the other hand, in lipodystrophic females, leptin treatment reduced plasma PCSK9 in parallel with LDL cholesterol.
Leptin plays a critical role in metabolic regulation: it decreases food intake, increases energy expenditure, enhances insulin sensitivity, and inhibits hepatic lipogenesis and fatty acid uptake (1). Consequently, patients with defects in leptin action, due to either a mutation in the leptin gene or a deficiency in circulating leptin, such as in lipodystrophy, manifest severe hyperphagia, insulin resistance, and hepatic steatosis (2). In addition, these patients exhibit dyslipidemia with hypertriglyceridemia, elevated total and low-density lipoprotein (LDL) cholesterol, and reduced high-density lipoprotein (HDL) cholesterol levels (3). In clinical studies, leptin treatment decreases triglycerides and has also been shown to reduce LDL and total cholesterol (4–7). The effect of leptin on plasma triglycerides has been ascribed to improved insulin sensitivity (8, 9). However, the mechanisms underlying the reduction of LDL are unclear. Given the central role of LDL in increasing the risk of cardiovascular disease (10), it is important to understand how leptin regulates LDL cholesterol.
One potential mediator of leptin's effect on LDL is proprotein convertase subtilisin/kexin type 9 (PCSK9). PCSK9 promotes degradation of the LDL receptor (LDLR), resulting in reduced LDL clearance (11–13). Thus, gain-of-function PCSK9 variants lead to elevated levels of LDL cholesterol, whereas loss-of-function PCSK9 mutations are associated with reductions in both LDL cholesterol and cardiovascular disease risk (14). Therapies targeting PCSK9 are now available and show great promise (15). Defining the endogenous regulators of PCSK9 is an important step towards understanding the biology of this molecule.
Here, we studied the effects of leptin treatment on plasma PCSK9 in leptin-deficient ob/ob male and female mice, and in lipodystrophic female patients. We found that the effects of leptin on PCSK9 and plasma lipids in ob/ob mice were sex-dependent, with no correlation between plasma PCSK9 and plasma cholesterol; in contrast, leptin treatment suppressed PCSK9 in parallel with LDL cholesterol in female lipodystrophic patients.
Materials and Methods
Animal studies
Leptin treatment of ob/ob mice
Male and female ob/ob mice were purchased from The Jackson Laboratory and acclimated for 2 weeks before the study. They were maintained in a twelve-hour light/dark cycle (7 am to 7 pm) with standard chow and water ad libitum. Mice were implanted with sc osmotic pumps (1007D; Alzet) containing either PBS or recombinant mouse leptin (24 μg/d; National Hormone and Peptide Program, Harbor-UCLA Medical Center) for 4 days. Two days after pump implantation, 4-hour fasting glucose was obtained. Four days after pump implantation, mice were killed in the nonfasted state at 2 pm. All animal experimentation described above was conducted in accord with accepted standards of humane animal care, and all procedures were approved by the Institutional Animal Care and Research Advisory Committee at Boston Children's Hospital.
Plasma PCSK9 and plasma lipid analysis
Mouse plasma PCSK9 levels were measured by ELISA (MLB International), and plasma total cholesterol and triglyceride levels were measured by colorimetric assays (Thermo Scientific) according to the manufacturer's instructions. Size-exclusion liquid chromatography analysis of plasma cholesterol lipoprotein distribution was performed by the Lipid, Lipoprotein and Atherosclerosis Analysis Core Laboratory at Wake Forest University.
RNA isolation and gene expression analysis
Total RNA from liver tissues was extracted and purified using an RNeasy kit (QIAGEN). Reverse transcription was performed according to the manufacturer's protocol (Applied Biosystems). The resulting cDNA was diluted 10-fold and used for real-time PCR analysis with SYBR green (Thermo Scientific) in an Applied Biosystems 7900 HT or 7000 instrument. Results were normalized to TATA-box binding protein (Tbp) gene or to 18s ribosomal RNA (18s). The value of the control group was set to 1. Primer sequences are listed in Supplemental Table 1.
Western blotting
Liver lysates were prepared by homogenizing 50 mg of liver in 50mM Tris (pH 7.5), 150mM NaCl, 1mM EDTA, 1% nonylphenoxypolyethoxylethanol-40, 0.5% sodium deoxycholate, 0.3% sodium dodecyl sulfate, 10mM NaF, 10mM Na3VO4, 10mM sodium β-glycerophosphate, and protease inhibitor (Roche) and centrifuging at 13 000g for 10 minutes at 4°C. Protein was measured by a bicinchoninic acid assay kit (Pierce). The sample (100 μg) was subjected to SDS-PAGE and transferred to a polyvinylidene fluoride membrane (Immobilon). After 1 hour in SuperBlock blocking buffer (Pierce), blots were incubated overnight with a primary antibody (1:1000 dilution). Primary antibodies used included the following (Table 1): stearoyl-coenzyme A (CoA) desaturase 1 (SCD1) (sc-14720; Santa Cruz Biotechnology, Inc), 3-hydroxy-3-methylglutaryl-CoA reductase (HMGCR) (sc-27578; Santa Cruz Biotechnology, Inc), fatty acid synthase (FASN) (ab22759; Abcam), farnesyl diphosphate synthase (FDPS) (ab38854; Abcam), acetyl-CoA carboxylase (ACC) (04-322; EMD Millipore), LDLR (ab30532, Abcam; and a gift from Dr Alan Attie) (16), β-actin (sc-47778; Santa Cruz Biotechnology, Inc), and α-tubulin (2125; Cell Signaling Technology). Secondary antibodies conjugated with horseradish peroxidase (31430 and 31460, Pierce; sc-2768, Santa Cruz Biotechnology, Inc) and enhanced chemiluminescence reagents (Thermo Scientific) were used to develop blots. Bands were quantified by ImageJ software. All values were normalized to actin or tubulin, and the control (vehicle) ratio was set to 1.
Antibody Table
| Peptide/Protein Target | Antigen Sequence (if Known) | Name of Antibody | Manufacturer, Catalog Number, or Name of Source | Species Raised in; Monoclonal or Polyclonal | Dilution Used |
|---|---|---|---|---|---|
| SCD1 | Unknown | SCD1 antibody | Santa Cruz Biotechnology, Inc, sc-14720 | Goat; polyclonal | 1:1000 |
| HMGCR | Unknown | HMGCR antibody (C-18) | Santa Cruz Biotechnology, Inc, sc-27578 | Goat; polyclonal | 1:1000 |
| FASN | Unknown | Anti- FASN antibody | Abcam, ab22759 | Rabbit; polyclonal | 1:1000 |
| FDPS | Unknown | Anti-FDPS antibody | Abcam, ab38854 | Rabbit; polyclonal | 1:1000 |
| ACC | Unknown | Anti- ACC 1 antibody | EMD Millipore, 04-322 | Rabbit; monoclonal | 1:1000 |
| LDLRa | Unknown | Rabbit | 1:1000 | ||
| LDLR | SVADTKGVKRRTL | Anti-LDLR antibody | Abcam, ab30532 | Rabbit; polyclonal | 1:1000 |
| Pol II antibody | Unknown | Pol II antibody (H-224) | Santa Cruz Biotechnology, Inc, sc-9001 | Rabbit; polyclonal | 2 μg |
| Rabbit IgG | Unknown | Normal rabbit IgG | Santa Cruz Biotechnology, Inc, sc-2027 | Rabbit | 2 μg |
| β-Actin | Unknown | β-Actin antibody (C4) | Santa Cruz Biotechnology, Inc, sc-47778 | Mouse; monoclonal | 1:1000 |
| α-Tubulin | Unknown | α-Tubulin, (11H10) antibody | Cell Signaling Technology, 2125 | Rabbit; monoclonal | 1:1000 |
A gift from Dr Alan Attie (16).
Chromatin immunoprecipitation assays in mouse liver
Chromatin immunoprecipitation assays were performed as previously described (17, 18). Briefly, mouse livers were finely minced and incubated in PBS solution containing 1% formaldehyde at room temperature for 15 minutes. The reaction was stopped by adding glycine to 125mM for 5 minutes. Cells were resuspended in hypotonic buffer (10mM KOH-HEPES [pH 7.9], 1.5mM MgCl2, 10mM KCl, 0.2% Nonidet P-40, 0.15mM spermine, 0.5mM spermidine, 1mM EDTA, and 5% sucrose) and lysed by homogenization with a Dounce homogenizer. The cell lysate was layered on a sucrose cushion buffer (10mM Tris-HCl, [pH 7.5], 15mM NaCl, 60mM KCl, 0.15mM spermine, 0.5mM spermidine, 1mM EDTA, and 10% sucrose). Nuclei were pelleted by centrifugation and resuspended in sonication buffer (50mM Tris-HCl, [pH 8.0], 2mM EDTA, and 0.75% SDS). The samples were sonicated to reduce DNA length to between 200 and 1000 bp. After centrifugation at 13 000g for 10 minutes, 2 volumes of dilution buffer (2mM EDTA, 200mM NaCl, 20mM Tris-HCl [pH 8.0], 1% Triton X-100, and 0.1% sodium deoxycholate) were added. The chromatin sample was precleared followed by incubation with 2 μg of antisera against normal rabbit IgG (sc-2027), or polymerase II (sc-9001X) at 4°C overnight. The immune complex was collected by centrifugation after incubation with protein A/G agarose beads (sc-2003). The beads were washed, the bound chromatin was eluted, and the genomic DNA was purified and quantified by real-time polymerase chain reaction using primers specific to Pcsk9 and Fasn promoters. The DNA in the immunoprecipitate was normalized to the input, with the value of the vehicle-treated livers immunoprecipitated with IgG set to 1.
Human studies
Subjects
Subjects were enrolled in an open-label, prospective study examining the effects of recombinant human methionyl leptin (metreleptin; Bristol Myers Squibb and Astra Zeneca) replacement on metabolic and hormonal derangements in patients with congenital or acquired lipodystrophy (ClinicalTrials.gov identifier NCT00025883) (7). The dose of self-administered metreleptin (via sc injection) was adjusted over time for each patient to optimize triglycerides and hemoglobin A1c, while minimizing excessive weight loss. The average daily dose of metreleptin at the end of 4–6 months was approximately 4.4 mg/d. The study was approved by the National Institute of Diabetes and Digestive and Kidney Diseases Institutional Review Board.
In this ancillary study, we included only patients who had available plasma samples, both pre- and postleptin treatment, and who were not taking lipid-lowering drugs. The latter was done to avoid the confounding effects of these medications on PCSK9 (17–19).
Study procedures
Oral glucose tolerance tests (OGTTs) were performed at baseline and after 4–6 months of leptin administration. During each visit, after an overnight fast, patients underwent an OGTT with plasma samples obtained at baseline and 30, 60, 90, 120, and 180 minutes after glucose ingestion for the measurement of glucose, insulin, and C-peptide concentrations. Insulin sensitivity was calculated from the OGTT as the oral glucose insulin sensitivity (OGIS) index, using the 2-hour OGIS equation. This method provides a surrogate measure of insulin sensitivity that is an estimate of the glucose clearance during a euglycemic-hyperglycemic clamp, expressed in mL/min · m2 body surface area (20).
Serum leptin levels were determined by immunoassay with the use of a commercial kit (Linco Research). Human plasma PCSK9 levels were measured by ELISA (MLB International). All other measurements were done in the NIH Clinical Center laboratory using standard methodology.
Statistics
Human studies
Descriptive statistics are reported as mean ± SD. One-sample t tests were used to assess changes from baseline to postleptin therapy. Nonnormally distributed variables were logarithmically transformed and nonparametric tests were used if normality was not attained. Associations between change in PCSK9 and change in continuous variables were assessed using Pearson correlation and testing for zero correlation. All tests were performed at 2-sided α-level of 0.05. IBM SPSS (version 21.0) software was used for all analyses.
Mouse studies
Differences between groups were assessed by a 2-tailed, unequal variance, Student's t test.
Data are presented as the means ± SEM unless otherwise indicated. All studies were validated in a second, independent cohort.
Results
Leptin treatment of male mice suppresses PCSK9
Twelve-week old male ob/ob mice were administered leptin (24-μg/d recombinant leptin) or vehicle (PBS) sc, through an osmotic pump, for 4 days. As expected, leptin treatment decreased body weight and food intake and also tended to lower blood glucose and liver weight (Figure 1, A–D). In parallel, leptin treatment reduced plasma PCSK9 protein by 90% (Figure 1E). Surprisingly, however, the decrease in PCSK9 was not associated with an increase in LDLR protein: LDLR protein was decreased by 47%, Ldlr mRNA was decreased by 80%, and inducible degrader of the LDLR (Idol), another gene that promotes degradation of the LDLR (21), was not altered (Figure 1, F–H). Moreover, neither plasma triglycerides, cholesterol, nor the proportion of cholesterol present in the LDL fraction, were reduced with leptin treatment (Figure 1, I and J, and Supplemental Figure 1).
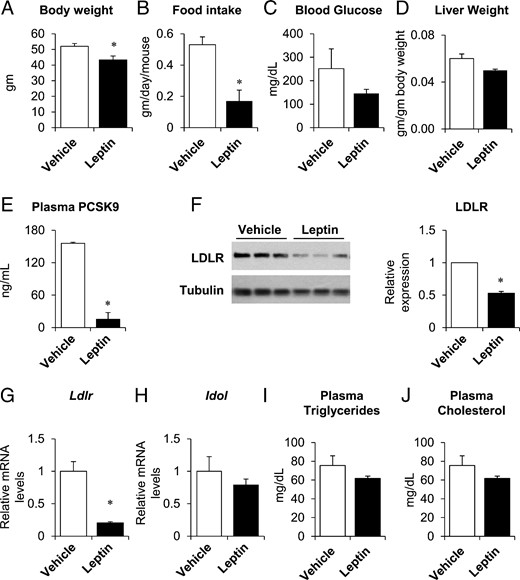
Leptin treatment suppressed PCSK9 expression in male ob/ob mice. Twelve-week-old male, ob/ob mice were implanted with sc pumps containing either vehicle or leptin (24 μg/d). Body weight (A), food intake (B), and liver weights (D) were measured at time of killing, 4 days after pump implantation. Fasting blood glucose (C) was measured after a 4-hour fast, 2 days after implantation. Plasma PCSK9 (E), triglycerides (I), and total cholesterol (J) were measured in nonfasted plasma taken at the time of killing. Hepatic LDLR protein expression was measured by immunoblotting (F, left); band intensities were quantified by densitometry, normalized to tubulin, and expressed relative to vehicle-treated mice (F, right). Hepatic gene expression of Ldlr and Idol was measured by real-time PCR, normalized to Tbp, and expressed relative to vehicle-treated mice (G and H). Data are presented as mean ± SEM and are representative of 2 independent experiments. *, P ≤ .05 compared with vehicle treatment, Student's t test; n = 3–5/group.
The reduction in plasma PCSK9 was associated with a 93% reduction in hepatic Pcsk9 mRNA (Figure 2A). In parallel, DNA Polymerase II promoter occupancy of the Pcsk9 promoter was reduced by 60%, consistent with a decrease in Pcsk9 transcription (Supplemental Figure 2). Several transcription factors have been implicated in the regulation of Pcsk9, including sterol regulatory element-binding protein (SREBP)-1c, SREBP-2, and hepatocyte nuclear factor-1α (22–25). Leptin treatment decreased Srebp-1c and its lipogenic targets, Acc, Fasn, and Scd1, by 50%–95% (Figure 2B). Leptin also suppressed the cholesterologenic genes, Hmgcr, Fdps, and farnesyl diphosphate farnesyl transferase 1 (Fdft1), which are targets of SREBP-2 (Figure 2C). Srebp-2 mRNA levels, however, were not changed with leptin treatment. Protein levels of ACC, FASN, SCD1, HMGCR, and FDPS were also reduced in leptin-treated male ob/ob mice (Figure 2, D and E). In contrast, Hnf1α (hepatocyte nuclear factor 1 homeobox A) and its targets were generally unchanged at the mRNA level (Supplemental Figure 3).

Leptin treatment reduced Pcsk9 mRNA and SREBP target genes in male ob/ob mice. Mice were treated as in Figure 1. Hepatic gene expression was measured by real-time PCR, normalized to Tbp, and expressed relative to vehicle-treated mice (A–C). Hepatic protein expression (D and E) was measured by immunoblotting (left), and band intensities were quantified by densitometry, normalized to tubulin, and expressed relative to vehicle-treated mice (right). Data are presented as mean ± SEM and are representative of 2 independent experiments. *, P ≤ .05 compared with vehicle treatment, Student's t test; n = 3–5/group.
Leptin treatment of female mice fails to suppress PCSK9
Female ob/ob mice were similarly treated with leptin or vehicle (leptin or PBS, 24 μg/d, sc). As expected, leptin-treated female ob/ob mice showed a 17% decrease in body weight, a significant reduction in food intake, a trend towards lower fasting blood glucose levels, and decreased liver weight (Figure 3, A–D). Surprisingly, leptin treatment did not alter plasma PCSK9 (Figure 3E). LDLR protein was reduced by 63%, Ldlr mRNA was reduced by 50%, and Idol mRNA was unchanged (Figure 3, F–H). However, leptin treatment reduced plasma triglyceride and cholesterol levels by 24%–53% (Figure 3, I and J). Furthermore, hepatic Pcsk9 mRNA expression was not significantly changed with leptin treatment, even though the lipogenic and cholesterologenic genes were suppressed in females as in males (Supplemental Figure 4).
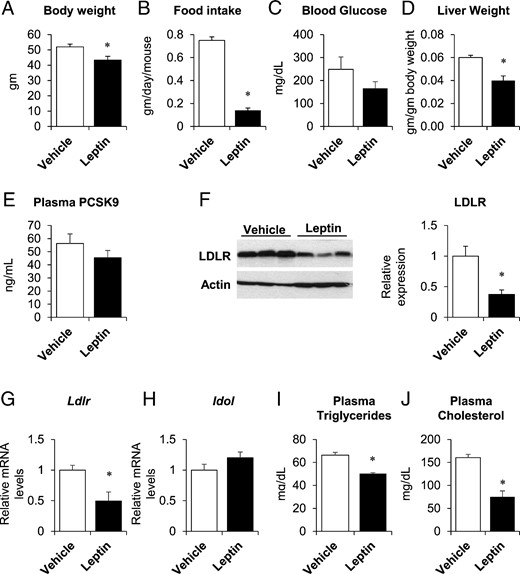
Leptin did not alter PCSK9 expression in female ob/ob mice. Twelve-week-old female ob/ob mice were implanted with sc pumps containing either vehicle or leptin (24 μg/d). Body weight (A), food intake (B), and liver weights (D) were measured at time of killing, 4 days after pump implantation. Fasting blood glucose (C) was measured after a 4-hour fast, 2 days after implantation. Plasma PCSK9 (E), triglycerides (I), and total cholesterol (J) were measured in nonfasted plasma taken at the time of killing. Hepatic LDLR protein expression was measured by immunoblotting (F, left); band intensities were quantified by densitometry, normalized to actin, and expressed relative to vehicle-treated mice (F, right). Hepatic gene expression of Ldlr and Idol was measured by real-time PCR, normalized to 18s, and expressed relative to vehicle-treated mice (G and H). Data are presented as mean ± SEM and are representative of 2 independent experiments. *, P ≤ .05 compared with vehicle treatment, Student's t test; n = 3–6/group.
Leptin replacement decreased PCSK9 and improved lipid parameters in female lipodystrophic subjects
We further studied the effects of leptin on lipodystrophic patients. Our cohort, which was exclusively female, included patients with multiple forms of lipodystrophy (congenital generalized lipodystrophy, n = 4; acquired generalized lipodystrophy, n = 2; familial partial lipodystrophy, n = 2), had a mean baseline age of 14 years (range, 5–23 y), and a normal mean body mass index (BMI). Table 2 shows the characteristics of the study subjects, before and after 4–6 months of treatment with metreleptin (∼4.4 mg/d via sc injection).
Patient Demographics, Markers of Glucose Homeostasis, and Lipid Parameters at Baseline and Postleptin Treatment
| Clinical Variables | Baseline | Postleptin Treatment | P Value |
|---|---|---|---|
| Age (y) | 18 ± 5.5 | ||
| Weight (kg) | 50.9 ± 23.3 | 47.9 ± 21.2 | .07 |
| BMI (kg/m2) | 20.8 ± 3.2 | 19.6 ± 3.4 | .05 |
| Leptin (ng/mL) | 6.4 ± 11.1 | 53.8 ± 51.2 | .09 |
| Fasting plasma glucose (mg/dL) | 144 ± 79 | 111 ± 41 | .34 |
| Fasting plasma insulin (μU/mL) | 119.4 ± 87.4 | 41.6 ± 42.5 | .03 |
| 2-h OGTT plasma glucose (mg/dL) | 180 ± 75 | 156 ± 71 | .35 |
| Hemoglobin A1C (%) | 7.9 ± 1.6 | 6.0 ± 1.8 | .04 |
| OGIS (mL/min · m2) | 360 ± 200 | 343 ± 155 | .89 |
| Total cholesterol (mg/dL) | 195 ± 64 | 146 ± 38 | .08 |
| LDL cholesterol (mg/dL) | 82 ± 46 | 68 ± 19 | .43 |
| HDL cholesterol (mg/dL) | 28 ± 8 | 29 ± 6 | .89 |
| Triglycerides (mg/dL) | 402 ± 182 | 225 ± 89 | .10 |
Data are presented as mean ± SD. P values are shown for comparisons between the baseline and postleptin treatment variables using a t test. P ≤ .05 are shown in bold.
Patients in this cohort showed elevated fasting plasma glucose (>100 mg/dL) and insulin levels (>15 μU/mL), as well as abnormal 2-hour plasma glucose on OGTT (>140 mg/dL), and lower OGIS measurements (<440 mL/min · m2) (20), suggestive of insulin resistance. In addition, 6 out of 8 patients had hemoglobin A1c levels in the diabetic range (≥6.5%). Lipid measurements at baseline were notable for elevated fasting triglycerides and low HDL levels, consistent with previous reports (5, 7, 26, 27). LDL cholesterol was within the normal range, likely because patients with high LDL cholesterol would have been placed on lipid-lowering therapy, and therefore excluded from this study cohort. Normal reference ranges for laboratory measurements per the NIH Clinical Center laboratory are listed in Supplemental Table 2.
Leptin treatment significantly decreased BMI, fasting plasma insulin levels, and hemoglobin A1c. Consistent with previous studies, leptin decreased triglycerides, total cholesterol, and LDL cholesterol by approximately 20%–40%, although the results did not reach significance in this small cohort; HDL cholesterol levels were unchanged (Table 2) (4, 5, 7, 26, 28). In parallel, plasma PCSK9 levels fell by more than 20% (P = .008) (Figure 4A). In addition, the change in PCSK9 was significantly correlated with the change in LDL cholesterol, but not with other variables (Figure 4B and Supplemental Table 3).

Leptin treatment reduced plasma PCSK9 in lipodystrophic females. A, Comparison of plasma PCSK9 concentrations in lipodystrophic patients at baseline and after 4–6 months of leptin treatment. Dashed lines connect baseline and postleptin treatment values for individual subjects. The gray boxes denote the 75th and 25th percentiles; the horizontal lines within the boxes denote the median values; the whiskers represent the minimum and maximum values (n = 8). One-sample t tests were used to assess changes from baseline to postleptin therapy. P = .008. B, Change in PCSK9 was correlated with change in LDL. Data shown are ln-transformed and analyzed using Pearson correlation.
Discussion
Leptin plays a central role in the regulation of energy balance, as well as in lipid metabolism. We show here that leptin suppresses plasma PCSK9 by 90% in male ob/ob mice, and by 20% in female lipodystrophic patients. In female lipodystrophic patients, the decrease in plasma PCSK9 is associated with a reduction in LDL cholesterol. However, leptin does not suppress plasma PCSK9 in female ob/ob mice.
In ob/ob males, leptin appears to suppress PCSK9 by reducing its transcription, because Pcsk9 mRNA is reduced by 90% in the liver, the predominant source of plasma PCSK9 (29). In addition, the activity of the SREBPs, which can drive Pcsk9 transcription (30), appear to be reduced, because the lipogenic and cholestesterologenic SREBP target genes are decreased 50%–95%. Interestingly, in the livers of ob/ob females, although leptin suppresses the lipogenic and cholesterologenic targets of the SREBPs to a similar extent as in males, it does not suppress Pcsk9. These data suggest that sex hormones may modify the ability of the SREBPs to specifically activate the Pcsk9 promoter; alternatively, it is possible that the effects of leptin on Pcsk9 mRNA levels are not mediated by the SREBPs.
In any case, most of the changes in lipid metabolism produced by leptin in mice appear to be independent of PCSK9. First, leptin reduces hepatic LDLR protein in males, even as it suppresses PCSK9. We would note that the effects of leptin on LDLR appear to be very sensitive to the particular experimental paradigm used, as ob/ob mice are reported to have both increased (31–33) and decreased (34) amounts of LDLR relative to their lean controls. This is perhaps due to the fact that LDLR is under complex regulation at the transcriptional level (35), by microRNA binding sites (36) and potentially other regulatory elements (37) in the 3′untranslated region of the Ldlr, and, of course, posttranscriptionally (12). Here, it appears that leptin may have reduced LDLR synthesis, because there was a 50%–80% reduction in Ldlr mRNA in both sexes. Second, there was no correlation between PCSK9 and plasma lipid levels: male mice showed no change in plasma lipids despite a 90% reduction in plasma PCSK9, and female mice showed a 24%–53% reduction in plasma lipids, but no change in plasma PCSK9. Finally, mice that lack both leptin and LDLR (ob/ob, Ldlr double knockout mice) show a 5-fold increase in plasma triglycerides and total cholesterol compared with mice with knockout only of Ldlr, indicating that leptin is capable of suppressing plasma lipids entirely independently of the LDLR (38). Together, these data suggest that other effects of leptin on lipid metabolism, such as decreasing lipogenesis (39), increasing fatty acid oxidation (40), and promoting HDL clearance (41), may be more important.
We also identified a dramatic role for sex in modulating the effects of acute leptin treatment on plasma lipids, as well as on PCSK9. Male and female ob/ob mice have similar lipid levels (42, 43), and to our knowledge, this is the first report of sex-dependent effects on lipid metabolism in response to leptin treatment. However, this observation is perhaps not surprising given the extensive cross talk between leptin and sex hormone signaling (44) and the marked effects of estrogen on lipid metabolism (45). In addition, sex hormones also affect PCSK9 itself, as estrogen reduces PCSK9 in vitro, in vivo, and in humans (46–49); estrogen may also modify the effects of PCSK9 on the subcellular distribution of LDLR in the hepatocyte (50).
Our studies in lipodystrophic patients differed from those in ob/ob mice even beyond the obvious species differences. First, in contrast to ob/ob mice, which are entirely leptin deficient and markedly obese, human lipodystrophies are characterized by selective loss of adipose tissue and varying degrees of hypoleptinemia (51). Second, given that both acquired and congenital lipodystrophy are extremely rare (∼1 in 10 million) in the population and most of them are female (52), and considering our exclusion criteria of lipid-lowering medication use, our study was confined to a very small cohort of lipodystrophic patients that were all female. Interestingly, human studies have not indicated any sex differences in lipid metabolism in response to metreleptin treatment (53). Third, the dose and duration of leptin treatment differed. In our patients, we noted a significant correlation between the change in PCSK9 and the change in LDL cholesterol upon leptin treatment. Thus, in this case, leptin may reduce LDL cholesterol by lowering PCSK9 levels. Consistent with the idea that leptin suppresses PCSK9 and increases LDLR protein in humans, leptin-deficient lipodystrophic patients show impaired LDL clearance (54).
In summary, our data show that leptin can suppress PCSK9 under some, but not all, conditions. In patients with lipodystrophy, leptin suppression of PCSK9 is associated with a reduction in LDL cholesterol, suggesting that the suppression of PCSK9 may contribute to the beneficial effects of leptin on their plasma lipid profiles. However, based on our studies in leptin-deficient mice, it is likely that leptin also acts via PCSK9-independent pathways to regulate plasma lipids.
Acknowledgments
We thank Dr Henry Feldman for excellent statistical support, Dr John Stafford for helpful discussion, and Mary Gearing and Abhiruchi Mehta for technical assistance.
This work was supported by National Institutes of Health Grants R01HL109650-05 (to S.B.B.), 5K12DK094721-05 (to A.E.L.), and K99DK100539-02 to (J.M.); M.E.H. was supported by the Department of Defense through the National Defense Science and Engineering Graduate Fellowship Program; S.D.d.F. was supported by the Farb Family Fund and by the Kostin Family Innovation Fund. Human studies were funded by the Intramural Research Program of the National Institute of Diabetes and Digestive and Kidney Diseases.
Disclosure Summary: A.E.L., M.E.H., J.M., R.J.B., S.D.d.F., and R.M. have nothing to disclose. S.B.B. has received consulting fees from Novo Nordisk.
Abbreviations
- ACC
acetyl-CoA carboxylase
- BMI
body mass index
- CoA
stearoyl-coenzyme A
- FASN
fatty acid synthase
- FDPS
farnesyl diphosphate synthase
- HDL
high-density lipoprotein
- HMGCR
3-hydroxy-3-methylglutaryl-CoA reductase
- Idol
inducible degrader of the LDLR
- LDL
low-density lipoprotein
- LDLR
LDL receptor
- OGIS
oral glucose insulin sensitivity
- OGTT
oral glucose tolerance test
- PCSK9
proprotein convertase subtilisin/kexin type 9
- SCD1
stearoyl-CoA desaturase 1
- SREBP
sterol regulatory element-binding protein
- Tbp
TATA-box binding protein.
