


Using a new tail-tip bleeding procedure and a sensitive ELISA, we describe here the patterns of LH secretion throughout the mouse estrous cycle; in ovariectomized mice; in ovariectomized, estradiol-treated mice that model estrogen-negative and -positive feedback; and in transgenic GNR23 mice that exhibit allele-dependent reductions in GnRH neuron number. Pulsatile LH secretion was evident at all stages of the estrous cycle, with LH pulse frequency being approximately one pulse per hour in metestrous, diestrous, and proestrous mice but much less frequent at estrus (less than one pulse per 4 h). Ovariectomy resulted in substantial increases in basal and pulsatile LH secretion with pulses occurring approximately every 21 minutes. Chronic treatment with negative-feedback, estradiol-filled capsules returned LH pulse frequency to intact follicular phase levels, although pulse amplitude remained elevated. On the afternoon of proestrus, the LH surge was found to begin in a highly variable manner over a 4-hour range, lasting for more than 3 hours. In contrast, ovariectomized, estradiol-treated, positive-feedback mice exhibited a relatively uniform surge onset at approximately 0.5 hour prior to lights out. Gonadectomized wild-type and heterozygous GNR23 (∼200 GnRH neurons) male mice exhibited an LH pulse every 60 minutes. Homozygous GNR23 mice (∼80 GnRH neurons) had very low basal LH concentrations but continued to exhibit small amplitude LH pulses every 90 minutes. These studies provide the first characterization in mice of pulse and surge modes of LH secretion across the estrous cycle and demonstrate that very few GnRH neurons are required for pulsatile LH secretion.
The GnRH neurons drive pulse and surge profiles of LH secretion from the pituitary gland in all mammals (1). Whereas it has been possible to measure GnRH secretion with great temporal precision in sheep (2) and monkeys (3), this has been problematic in smaller mammals such as rodents. As such, LH secretion profiles are often used as a proxy for that of GnRH secretion in smaller species. For example, the pulsatile and surge patterns of LH secretion are well documented in rats (4) in which indwelling intracardiac catheters have been very successful in enabling repetitive blood sampling to be undertaken over many hours.
Unfortunately, this has not been the case for mice in which the intracardiac catheterization method is not well suited to the small physical size and blood volume of mice. A few studies have nevertheless been able to make some progress in profiling pulsatile LH secretion in ovariectomized (OVX) mice with this method (5–7). Arguably, the most successful mouse cardiac catheterization studies to date were undertaken by Coquelin and coworkers in the 1980s (8, 9). In those experiments, mice received intracardiac catheters that were then infused continuously with heparinized saline for 5 days before 55-μL blood samples, replaced with blood cells from donor mice, were taken every 5 minutes for 9 hours on the day of experimentation. These remarkable investigations provided striking profiles of pulsatile LH and T secretion in intact male mice (9). However, due to the complexity and difficulty of the methodology, such studies have only rarely been attempted over the last 35 years (10). A worse situation exists for the LH surge in which there is almost no detailed information on its temporal profile in individual mice. Due to the technical difficulty of obtaining this information from individual mice, investigators have resorted to killing cohorts of female mice at different time points to define the temporal profile of the surge (5, 11), again, a practice spanning back 40 years now (12). Thus, intracardiac catheterization, with its necessity for tethering and taking large volumes of blood at each sample has not proven ideal for the routine measurement of LH in mice.
We recently reported a new methodology for obtaining tail-tip blood samples from mice that, along with a new sensitive ELISA, enabled pulsatile LH secretion to be measured with relative ease in intact 4-, 10-, and 16-week-old male mice (13). In the present study, we use the same approach to determine the profiles of pulsatile LH secretion in metestrous-, diestrous-, proestrous-, and estrous-stage female mice. The dynamics of pulsatile LH secretion across the estrous cycle are well described in rats (4, 14–16), but, to our knowledge, there is little information on this important aspect of reproductive biology published for mice. We have also taken the opportunity to examine the impact of an estrogen negative-feedback paradigm on pulsatile LH secretion in OVX mice. Studies have further examined the profile of the LH surge in individual proestrous mice and in mice subjected to a common OVX plus estradiol model of the surge. Finally, we have used transgenic GNR23 mice, which exhibit genotype-dependent reductions in the number of GnRH neurons within the brain (17, 18), to assess how many GnRH neurons may be required to generate pulsatile LH secretion.
Materials and Methods
Animals
Adult (>60 d of age) wild-type C57BL/6 and transgenic C57BL/6 × CBA/Ca GNR23 (17) mice were housed under a 12-hour light, 12-hour dark cycle (lights on 6:00 am, off at 6:00 pm) with ad libitum access to food and water in groups of two or three animals per cage. Where indicated, female mice were bilaterally OVX or males gonadectomized (GDX) under isoflurane anesthesia. All mice were handled every day for at least 21 days. This consisted of 5–10 minutes of handling including training for tail-tip bleeding. Vaginal cytology of intact females was examined daily at approximately 10:00 am to determine the stage of the estrous cycle. All procedures were approved by the University of Otago Animal Ethics Committee.
Tail-tip bleeding
Repetitive tail-tip blood sampling was undertaken using the method of Steyn et al (13). In brief, after a single excision of the very tip of the tail, mice were gently restrained in a cardboard tube every 3, 6, 10, or 30 minutes (see below) while their tail was wiped clean with saline and then massaged so that a second investigator could take a 3-μL blood sample from the tail tip with a pipette. Whole blood was immediately diluted in 57 μL of 0.1 M PBS with 0.05% Tween 20, vortexed, and snap frozen on dry ice. Samples were stored at −20°C for a subsequent LH ELISA (13).
Experiment 1: LH pulse profiling in intact female mice
Female mice displaying regular 4- or 5-day cycles were subjected to tail-tip bleeding on the day of metestrus (also known as diestrous I; n = 10), diestrus (also known as diestrous II; n = 12), proestrus (n = 10), and estrus (n = 18) from 11:00 am to 1:00 pm, with samples being taken at 10-minute intervals.
Experiment 2: LH pulse profiling in OVX and OVX+estradiol (OVX+E) mice
Intact wild-type C57BL/6 adult female mice (n = 8) trained as above were OVX and 1 week later used for 3-minute interval tail tip bleeding experiments from 11:00 am to 1:00 pm. The shorter interval of sampling was used because OVX mice were expected to exhibit frequent LH pulses. A week after the first bleeding experiment, OVX mice were implanted sc with a SILASTIC brand implant (Dow Corning Inc) containing 17β-estradiol (1 μg per 20 g body weight) and a further set of tail tip bloods collected using a 6-minute sampling within 10 days. This OVX+E protocol, originally developed by Bronson (19), is used in our laboratory for modeling chronic estrogen-negative feedback effects on LH secretion (20, 21).
Experiment 3: LH pulse profiling in GNR23 mice
Adult wild-type (n = 7), GNR23+/− (n = 7) and GNR23−/− (n = 6) littermate male mice were trained as above and then GDX under isoflurane anesthesia. One week later, mice of all three genotypes underwent a 6-minute interval tail-tip bleeding for 3 hours from 11:00 am to 2:00 pm. The pituitary responsiveness of GNR23 male mice has not been examined before. At the end of the experiment, a basal tail-tip sample was taken from four mice from each genotype followed by 200 ng/kg GnRH administered sc and a second tail-tip blood sample taken 15 minutes later.
Experiment 4: LH surge profiling
The LH surge profiles of intact proestrous and OVX, estradiol-treated mice were evaluated. Wild-type C57BL/6 adult female mice were handled and vaginal cytology assessed as noted above and mice in the proestrous (n = 11) and diestrous stages (n = 6) of the estrous cycle identified. Beginning at 4:00 pm (2 h before lights off), tail-tip blood samples were taken every 30 minutes until 8:00 pm (2 h after lights off). To examine the estrogen-induced surge, 10 wild-type C57BL/6 adult female mice were anesthetized with isoflurane, ovariectomized, and given a sc SILASTIC brand estradiol implant as detailed above. Six days later, mice were given a sc injection of estradiol benzoate (1 μg in 100 μL) at 9:00 am. The following day, 30-minute interval tail-tip bleeding was performed on OVX+E+E mice from 4:30 pm to 8:00 pm. This OVX+E+E protocol, again developed by Bronson (19), is commonly used to generate an LH surge in mice (11, 22–24).
Analysis
Blood samples were analyzed for LH content by a sandwich ELISA as reported previously (13, 25). The assay sensitivity was 0.002 ng/mL, with intra- and interassay coefficients of variation of 6% and 9%. The DynPeak algorithm was used to detect LH pulses (26). For each detected pulse, the amplitude was determined by subtracting the highest LH value from the basal value immediately prior to the onset of the pulse. Overall basal levels of LH secretion were determined by combining a minimum of the 10 lowest LH measurements from each mouse. Mean levels of LH release were the average of all values collected over the sampling period.
Statistical analysis of basal and mean LH levels, pulse frequency, and pulse amplitude between groups was analyzed using a one-way ANOVA with a post hoc Tukey’s multiple comparison. The effects of GnRH on LH secretion in GNR23 mice were assessed using paired t tests. The LH surge profiles were assessed using a repeated-measures ANOVA, Comparisons between peak LH levels achieved during the surge in proestrous and OVX+E+E mice were evaluated with a Mann-Whitney test.
Results
Experiment 1: LH pulse profiles in intact female mice
Basal LH levels were low (<0.25 ng/mL) and not different across the four stages of the estrous cycle (Table 1). Individual LH pulses were detected at all stages of the cycle and appeared as sharp increments in LH, with a slower descending phase (Figure 1). Differences existed in the frequency of LH pulses across the cycle (Figures 1 and 2A). Pulse frequency was similar between metestrous (1.90 ± 0.27 pulses per 120 min), diestrous (2.00 ± 0.25), and proestrous (2.20 ± 0.20) mice but significantly reduced in estrous animals (0.44 ± 0.14; P < .001, ANOVA with post hoc Tukey’s test; Figures 1 and 2A) in which 11 of the 18 estrous mice exhibited no pulses during the sampling period (Figure 1H). Pulse amplitude showed a gradual reduction across the cycle being highest at metestrus (0.98 ± 0.12 ng/mL) and lowest in estrus (0.55 ± 0.11 ng/mL, Figure 2C; ANOVA F = 3.665, P < .05, but no significant post hoc differences were detected between groups; Figure 2C). Mean LH concentrations were not different between metestrus, diestrus, and proestrus but significantly reduced on estrus (P < .01; ANOVA with post hoc Tukey’s, Table 1.)
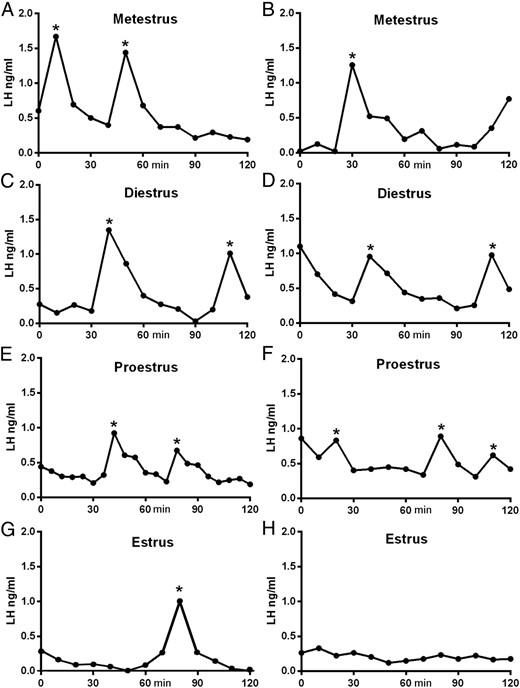
Representative profiles of LH secretion in female mice at different stages of the estrous cycle. Two examples are given for each stage A–H. Pulses detected by the DynePeak algorithm are indicated with an asterisk. Sampling was undertaken between 11:00 am and 1:00 pm.
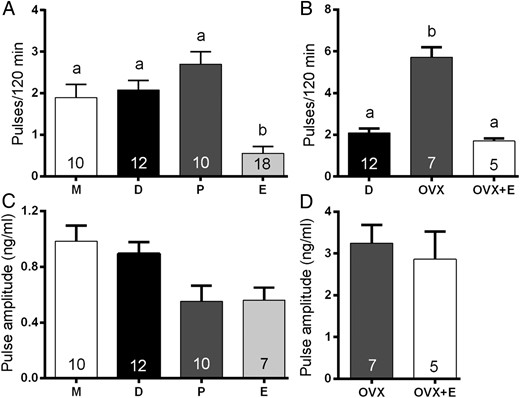
Histograms showing mean (±SEM) numbers of LH pulses detected over the 2-hour sampling period (A and B) and mean (±SEM) LH pulse amplitudes (C and D) of metestrous (M), diestrous (D), proestrous (P), estrous (E), OVX, and OVX+E mice. In panel B, the diestrous data are replotted on a different scale. Bars with different letters are significantly different from one another (see text; one way ANOVA with post hoc Tukey’s tests). Numbers at the base of each bar indicate animal N numbers. Note that the N for estrous mice in C is 7 because only 7 of 18 mice exhibited LH pulses.
Basal and Mean (±SEM) LH Concentrations (Nanograms per Milliliter) in Intact Cycling, OVX, and OVX+E Female Mice
| n | Basal LH, ng/mL | Mean LH, ng/mL | |
|---|---|---|---|
| Metestrus | 10 | 0.16 ± 0.05 | 0.40 ± 0.08 |
| Diestrus | 12 | 0.23 ± 0.04 | 0.46 ± 0.05 |
| Proestrus | 10 | 0.25 ± 0.05 | 0.45 ± 0.07 |
| Estrus | 18 | 0.12 ± 0.02 | 0.15 ± 0.02a |
| OVX | 7 | 4.69 ± 0.23b | 6.16 ± 0.36b |
| OVX+E | 5 | 0.59 ± 0.12 | 1.23 ± 0.24c |
Significantly different compared with metestrus, diestrus, and proestrus (P < 0.01, one way ANOVA with Tukey’s multiple comparisons).
P < .001 against all other groups.
P < .01 against all other groups.
Experiment 2: LH pulse profiles in OVX and OVX+E mice
Ovariectomy (n = 7) had a dramatic effect on the profile of LH secretion, resulting in enhanced basal and mean LH levels (4.69 ± 0.23 ng/mL and 6.16 ± 0.36 ng/mL; both P < .001 compared with all intact groups; Figure 3, A and B, and Table 1) and more frequent LH pulses (5.71 ± 0.47 pulses per 120 min; P < .001, compared with all intact groups; Figures 2B and 3, A and B). Administration of estradiol (n = 5) reversed some of these effects (Figure 3, C and D), with basal LH (0.59 ± 0.12 ng/mL; Table 1) and LH pulse frequency (1.70 ± 0.12 ng/mL, Figure 2B) returning to intact diestrous levels. However, LH pulse amplitude in OVX+E mice (2.86 ± 0.66 ng/mL) was not significantly different compared with OVX mice (3.24 ± 0.44 ng/mL, Figures 2D and 3, C and D). Mean LH levels in OVX mice were significantly elevated compared with OVX+E animals (P < .01, ANOVA with post hoc Tukey’s tests; Table 1).
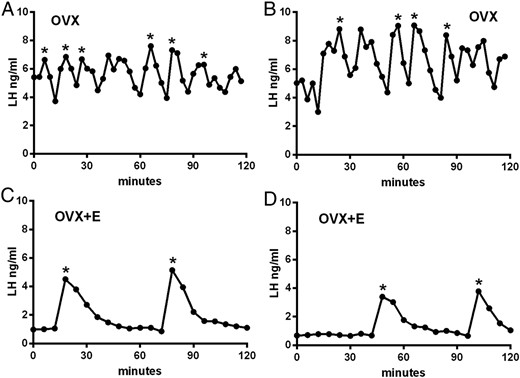
Representative profiles of LH secretion in two OVX (A and B) and two OVX+E (C and D) mice modeling estrogen-negative feedback. Pulses detected by the DynPeak algorithm are indicated with an asterisk. Sampling was undertaken between 11:00 am and 1:00 pm.
Experiment 3: LH pulse profiles in GNR23 mice
Littermate wild-type (n = 7) and htz (n = 7) GDX GNR23 mice exhibited very similar profiles of pulsatile LH secretion (Figure 4, A–D). Although basal and mean LH levels were significantly reduced in htz mice compared with wild types (P < .01, Table 2), LH pulse frequency (Figure 5A) and amplitude (Figure 5B) were not different in the two genotypes (wild type; 3.14 ± 0.26 pulses per 180 min and amplitude 3.16 ± 0.61 ng/mL compared with htz; 3.85 ± 0.51 pulses per 180 min and amplitude 2.51 ± 0.39 ng/mL). In contrast, the LH profiles of GDX hmz GNR23 mice (n = 6) were markedly different from that of the other genotypes (Figure 4, E and F). Basal and mean levels were substantially reduced (0.82 ± 0.12 ng/mL; P < .001, compared with others, Table 2) with less frequent (1.83 ± 0.31 pulses per 180 min), small amplitude (0.65 ± 0.16 ng/mL) pulses observed (Figure 4, E and F). Whereas pulse amplitude was significantly reduced compared with the other genotypes (P < .01 wild type; P < .05 htz; ANOVA with post hoc Tukey’s tests, Figure 5B), pulse frequency was not significantly different from that of wild-type mice (P > .05. Figure 5A).
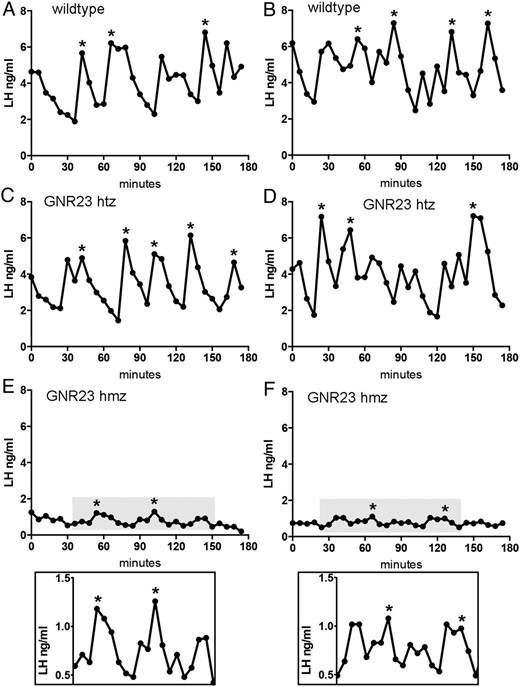
Diagrams showing representative profiles of LH secretion in two wild-type (A and B) and two heterozygous (C and D) and two homozygous (E and F) GNR23 littermate mice. Pulses detected by the DynPeak algorithm are indicated with an asterisk. The LH profiles in grayed boxes in panels E and F are magnified below.
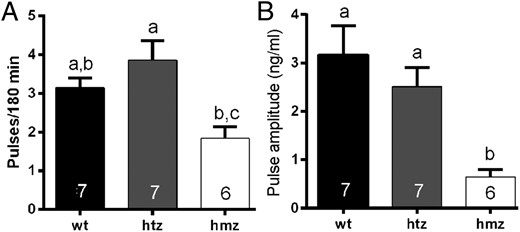
Histograms showing mean (±SEM) numbers of LH pulses detected over the 2-hour sampling period (A) and mean (±SEM) LH pulse amplitudes (B) of wild-type (wt) and heterozygous (htz) and homozygous (hmz) GNR23 littermate mice. Bars with different letters are significantly different from one another (see text; one way ANOVA with post hoc Tukey’s tests). Numbers at the base of each bar indicate animal N numbers.
Mean, Basal, and GnRH-Stimulated (±SEM) LH Concentrations (Nanograms per Milliliter) in GDX Wild-Type, Heterozygous, and Homozygous GNR23 Mice
| n | Basal LH | Mean LH | GnRH Stimulation | ||
|---|---|---|---|---|---|
| Before | After | ||||
| Wild type | 7 | 3.43 ± 0.16 | 4.68 ± 0.18 | 3.81 ± 0.36 | 5.60 ± 0.63d |
| Heterozygous | 7 | 2.32 ± 0.28b | 3.35 ± 0.43a | 1.90 ± 0.32 | 4.23 ± 0.31e |
| Homozygous | 6 | 0.82 ± 0.12c | 1.05 ± 0.14c | 0.65 ± 0.23 | 3.05 ± 0.49e |
P < .05 compared with wild type (one way ANOVA with Tukey’s multiple comparison).
P < .01 compared with wild type (one way ANOVA with Tukey’s multiple comparison).
P < .001 compared wild type (one way ANOVA with Tukey’s multiple comparison).
P < .05 compared with “Before” (paired t test).
P < .01 compared with “After” (paired t test).
To evaluate pituitary gonadotroph sensitivity to GnRH in GDX GNR23 mice, GnRH stimulation tests were undertaken. All genotypes displayed a significant increase in LH secretion after GnRH treatment (P < .05 or 0.01, paired t tests; Table 2), with the fold increase in LH being 1.47, 2.23, and 4.69 in wild-type, htz, and hmz mice, respectively. Body weights were not different between the genotypes (wild type 27.0 ± 0.8 g, htz 26.9 ± 1.5 g, hmz 25.9 ± 1.0 g).
Experiment 4: proestrous LH surge profiles
Mice in the proestrus (n = 11) and diestrus (n = 6) were identified and half-hourly tail-tip blood samples taken for 4 hours, beginning 2 hours prior to lights out at 4:00 pm. Of the 11 proestrous mice, seven showed an increase in LH secretion (Figure 6A), with the remainder having no change in LH levels from baseline during the sampling period. None of the six diestrous mice, sampled at 30-minute intervals, exhibited any change in LH levels across this time period, with basal levels of 0.17 ± 0.9 ng/mL (Figure 6B). The seven proestrous mice exhibiting an LH surge displayed a range of surge onset times (Figure 6A). One mouse (light blue, Figure 6A) had begun its surge prior to the onset of bleeding, whereas another mouse (light green, Figure 6A) was only starting its surge as the blood collection period was finishing. The remainder of surging mice (n = 5) exhibited LH surges beginning 1–1.5 hours before lights off (Figure 6B). For these mice, basal LH concentrations prior to surge onset were 1.5 ± 0.4 ng/mL and the peak of the LH surge (14.5 ± 1.7 ng/mL) was found to occur soon after (0.7 h) lights out (Figure 6B and Table 3). Although a repeated-measures ANOVA detected a significant change in LH with time (P < .05), no single point was different from another. This is likely due to the wide variability in onset of the surge, even in this group of post hoc identified mice.
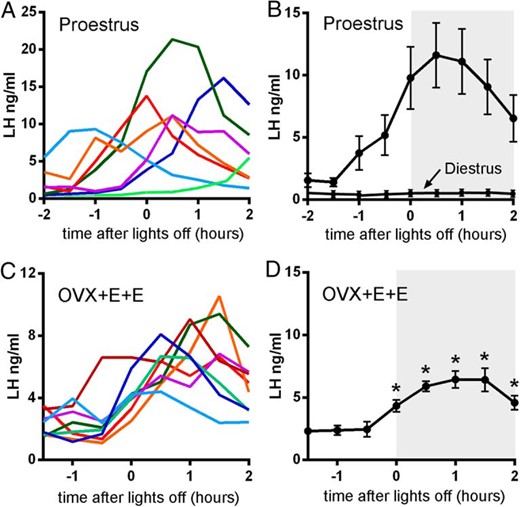
LH surge profiles in proestrous and OVX+E+E mice. A, Color-coded LH profiles from seven individual proestrous mice over 4 hours, beginning 2 hours before lights out. B, Mean (±SEM) LH levels from five post hoc-identified proestrous mice surging at approximately the same time within the time window of sampling. LH levels from diestrous mice sampled over the same time are indicated. C, Color-coded LH profiles from eight individual OVX+E+E mice over 4 hours, beginning 1.5 hour before lights out. D, Mean (±SEM) LH levels from OVX+E+E mice (n = 8). Values significantly different from basal LH concentrations are indicated by an asterisk (P < .05, repeated measures ANOVA). Lights off is at 6:00 pm for all experiments.
Mean (±SEM) LH Concentrations (Nanograms per Milliliter) Related to the Surge in Intact Proestrous and OVX+E+E Mice
| n | Basal LH, ng/mL | Peak Value, ng/mL | Time of Peak LH Value After Lights Off, h | |
|---|---|---|---|---|
| OVX+E+E surge | 8 | 2.24 ± 0.25 | 7.70 ± 0.69 | 1.06 ± 0.18 |
| Proestous surge | 5 | 1.51 ± 0.41 | 14.50 ± 1.73a | 0.7 ± 0.25 |
| n | Basal LH, ng/mL | Peak Value, ng/mL | Time of Peak LH Value After Lights Off, h | |
|---|---|---|---|---|
| OVX+E+E surge | 8 | 2.24 ± 0.25 | 7.70 ± 0.69 | 1.06 ± 0.18 |
| Proestous surge | 5 | 1.51 ± 0.41 | 14.50 ± 1.73a | 0.7 ± 0.25 |
Data are the LH levels prior to the initiation of the surge (basal) and at the peak of the surge (peak). The mean (±SEM) time is given at which the peak LH value occurred after light offs at 6:00 pm.
Peak LH levels were significantly higher in proestrous compared with OVX+E+E mice (P < .01, Mann-Whitney test).
Experiment 4: LH surge profiles in OVX+E+E mice
Ten mice underwent the OVX+E+E surge induction protocol with half-hourly tail tip bleeding for 3.5 hours (beginning 1.5 h prior to lights off). Of these animals, eight exhibited an LH surge (Figure 6C) with a consistent onset at approximately 0.5 hour prior to lights off (Figure 6, C and D). The remaining two mice showed no change in LH secretion across the time period (not shown). In surging mice, peak levels of LH (7.7 ± 0.7 ng/mL) occurred approximately 1 hour after lights out (Table 3), with all values being significantly different from basal (Figure 6D, P < .05, repeated measures ANOVA with post hoc Dunn’s tests). Peak LH surge levels in OVX+E+E mice were approximately half that found in the post hoc identified group of proestrous surging mice (P < .01, Mann-Whitney test; Table 3).
Discussion
This study provides the first account of pulsatile LH secretion across the estrous cycle in the intact female mouse. We find that LH pulses occur approximately every hour in metestrous, diestrous, and proestrous mice sampled in the late morning-early afternoon period. Although pulses could be detected in individual estrous mice, these were infrequent, with most mice exhibiting no pulses over the 120-minute sampling period and the remainder showing a single pulse. Thus, LH pulses occur at a very much slower rate in estrus. These observations are very similar to reports of LH pulsatility across the estrous cycle in rats (14–16) and our previous description of LH pulses in diestrous mice (27). Interpulse intervals for LH pulses in rats are reported to range from 40 to 60 minutes in metestrus, from 43 to 55 minutes in diestrus, and from 35 to 63 minutes in proestrus (14–16), compared with 63, 60, and 54 minutes as found here in mice, respectively. Again, similar to mice, LH pulsatility in estrous rats is vastly reduced, with some studies reporting a complete absence of pulses (15, 16) and others finding long interpulse intervals of approximately 120 minutes (14). A similar substantial decrease in LH pulse frequency occurs during the luteal phase in sheep and primates (28, 29). Interestingly, the tendency for a decrease in LH pulse amplitude from metestrus to estrus in mice has also been observed in the rat (14). Together these investigations indicate that, in both rats and mice, a pulse of GnRH secretion triggers an LH pulse approximately every hour in the follicular phase and that this slows considerably after the LH surge in estrus.
As expected, pulsatile LH secretion was found to be greatly increased in OVX mice with elevated basal release and greatly increased frequency and amplitude compared with intact mice. Three previous studies have examined pulsatile LH release in OVX mice using cardiac catheterization (5–7). Whereas LH pulse amplitude was consistently around 2 ng/mL in all of those studies, as in the present investigation, the calculated interpulse interval was reported to be 67, 44, or 20 minutes. Our own estimate is 21 minutes with approximately six pulses detected over the 120-minute sampling period. It is important to note that studies using 10-minute sampling intervals have detected hourly LH pulses (5, 6), whereas studies using 3-minute sampling (here and reference 7) have found much faster pulsatility in the order of three pulses per hour. This highlights the importance of sampling frequency in assessing pulsatile hormone secretion. We note that it is also possible that the LH pulse frequency in OVX mice may be faster than reported because the DynPeak pulse algorithm did not always, to our eye, detect every pulse. Investigations in different OVX rat strains have detected LH pulses to occur in a similar time frame, every 20–30 minutes (16, 30–32). The frequency of pulses in OVX rodents is substantially higher than that of OVX sheep (40–60 min) (33, 34) and OVX monkeys (50–75 min) (35, 36).
We were surprised to find that the chronic estrogen-negative feedback regimen tested in these experiments did not fully restore LH secretion to intact levels. Although LH pulse frequency was returned to the normal rate of one pulse per hour, pulse amplitude remained elevated at OVX concentrations. Previous studies using this model (20, 21), including the original description by Bronson (19), have all used single-point blood measurements and reported that LH concentrations return to intact levels. This indicates the inherent dangers of using single-point blood levels to measure LH secretion. It is unclear why LH pulse amplitude remains elevated in this model despite the strong likelihood that GnRH pulse frequency is normalized. The original study by Bronson (19) reported that serum 17β-estradiol levels were returned to intact levels with this model, although this was examined in only two mice, and there is presently considerable suspicion over the accuracy of premass spectrometry measurements of estradiol in the mouse (37).
As a result of disrupted ephrin signaling during embryonic development, GnRH neurons fail to migrate into the brain in an allele-dependent manner. Thus, htz GNR23 mice have approximately 200 GnRH neurons in the brain compared with approximately 80 GnRH neurons in hmz GNR23 mice (17). Remarkably, male hmz GNR23 mice exhibit normal fertility despite having reduced testis size and FSH concentrations (18). We now show that pulsatile LH secretion is abnormal in hmz GNR23 mice, with substantially reduced basal release and LH pulse amplitude, but, surprisingly, relatively normal LH pulse frequency. GDX hmz GNR23 mice exhibited approximately two LH pulses per 180 minutes compared with three in littermate wild-type mice. This indicates that only approximately 80 GnRH neurons are sufficient to generate pulsatile GnRH secretion. Because we show that the pituitary gland is very responsive to GnRH in these mice, it is likely that their markedly reduced LH pulse amplitude originates from the secretion of small-amplitude GnRH pulses. This would be compatible with the very few GnRH nerve terminals detected within the median eminence of hmz GNR23 male mice (17). Interestingly, although htz GNR23 mice exhibit normal LH pulse frequency and amplitude, they do, nevertheless, exhibit reduced basal LH levels, suggesting that a subtle deficit in LH secretion exists with only 200 GnRH neurons.
Substantial sex differences were observed in pulsatile LH secretion. As shown here, follicular-phase female mice exhibit approximately one pulse per hour compared with intact males that display one pulse every 2–3 hours (8, 13). Furthermore, OVX females exhibit three pulses per hour compared with GDX males showing only one pulse per hour. Pulse amplitude remains relatively constant at approximately 3 ng/mL in GDX males and females. This demonstrates that the free-running GnRH pulse generator in mice has a substantially faster pace in females compared with males. Although the nature of the pulse generator remains unclear, it is interesting to note sex differences in the electrical activity of the arcuate kisspeptin neurons (38) and their ability to evoke pulsatile LH secretion (39).
We provide here profiles of the LH surge in proestrous and OVX+E+E mice. As has been observed in other species, the onset of the surge is relatively abrupt but takes about 1.5 hour to reach its maximum LH concentration in mice. The duration of the surge is not clear from this investigation because we often stopped sampling before the surge had completed. Nevertheless, the surge seems likely to last for at least 3 hours in mice. The most striking feature of this analysis is the highly variable onset of the surge in proestrous mice. Surge onset spanned 4 hours and possibly longer given that 4 of the 11 proestrous mice were not found to exhibit a surge in the sampling window. The same phenomenon has been observed in the two studies that have managed to obtain blood samples from cardiac catheterization experiments in proestrous mice; in one study the two proestrous mice were reported to have a 3-hour difference in surge onset (7), whereas in the other, five proestrous mice exhibited surges, beginning over a 4-hour interval (40). This situation is in striking contrast to the OVX+E+E females in this study in which most mice exhibited surges that commenced together around 0.5 hour prior to lights off. Given that proestrous and OVX+E+E mice were housed in the same lighting conditions and thus exposed to the same circadian cues, this difference in timing must result from exposure to different profiles of circulating estradiol or unknown ovarian factors that aid surge onset. The reasons for the absence of the surge in four proestrous mice is unknown and may possibly have resulted from incorrect definition of the proestrus stage or stress. The variable onset of the surge in proestrous mice will likely require investigators to undertake prolonged blood sampling to evaluate the surge mechanism in experimental studies. Whereas the OVX+E+E paradigm provides much better synchronization of surge onset and will be easier to use, it is important to note that this is only a model of the proestrous LH surge.
The transition from normal pulsatile LH secretion to surge onset during proestrus was not documented comprehensively in the present experiments. We note that typical pulsatile LH secretion is evident in the early afternoon of proestrus but that, in surge experiments, mean LH levels were elevated in proestrous and OVX+E+E mice immediately prior to the onset of the surge. Studies in rats have documented that the surge starts abruptly from a normal pattern of pulsatile LH secretion (15, 41), and it is unclear whether the same scenario exists for mice.
In summary, we report here on the pulse and surge profiles of LH secretion in the mouse. Female mice exhibit variable patterns of pulsatile LH secretion throughout the estrous cycle in a very similar manner to rats. Gonadectomy results in a substantial increase in basal and pulsatile LH secretion and indicates that the free-running pulse generator has a periodicity of approximately 20 minutes in female mice and 60 minutes in males. Intriguingly, as few as 80 GnRH neurons are sufficient to generate pulsatile LH secretion, although the pulse amplitude, likely reflecting GnRH pulse size, is greatly reduced. Finally, we provide the profiles of the LH surge in intact and OVX+E+E mice and find that surge onset is highly variable on the afternoon of proestrus. Together these observations provide a foundation for future reproductive biology investigations in mice.
Acknowledgments
We thank Dr A. F. Parlow (National Hormone and Peptide Program, Torrance, California) for contributing valuable reagents.
This work was supported by the New Zealand Health Research Council.
Disclosure Summary: The authors have nothing to disclose.
