


Abstract
Activin production and signaling must be strictly regulated for normal testis development and function. Inhibins are potent activin inhibitors; mice lacking the inhibin-α gene (Inha−/− mice) cannot make inhibin and consequently have highly elevated activin and FSH serum concentrations and excessive activin signaling, resulting in somatic gonadal tumors and infertility. Dose-dependent effects of activin in testicular biology have been widely reported; hence, we hypothesized that male mice lacking one copy of the Inha gene would produce less inhibin and have an abnormal reproductive phenotype. To test this, we compared hormone concentrations, testis development, and sperm production in Inha+/+ and Inha+/− mice. Serum and testicular inhibin-α concentrations in adult Inha+/− mice were approximately 33% lower than wild type, whereas activin A, activin B, FSH, LH, and T were normal. Sixteen-day-old Inha+/− mice had a mixed phenotype, with tubules containing extensive germ cell depletion juxtaposed to tubules with advanced Sertoli and germ cell development. This abnormal phenotype resolved by day 28. By 8 weeks, Inha+/− testes were 11% larger than wild type and supported 44% greater daily sperm production. By 26 weeks of age, Inha+/− testes had distinct abnormalities. Although still fertile, Inha+/− mice had a 27% reduction in spermatogenic efficiency, a greater proportion of S-phase Sertoli cells and lower Leydig cell CYP11A1 expression. This study is the first to identify an intratesticular role for inhibin/inhibin-α subunit, demonstrating that a threshold level of this protein is required for normal testis development and to sustain adult somatic testicular cell function.
Activins and inhibins are related hormones first identified by their opposing influences on FSH secretion from pituitary gonadotrophs (1–3). Activins are formed by the homo- or heterodimerization of β-subunits (βA-βA: activin A; βB-βB: activin B; βA-βB: activin AB), whereas inhibins are heterodimers comprised of α-subunit and β-subunits (α-βA: inhibin A, α-βB: inhibin B). Each subunit is encoded by a different gene. Targeted mutation of these genes in mice has demonstrated the absolute requirement for the βA subunit for fetal development and postnatal survival (4) and βB for eye development and female fecundity (5). Mice lacking the α-subunit (Inha−/− mice) cannot synthesize inhibin and develop somatic gonadal tumors and other pathologies, resulting in death during early adulthood (6).
Regulated expression of activin signaling components and signaling modulators has been documented in mouse, rat, squirrel, hamster, and human testes (7–22). These data, and the overt reproductive phenotypes displayed by mice overexpressing activin signaling pathway components (23–26), support the interpretation that optimal testis development and function require strict spatial and temporal control of activin bioactivity. After reports that activin dose dependently promotes the proliferation of immature rat Sertoli cells (27, 28), in vitro and in vivo studies have illustrated the acute sensitivity of the fetal, juvenile, and adult mouse testis to altered activin bioavailability or altered ability to respond to activin (16, 17, 29–34). These studies reveal the importance of dose-dependent effects of activin on testis biology and demonstrate its relevance in fetal, juvenile, and adult life.
Inhibins and the inhibin-α subunit are potent activin inhibitors and are considered to down-regulate activin signaling via two mechanisms. First, dimerization of the α-subunit with a β-subunit is thought to deplete available β-subunits that would otherwise form the activin dimer, producing inhibin at the expense of activin. This understanding is supported by the highly elevated activin levels measured in Inha−/− mice (6, 35). Second, in conjunction with betaglycan, inhibin binds activin type II receptor receptors to prevent activin from binding and signaling (36–38). Evidence that excessive activin signaling underlies testicular pathologies of Inha−/− mice comes from Inha−/− mice administered an activin ligand trap based on the activin type II receptor, which significantly lowered FSH and markedly reduced tumor progression compared with untreated animals (39). Furthermore, tumor development is almost completely alleviated in male Inha−/− mice that also lack the activin signal transducer mothers against decapentapletic homolog 3 (40, 41).
In males, inhibin is produced predominantly by Sertoli cells, although Leydig cells also express the α subunit (10, 42, 43). Inhibin B is the principal circulating form in men and, although not a robust predictor of male fertility, is considered an indicator of testis function (44–47). Mutations in the α subunit gene are linked to premature ovarian failure (48–50), yet nothing is known about the impact of inhibin insufficiency on male reproductive health. In order to gain greater insight into the role of inhibin in male reproductive biology, we analyzed mice harboring only one copy of the gene encoding the α subunit (Inha+/− mice). Our discovery that lower inhibin-α subunit production in Inha+/− mice correlates with abnormalities in the developing and adult testis without affecting related circulating reproductive hormones identifies a previously unrecognized testicular role for inhibin and demonstrates a threshold requirement for normal testis development and adult testis function.
Materials and Methods
Experimental animals and tissues
Mice heterozygous for a loss of function mutation in inhibin-α [Inha+/−, C57BL/6 background (6)] were housed at Animal Research Laboratories (Monash University, Clayton, Australia) and Hunter Medical Research Institute (Newcastle, Australia), mated to generate Inha+/+, Inha+/−, and Inha−/− offspring and genotyped as previously described (41). Investigations conformed to the National Health and Medical Research Council/Commonwealth Scientific and Industrial Research Organisation/Australian Agricultural Council Code of Practice for the Care and Use of Animals for Experimental Purposes and were approved by the Monash University Standing Committee on Ethics in Animal Experimentation and the University of Newcastle Animal Care and Ethics Committee.
Juvenile animals were killed by decapitation and adults by carbon dioxide asphyxiation followed by cervical dislocation. Blood was collected between 8:00 and 10:00 am from juveniles (after decapitation) and adults (by cardiac puncture). Body and organ weights were recorded immediately and serum was separated as previously described (51). Animals were collected at 7, 16, and 28 days postpartum (dpp) and 8 and 26 weeks. One testis was fixed and sectioned as previously described (51) and the other was snap frozen and stored at −80°C until required. Sperm counts and estimation of daily sperm production were performed using an established method (52, 53). One testis per animal was homogenized in 600 μL of a buffer of 0.05% Triton X-100, 0.9% NaCl with an Ultraturrax T25 homogenizer at 13 500 revolutions/sec (54). Homogenates were rested until bubbles had dissipated then were vortexed to resuspend sperm. Sample was diluted 1:1 with 1% trypan blue solution (Sigma-Aldrich), and the number of homogenization-resistant sperm heads was counted in five nonoverlapping squares of 1 mm2 area of a Neubauer hemocytometer using a ×40 objective lens. This process was repeated and the 10 measurements were averaged and multiplied by the dilution factor and then by 10 000 (sperm per milliliter) and then by original homogenate volume to ascertain the number of spermatids per testis. Daily sperm production (DSP) was determined by dividing this figure by 4.84 [number of days developing mouse spermatids are in steps 14–16 (55)], and efficiency was calculated by dividing DSP by testis weight.
Hormone analyses
One testis per animal was homogenized in ice-cold 600 μL PBS containing 20 μL Protease Inhibitor Cocktail Set III (Calbiochem) and then centrifuged at 10 000 × g for 20 minutes at 4°C. Supernatant was transferred to a fresh tube, snap frozen, and stored at −80°C until assayed. FSH and inhibin measurements were performed by RIA (51). LH was measured by discontinuous RIA using rabbit LH antiserum (AFP-240580) and purified rat-LHI-8 as tracer (both kindly provided by Dr A. F. Parlow, National Institute of Diabetes and Digestive and Kidney Diseases, Bethesda, Maryland) and goat-antirabbit IgG (GAR number 12, Monash Institute of Medical Research, Clayton, Australia). Hypox ovine sera (Monash Institute of Medical Research) was added to standards to equalize sera volumes; buffer was added to the samples. Cold 0.9% saline was added and tubes were centrifuged at 2400 rpm for 45 minutes at 4°C. Supernatant was decanted and pellets counted on a Cobra 5005 γ-counter (Packard Instrument Co). Dose-response curves were linearized by logit log-dose transformation and analyzed by parallel line statistics with results expressed in terms of mouse LH reference prep (AFP-4306A). Activin A and B were measured by ELISA (56, 57). Table 1 lists intraassay coefficient of variation (CV) and limits of detection. T was measured by HPLC tandem mass spectrometry using 0.1 mL serum containing 20 μL deuterated T internal standard. Samples were extracted into 1 mL of ethyl acetate-hexane [10:90 (vol/vol)], after which 700 μL supernatant was removed, evaporated under nitrogen, and then reconstituted in 100 μL methanol-water [60:40 (vol/vol)]. Specimens were analyzed by Shimjadzu LC system using a Phenomenex Luna 2.4-μm C18, 100- × 2-mm column and quantified on an AB Sciex triple quad 5500 Q-trap, using dual multiple reaction monitoring at 97.1 and 109.2 mass to charge ratio. Results were calibrated using 1 mg/mL T standard (Sigma-Aldrich), with limit of quantitation better than 0.1 nmol/L.
Intraassay CVs and Limits of Detection for ELISAs and RIAs
| Assay | Sample | Intraassay CV | Limit of Detection |
|---|---|---|---|
| Total inhibin-α subunit RIA | Serum | 9.9% | 0.26 ng/mL |
| Testicular | 4.5% | 0.21 ng/mL | |
| (Range 2.82–8.43 ng/mL) | |||
| FSH RIA | Serum | 3.4% | 0.83 ng/mL |
| Activin A ELISA | Serum | 5.4% | 12.94 pg/mL |
| (6.5% interassay CV) | |||
| Testicular | 7.1% | 22.43 pg/mL | |
| (6.8% interassay CV) | (Range 45–81 pg/mL) | ||
| Activin B ELISA | Serum | 4% | 8.528–2495 pg/mL |
| Testicular | 4.7% | >16.87 pg/mL | |
| (114–166 pg/mL) | |||
| LH RIA | Serum | 6.7% | 0.097–11.11 ng/mL |
Immunodetection
Immunohistochemistry was performed as previously described (14) using antibodies to detect proliferating cell nuclear antigen (PCNA; 0.96 ng/mL; Dako), sex-determining region Y-box 9 (SOX9; 2 μg/mL; Santa Cruz Biotechnology), inhibin-α subunit (13.5 μg/mL; gift from Associate Professor David Robertson, Prince Henry's Institute, Clayton, Victoria, Australia), Wilm's tumor 1 (WT1; 2 μg/mL; Abcam), germ cell nuclear antigen (GCNA; 10D9G11; gift from George Enders, University of Kansas, Lawrence, Kansas; 1:100 dilution), androgen receptor (AR; 2 μg/mL; Santa Cruz Biotechnology), spalt-like transcription factor 4 (SALL4; 3 μg/mL; Abcam), and cytochrome P450, family 11, subfamily A, polypeptide 1 (CYP11A1; 0.5 μg/mL; Millipore). The lectin peanut agglutinin (PNA; 20 μg/mL; Sigma-Aldrich) enabled acrosome visualization. Antigen retrieval was achieved by heating samples to 90°C in 50 mM glycine (pH 3.5, for PCNA, SOX9, inhibin-α, GCNA, CYP11A1) or 10 mM citrate buffer (pH 6, for WT1, PNA, SALL4, AR) for 10 minutes in an 800-W microwave oven followed by cooling for 20 minutes. Blocking solution/antibody diluent consisted of either 10% normal serum in CAS blocking reagent (Invitrogen for inhibin-α) or 1%–3% BSA (all other antibodies). Antibodies were validated by Western blot [Supplemental Figure 1 and (31, 51)]. Details of all antibodies used are described in Table 2.
Antibody Table
| Peptide/Protein Target | Antigen Sequence (if Known) | Name of Antibody | Manufacturer, Catalog Number, and/or Name of Individual Providing the Antibody | Species Raised (Monoclonal or Polyclonal) | Dilution Used |
|---|---|---|---|---|---|
| PCNA | Rat PCNA | PCNA | DAKO; number M0879 | Rabbit, monoclonal | 0.96 ng/mL |
| SOX9 | Amino acids 407–496 of human SOX9 | Sox9 | Santa Cruz Biotechnology; sc-20095 | Rabbit, polyclonal | 2 μg/mL |
| Inhibin-α subunit | Not declared | Inhibin-α subunit | Gift from Associate Professor David Robertson, Prince Henry's Institute, Clayton, Victoria, Australia | Mouse | 13.5 μg/mL |
| GCNA | Not declared | GCNA | Gift from Associate Professor George Enders, University of Kansas, Lawrence, Kansas | Rat | 1:100 |
| WT1 | N terminus of human WT1 | WT1 | Abcam; number ab89901 | Rabbit, monoclonal | 2 μg/mL |
| SALL4 | Amino acids 350–450 of mouse SALL4 | SALL4 | Abcam; number ab31968 | Rabbit, polyclonal | 3 μg/mL |
| CYP11A1 | CYP11A1 | Millipore; number ABS235 | Rabbit, polyclonal | 0.5 μg/mL | |
| AR | N terminus of human AR | AR (N-20) | Santa Cruz Biotechnology; sc-816 | Rabbit, polyclonal | 0.2 μg/mL |
Biotinylated antirabbit (Invitrogen) or antimouse (Millipore) secondary antibodies were used for immunohistochemistry. Signal was amplified with Vectastain Elite ABC (Vector Laboratories) and color developed using 3,3-diaminobenzidine tetrahydrochloride (Dako). For each antibody, all slides were developed for the same length of time. Sections were counterstained with Harris or Carazzi's hematoxylin (Thermo Fisher Scientific), dehydrated in an ethanol series and mounted under distyrene, plasticizer, xylene (BDH Laboratories). Immunohistochemical detection of GCNA and SOX9 was performed on at least three sections greater than 200 μm apart from at least six animals at 7 dpp, nine animals at 16 dpp, or six animals at 28 dpp. Inha−/− testis sections served as an additional negative control for inhibin-α antibody binding. Immunofluorescent detection of WT1, CYP11A1, and SOX9 was performed using antirabbit AlexaFluor546 and of PCNA using AlexaFluor488. Nuclei were visualized with 4′6-diamidino-2-phenylindole dihydrochloride (DAPI; 0.5 μg/mL; Molecular Probes, Invitrogen), and sections were mounted in Mowiol (Sigma-Aldrich). For every sample in every experiment, assessment of nonspecific binding of secondary/tertiary reagents consisted of identical treatments without primary antibody. Assessment of Sertoli cell proliferation was performed on three or more testis sections per animal at least 200 μm apart (n = 6/genotype at 7 dpp, n = 9/genotype at 16 dpp). Quantification of CYP11A1 expression was performed on two testis sections per animal, at least 200 μm apart (n ≥ 8/genotype). Sertoli cell to spermatid ratio was determined by analyzing two testis sections per animal, at least 200 μm apart (n ≥ 6/genotype).
Imaging and morphometric analysis
SOX9, GCNA, and INHA immunohistochemistry images were captured at ×40 magnification using a Provis microscope (AX70; Olympus) and AnalySIS LS Professional software (Olympus SoftImaging Solutions). For each antibody, all images were collected in the same session under identical light intensity and exposure settings.
Germ cell depletion was assessed by imaging entire testis sections at ×20 magnification using a DotSlide microscope (BX51; Olympus). The proportion of each section containing aberrant tubules was quantified by ImageJ software (http://rsb.info.nih.gov/ij/) and plotted relative to section area. Round spermatids in these images were manually counted.
Identification of proliferating Sertoli cells was performed by imaging entire testis sections (DotSlide, ×20 magnification), under identical light intensity and exposure settings. Images were analyzed by Imaris software (Bitplane AG) with the background thresholds set against negative controls. Sertoli cells (SOX9 positive) were identified by spot detection with an estimated 10 μm nuclear diameter. Proliferative status was determined by PCNA presence/absence.
SALL4 and WT1/PNA images were captured at ×40 magnification using a Zeiss Axio Imager A1 microscope (Carl Zeiss MicroImaging Inc) and Olympus DP70 camera (Olympus). Sertoli cell to spermatid ratio was determined in round tubule cross-sections; Sertoli cell nuclei (WT1 positive) were counted manually and the number of spermatids present (PNA positive) in the same tubule cross-section was quantified using ImageJ (National Institutes of Health).
For quantification of CYP11A1 expression, images were captured using an Olympus FV1000 confocal laser scanning microscope with 3-fold Kalman averaging. Plotted values represent fluorescence measured in more than 350 cells per animal using ImageJ software (National Institutes of Health) minus background signal determined from samples processed without primary antibody.
Testis dissociation and flow cytometry
All steps were performed at room temperature unless otherwise stated. Testes were decapsulated, and the interstitial web was separated from tubules by gently teasing testes apart in phenol-free DMEM (Life Technologies). Tubules were dissociated for 15 minutes with gentle agitation in 5 mL medium containing 5 mg type II collagenase (Sigma-Aldrich) and 5 U deoxyribonuclease (Promega Corp), and then fragments were settled for 2 minutes. The enzyme mixture was removed and tubules were washed twice with PBS, resuspended in PBS containing 5 mL 0.25% trypsin/EDTA (Life Technologies) and 7 U deoxyribonuclease, agitated gently for 10 minutes, manually dissociated by gently pipetting with a small-bore transfer pipette, and then gently agitated for an additional 5 minutes. Five hundred microliters of fetal calf serum (FCS; Life Technologies) were added prior to filtering the cells through a 70-μM mesh. Cells were washed twice by pelleting at 240 rcf for 10 minutes, resuspended in 5 mL PBS, centrifuged again, and then fixed by resuspension in 5 mL ice-cold 70% ethanol and stored at −20°C until analyzed.
One-sixth of the dissociated testis cell preparation per animal was used for flow cytometry. Cells were washed twice in 5 mL PBS, resuspended in 5 mL PBS containing 3% BSA and 10% normal goat serum (Sigma-Aldrich) and then gently rocked for 45–60 minutes. Five microliters of PBS were added, and cells were pelleted (240 rcf, 5 min), resuspended in PBS, transferred to low-bind eppendorf tubes, and then centrifuged for 10 minutes at 240 rcf. Cells were resuspended in 500 μL PBS containing 200 ng WT1 antibody (Abcam) and gently rotated at 4°C overnight. The following morning, cells were washed twice with 1.5 mL PBS (10 min centrifugation at 240 rcf min) and then pelleted and resuspended in 500 μL 1% BSA/PBS containing 2 μg goat antirabbit AF488 (Molecular Probes). Cells were protected from light, rocked for 1 hour, washed twice in PBS, and then resuspended in PBS containing 0.01% propidium iodide (Sigma-Aldrich), 0.1% Triton X-100 (Sigma-Aldrich), and 1 mg ribonuclease A (Sigma-Aldrich). Flow cytometry was performed within 1 hour by FACSCanto (BD Biosciences). Doublets were gated out and 20 000 events were recorded and analyzed using FACSDiva version 6.1.3 software. Signal was gated against four controls and Sertoli cell specificity of WT1 was tested by dual immunofluorescence using an antibody to tyrosinated α-tubulin (Supplemental Figure 2).
Adult Sertoli cell proliferation assay
Dissociated testis cells were cultured on laminin-coated glass coverslips as previously described (8) for 24 hours in phenol-free DMEM (Life Technologies) supplemented with 10% FCS (Life Technologies) to facilitate adherence of somatic cells. After 24 hours, medium and floating germ cells were aspirated and wells were refreshed with DMEM containing 0.5% FCS ± 50 ng/mL activin A (R&D Systems). Cells were cultured for 4 days, with 10 μM Click-IT EdU (Life Technologies) added for the final 18 hours. Cells were fixed with 3.5% paraformaldehyde (Emgrid). EdU was detected as per the manufacturer's instructions. Cells were counterstained with DAPI, coverslips were mounted on slides, and cells were counted manually.
Statistical analysis
Statistical analyses were performed using GraphPad Prism 5 (GraphPad Software Inc). Data were tested for normal distribution using the Pearson and D'Agostino normality test; normally distributed data were analyzed by t test or one-way ANOVA and the non-Gaussian data by Kruskall Wallis/Dunn's posttest. Values were considered significantly different if P < .05.
Results
Inha+/− mice have lower testicular and serum inhibin concentrations but normal activin and FSH
To address whether the absence of one copy of the Inha gene altered inhibin and activin production, testicular and serum inhibin, activin A, and activin B concentrations were measured in adult (8 wk) mice. Per mass of tissue, testicular inhibin concentrations in Inha+/− mice were significantly lower than in wild-type mice [Inha+/+: 1.99 ± 0.34 (SD) pg/mg; Inha+/−: 1.32 ± 0.30 pg/mg, Figure 1A]. This was also reflected in total testis inhibin content (Inha+/+: 200 ± 62.81 pg, Inha+/−: 123.7 ± 20.22 pg, Figure 1B). Despite lower inhibin in Inha+/− mice, there was no difference between genotypes in the amount of activin A (Inha+/+: 1.07 ± 0.21 pg/mg; Inha+/−: 1.07 ± 0.21 pg/mg testis, Figure 1C) or activin B (Inha+/+: 0.021 ± 0.008 pg/mg; Inha+/−: 0.022 ± 0.01 pg/mg, Figure 1D) relative to testis mass or total testicular activin A (Inha+/+: 98.32 ± 20.54 pg, Inha+/−: 97.71 ± 24.56 pg, Figure 1E) or activin B (Inha+/+: 1.86 ± 0.62, Inha+/−: 2.05 ± 0.86, Figure 1F). For comparison, testis lysates from Inha knockout mice had approximately 25-fold more activin A (2342 ± 403 pg/testis, Figure 1E) and approximately 68-fold activin B (126.5 ± 4.5 pg/testis, Figure 1F) than wild type, but inhibin was undetectable. Serum inhibin concentration was significantly lower in Inha+/− compared with Inha+/+ animals (Inha+/+: 1.408 ± 0.33 pg/mL; Inha+/−: 1.048 ± 0.20 pg/mL, Figure 1G), but serum activin A and activin B concentrations were not different between genotypes (activin A: Inha+/+: 122.3 ± 41.27 pg/mL, Inha+/−: 130.0 ± 52.12 pg/mL, Figure 1H and activin B: Inha+/+: 685.5 ± 159.8 pg/mL, Inha+/−: 620.7 ± 87.2 pg/mL, Figure 1I). Lower circulating inhibin concentrations in Inha+/− did not cause a measurable shift in the testis-pituitary axis because serum FSH levels were equivalent to wild type (Inha+/+: 11.11+/−0.70 ng/ml, Inha+/−: 12.05 ± 1.23 ng/mL, Figure 1J).
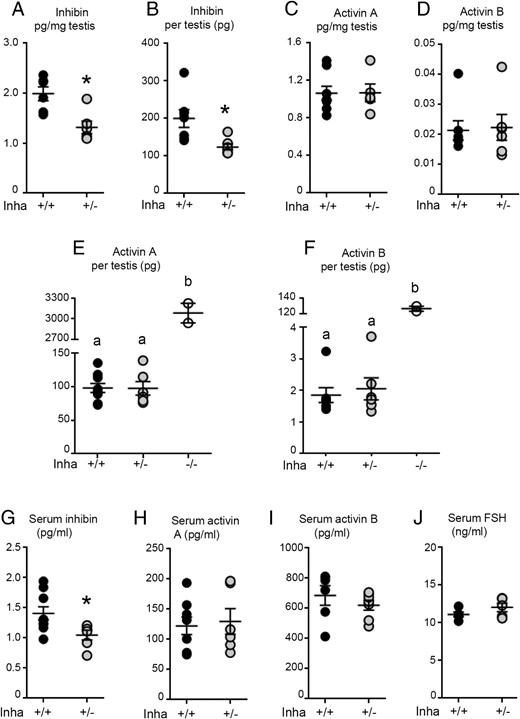
At 8 weeks of age, Inha+/− mice have lower testicular and circulating inhibin concentrations compared with age-matched wild-type littermates, but activin A, activin B, and FSH concentrations are normal. A, Inhibin concentrations per mass of testis in 8-week-old Inha+/− mice were 70% of that measured in wild-type littermates. B, Total testis levels reflected these patterns, with significantly less inhibin produced per testis in Inha+/− compared with Inha+/+ mice. Concentrations of (C) activin A and (D) activin B relative to testis mass were not different between genotypes. Total testis concentrations of (E) activin A and (F) activin B in heterozygous animals were not different from wild-type but were substantially elevated in Inha knockout mice. G, Inha+/− mice had lower circulating concentrations of inhibin-α subunit compared with wild-type littermates; however, circulating (H) activin A, (I) activin B, and (J) FSH were normal. Each data point represents a value from an individual animal, with Inha+/+ animals indicated by black circles and Inha+/− by gray circles (six or more per genotype). Bars indicate mean ± SEM. Based on assessment of data distribution, statistical significance was tested by Mann-Whitney test (A–D), Kruskall-Wallis (E and F), or t test (G–J), with P < .05 considered significant, represented either with an asterisk or different letters signifying significant differences between groups.
Eight-week-old Inha+/− mice have larger testes, greater daily sperm production, and more efficient spermatogenesis
There was no difference in body weight (Figure 2A), epididymis weight, epididymis to body weight ratio, seminal vesicle weight, or seminal vesicle to body weight ratios (Table 3) between Inha+/+ and Inha+/− mice, but testis weight and testis to body ratios of Inha+/− animals were approximately 11% greater than wild type (Figure 2, B and C). Analysis of fixed testis sections revealed no overt abnormalities in Inha+/− testes; however, DSP and spermatogenic efficiency were significantly greater in Inha+/− mice than in wild-type littermates (Figure 2, D and E). Ploidy analysis by flow cytometry determined that haploid cells comprised approximately 28% of the tubular cells in 10- to 11-week-old wild-type animals, whereas the proportion in age-matched Inha+/− mice was marginally lower (∼26%, P < .05; Figure 2, F and G). Use of 8-week-old mice generated similar results (data not shown). Serum T concentrations were not different between genotypes (Figure 2H). Increased spermatogenic efficiency in 8-week-old Inha+/− mice but similar haploid cell content at 10–11 weeks could reflect early differences in the first wave of spermatogenesis, which return to normal as adult life progresses. We therefore examined testes of younger Inha+/+ and Inha+/− mice to identify whether testicular development in Inha+/− mice deviates from the wild-type trajectory.
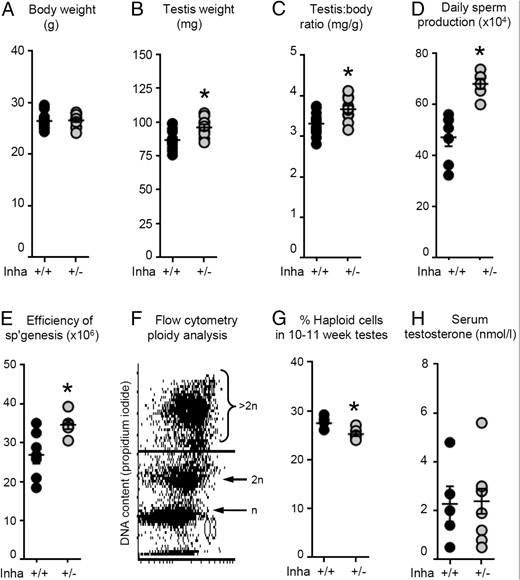
Eight-week-old Inha+/− have larger testes, greater DSP, and more efficient spermatogenesis compared with age-matched Inha+/+ littermates, but serum T concentrations are the same. A, Body weight of 8-week-old animals was not different between genotypes. Inha+/− mice had (B) larger testes and (C) testis to body weight ratios than Inha+/+ mice, which correlated with higher (D) DSP and (E) greater spermatogenic efficiency. F and G, Ploidy analysis by flow cytometry (propidium iodide) revealed that at 10–11 weeks of age, testes of Inha+/− mice had marginally fewer haploid cells compared with age-matched wild-type littermates. H, Circulating T concentrations were not different between genotypes. Each data point represents a value from an individual animal, with Inha+/+ animals indicated by black circles and Inha+/− by gray circles (≥n = 5 per genotype). Bars indicate mean ± SEM. Statistical significance was tested by a t test (A–C, E, G, and H) or a Mann-Whitney U test (D), with P < .05 considered significant (indicated by asterisk).
Inhibin-α Haploinsufficiency Does Not Alter Epididymis or Seminal Vesicle Weight at 8 or 26 Weeks of Age or Organ to Body Weight Ratios
| Organ Weights | 8-Week Inha+/+ | 8-Week Inha+/− | 26-Week Inha+/+ | 26-Week Inha+/− |
|---|---|---|---|---|
| Epididymis, mg | 0.027 ± 0.002 (n = 14) | 0.029 ± 0.003 (n = 10) | 0.040 ± 0.002 (n = 11) | 0.041 ± 0.003 (n = 10) |
| Epididymis to body ratio, mg/g | 1.045 ± 0.09 (n = 14) | 1.14 ± 0.17 (n = 10) | 2.78 ± 0.35 (n = 11) | 2.69 ± 0.28 (n = 10) |
| Seminal vesicle, mg | 0.076 ± 0.02 (n = 8) | 0.076 ± 0.02 (n = 4) | 0.16 ± 0.3 (n = 9) | 0.18 ± 0.003 (n = 7) |
| Seminal vesicle to body ratio, mg/g | 0.003 ± 0.0 (n = 8) | 0.003 ± 0.0 (n = 4) | 0.004 ± 0.0 (n = 9) | 0.005 ± 0.0 (n = 7) |
Data are represented as mean ± SD. The number in parentheses indicates the number of animals assessed. Statistical significance was tested by a t test comparing genotypes at either 8 or 26 weeks of age, with P < .05 considered significant.
Juvenile Inha+/− mice have a mixed testicular phenotype of accelerated maturation intermingled with transient tubular dysgenesis
Adult testis size and spermatogenic capacity typically reflect the extent of prepubertal Sertoli cell proliferation (58, 59). Because activin A is a potent mitogen for immature Sertoli cells (16, 17, 27, 28, 31), we predicted that lower inhibin production in Inha+/− mice may moderately up-regulate activin signaling, possibly leading to an increased proliferative index of immature Sertoli cells, or an extended proliferative window, resulting in larger testes and greater sperm production in adult Inha+/− mice. However, testis morphology of day 7 Inha+/− mice appeared normal and dual-immunofluorescent detection of proliferating Sertoli cells by colocalization of PCNA and SOX9 (51) showed no difference in the proportion of proliferating Sertoli cells between genotypes at this age [Inha+/+: 36.88% ± 16.66 PCNA positive Sertoli cells (n = 6) compared with Inha+/−: 39.43 ± 9.39 (n = 6)].
At 16 dpp, there was no difference between Inha+/+ and Inha+/− body weights (Inha+/+: 7.21 ± 0.466 g; Inha+/−: 7.16 ± 0.26 g), testis weights (Inha+/+: 0.011 ± 0.001 g; Inha+/−: 0.010 ± 0.000 g), or testis to body weight ratios (Inha+/+: 0.0015+ ± 0.000 mg/g; Inha+/−: 0.0015 ± 0.000 mg/g). However, analysis of fixed testis sections revealed a remarkably varied phenotype. Inha+/− testes had substantial germ cell depletion (Figure 3A). Although these tubules appeared similar to regions in Inha−/− testes in which Sertoli cell tumors develop (6), there were distinct morphological differences between Inha+/− and Inha−/− testes. Aberrant regions of Inha−/− testes typically lacked a lumen and exhibit centralized clusters of Sertoli cell nuclei. In Inha+/− testes, germ cell-depleted regions usually had a lumen, centrally localized Sertoli cell nuclei were rarely observed, and no Inha+/− animals developed tumors. Germ cell-depleted tubules were occasionally identified in wild-type animals but were significantly more prevalent in Inha+/− mice (Figure 3B). Immunohistochemical detection of the inhibin-α subunit (Figure 3C) confirmed that the Inha+/− mice were not knockouts and revealed regional differences in staining intensity for the inhibin-α subunit at this age, as previously reported (10). Consistent with observations in the rat (60), differential expression of the inhibin-α subunit in neighboring Sertoli cells was also apparent at earlier time points (Figure 3C).
![Sixteen-day-old Inha+/− testes have a mixed phenotype of extensive germ cell depletion and advanced maturation but no evidence of prolonged Sertoli cell proliferation. A, Immunohistochemical detection of GCNA in testis sections of 16-day-old mice confirmed the presence of spermatogonia and spermatocytes in Inha+/+ and Inha+/− testes but also showed extensive regions of germ cell depletion in heterozygous animals (asterisks). Dotted circles indicate centrally localized Sertoli cell nuclei in Inha−/− seminiferous tubules [confirmed by SOX9 immunohistochemistry (data not shown)], a feature rarely observed in Inha+/− testes. No signal was detected in the absence of primary antibody (control). Sections were counterstained with hematoxylin (blue) to enable visualization of all nuclei. B, When quantified relative to unit area, germ cell depletion was significantly greater in Inha+/− testes compared with wild-type littermates (n ≥ 7 per genotype). C, Immunohistochemical detection of the inhibin-α subunit (brown) confirms that Inha+/− Sertoli cells express the inhibin-α subunit. No signal was observed in Inha−/− testes incubated with anti-inhibin α subunit (interstitial staining is due to reactivity between the antimouse secondary antibody and endogenous mouse immunoglobulins). Differential expression of the inhibin-α subunit between adjacent seminiferous tubule cross-sections was evident at 16 days of age, and differential expression in Sertoli cells within the same cord cross-section was apparent at earlier time points (5 and 10 d of age). D, Colocalization of SOX9 (Sertoli cell nuclear marker, red) and PCNA (green) (52) did not reveal any proliferating Sertoli cells in germ cell deplete tubules of Inha+/− mice (left panel), although double-positive cells were readily identified in day 16 Inha−/− testes (right panel, white arrows), consistent with the formation of Sertoli cell tumors (n = 9 per genotype). No fluorescence was observed in sections incubated in the absence of primary antibodies (data not shown). E, In regions of robust spermatogenesis, occasional PCNA-positive Sertoli cells were identified at approximately the same frequency in wild-type and heterozygous animals (white arrows). In Inha+/− testes, the presence of proliferating spermatogonia (PCNA positive, SOX9 negative, yellow arrowheads) in germ cell deplete regions provides evidence of the capacity for the remaining germ cells in these regions to replenish spermatogenesis. F and G, Advanced spermatogenesis in day 16 Inha+/− animals was indicated by the presence of significantly more round spermatids (black arrows) per unit area compared with Inha+/+ mice (n = 7 per genotype, brown staining identifies SOX9 positive Sertoli cell nuclei), which correlated with (H) advanced Sertoli cell maturation, evidenced by a greater proportion of basally localized nuclei (64) (n = 9 per genotype). Sections were counterstained with hematoxylin (blue). Images were collected at ×40 magnification for (A, C, and F) and ×20 magnification for (D and E). for panels (B, G, and F), data are presented as values from individual animals, with Inha+/+ animals represented by black circles and Inha+/− by gray circles; bars indicate mean ± SEM. Statistical significance was tested by Mann-Whitney U test (B) or t test (G and H), with P < .05 considered significant. *, P < .05; ***, P < .001.](https://oup.silverchair-cdn.com/oup/backfile/Content_public/Journal/endo/156/6/10.1210_en.2014-1555/3/m_zee9991579930003.jpeg?Expires=1750271082&Signature=CB6C5e~MtG2B~iRlWnRa5GKBwdwMH5d4BnLOGDLinXQGD5cJFcwu1L2z-fz6gsTbyNKDpGzIYXesy-9QI3Wg7myGbzZ35qUYIbWD59ch3kmS6qYyXrQ85mFfI~t-oHwyHUJ0ivUpbpGtNYD0nYYJ2W6eS0HBYHjoAITWOhyCEGwl-zNXk8f8bNYQtP9W7ofOhI9ygzSrUPWy~0-zxai4SYriJZ5QD~qFHEfr2RY0Ocb~E~enpiMpnFB15BdIAaCmA-hNKnodf6iDdfdbNDhL3KqZzCKXRWgLy5NocAZi05I-Yqh1Pn-3kVtuZXiu2qQ6WiNBWAbLmUfE5alxktYf1Q__&Key-Pair-Id=APKAIE5G5CRDK6RD3PGA)
Sixteen-day-old Inha+/− testes have a mixed phenotype of extensive germ cell depletion and advanced maturation but no evidence of prolonged Sertoli cell proliferation. A, Immunohistochemical detection of GCNA in testis sections of 16-day-old mice confirmed the presence of spermatogonia and spermatocytes in Inha+/+ and Inha+/− testes but also showed extensive regions of germ cell depletion in heterozygous animals (asterisks). Dotted circles indicate centrally localized Sertoli cell nuclei in Inha−/− seminiferous tubules [confirmed by SOX9 immunohistochemistry (data not shown)], a feature rarely observed in Inha+/− testes. No signal was detected in the absence of primary antibody (control). Sections were counterstained with hematoxylin (blue) to enable visualization of all nuclei. B, When quantified relative to unit area, germ cell depletion was significantly greater in Inha+/− testes compared with wild-type littermates (n ≥ 7 per genotype). C, Immunohistochemical detection of the inhibin-α subunit (brown) confirms that Inha+/− Sertoli cells express the inhibin-α subunit. No signal was observed in Inha−/− testes incubated with anti-inhibin α subunit (interstitial staining is due to reactivity between the antimouse secondary antibody and endogenous mouse immunoglobulins). Differential expression of the inhibin-α subunit between adjacent seminiferous tubule cross-sections was evident at 16 days of age, and differential expression in Sertoli cells within the same cord cross-section was apparent at earlier time points (5 and 10 d of age). D, Colocalization of SOX9 (Sertoli cell nuclear marker, red) and PCNA (green) (52) did not reveal any proliferating Sertoli cells in germ cell deplete tubules of Inha+/− mice (left panel), although double-positive cells were readily identified in day 16 Inha−/− testes (right panel, white arrows), consistent with the formation of Sertoli cell tumors (n = 9 per genotype). No fluorescence was observed in sections incubated in the absence of primary antibodies (data not shown). E, In regions of robust spermatogenesis, occasional PCNA-positive Sertoli cells were identified at approximately the same frequency in wild-type and heterozygous animals (white arrows). In Inha+/− testes, the presence of proliferating spermatogonia (PCNA positive, SOX9 negative, yellow arrowheads) in germ cell deplete regions provides evidence of the capacity for the remaining germ cells in these regions to replenish spermatogenesis. F and G, Advanced spermatogenesis in day 16 Inha+/− animals was indicated by the presence of significantly more round spermatids (black arrows) per unit area compared with Inha+/+ mice (n = 7 per genotype, brown staining identifies SOX9 positive Sertoli cell nuclei), which correlated with (H) advanced Sertoli cell maturation, evidenced by a greater proportion of basally localized nuclei (64) (n = 9 per genotype). Sections were counterstained with hematoxylin (blue). Images were collected at ×40 magnification for (A, C, and F) and ×20 magnification for (D and E). for panels (B, G, and F), data are presented as values from individual animals, with Inha+/+ animals represented by black circles and Inha+/− by gray circles; bars indicate mean ± SEM. Statistical significance was tested by Mann-Whitney U test (B) or t test (G and H), with P < .05 considered significant. *, P < .05; ***, P < .001.
A possible reason for the larger testes and greater DSP in 8-week-old Inha+/− mice with no difference in testis size at day 16 could be a prolonged period of Sertoli cell proliferation (61). Colocalization of PCNA and SOX9 in 16 dpp testes failed to identify any proliferating Sertoli cells in tubules of germ cell-depleted regions, although they were readily detected in Inha-/− testes (Figure 3D). In tubules with unhindered spermatogenesis, rare proliferating Sertoli cells were detected, but they were also detected at approximately the same frequency in wild-type animals (Figure 3E). PCNA-positive spermatogonia (SOX9 negative cells) in germ cell depleted tubules of day 16 Inha+/− testes (Figure 3E) indicates the presence of spermatogonia, which we propose enable repopulation of the germ cell-deplete regions, consistent with robust spermatogenesis later observed. Unexpectedly, we also observed regions of advanced maturation in 16 dpp Inha+/− testes, with round spermatids regularly detected, approximately 4 days earlier than normal [(62) Figure 3, F and G]. Detection of SOX9 established that a significantly greater proportion of Sertoli cells had a basally localized nucleus (Figure 3H), indicative of advanced Sertoli cell maturation (51, 63).
By 28 dpp, body weight, testis weight, and testis to body weight ratios were not different between genotypes (Supplemental Table 1). The germ cell depleted phenotype of the Inha+/− testes had resolved, with all tubules populated by differentiating germ cells. Detection of SALL4-positive stem and undifferentiated spermatogonia (64) revealed no obvious differences between Inha+/+ and Inha+/− testes (Figure 4A). Visualization of Sertoli cell nuclei by immunodetection of WT1 protein (65) and acrosomes of developing spermatids by reactivity to the lectin PNA (66) established a ratio of approximately 10 spermatids per Sertoli cell in Inha+/+ and Inha+/− mice (Figure 4, B and C; flow cytometry was not possible due to insufficient tissue availability). This is similar to values previously reported (67), indicating no obvious ongoing spermatogenic deficiency in young Inha+/− mice after the transient defect present at 16 dpp.
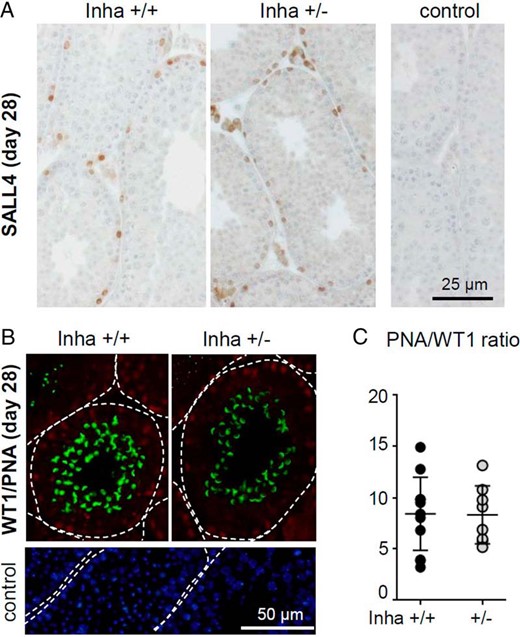
Germ cell depletion in Inha+/− testes resolves by 28 dpp. A, At 28 days of age, robust spermatogenesis was evident in all tubules of Inha+/+ and Inha+/− mice. Detection of SALL4-positive germ cells (undifferentiated spermatogonia and stem cells, brown) revealed no obvious differences between genotypes. Testis sections were counterstained with hematoxylin to permit visualization of nuclei (n = 6 per genotype) and no staining was observed in the absence of primary antibody. B, Immunofluorescent detection of Sertoli cell nuclei (WT1 positive, red) and spermatids (PNA, green), with dotted lines indicating the perimeter of the seminiferous tubule. No signal was observed in the absence of the anti-WT1 antibody or lectin (control); DAPI (blue) confirms the presence of cells in the tissue section. C, Assessment of round testis sections established that, where present, there was no difference in the ratio of spermatids to Sertoli cell nuclei (PNA/WT1) between genotypes. Data points represent individual animals, with Inha+/+ mice indicated by black circles and Inha+/− by gray circles (n = ≥ 6 per genotype). Bars indicate mean ± SEM. Groups were compared by t test, with P < .05 considered significant; all images were captured at ×40 magnification.
Inha+/− mice exhibit age-related decline in daily sperm production, spermatogenic efficiency, and Sertoli and Leydig cell function
Follistatin-like 3 binds to and inhibits signal transduction of several ligands of the TGFβ superfamily, including activin (68). A recent report describing increased adult testis size and delayed testicular senescence in Fstl3 knockout mice (69) led us to investigate whether testicular ageing was altered in Inha+/− animals. At 26 weeks, there was no difference in body weight (Figure 5A), testis weight (Figure 5B), or testis to body weight ratios (Figure 5C) between Inha+/+ and Inha+/− animals. These results are starkly different from the phenotype observed at 8 weeks of age (Figure 2), demonstrating that during the first 4 months of adulthood (8–26 wk), testes of wild-type animals increased in weight by approximately 20% (86.59 ± 7.15 mg at 8 wk vs 104.2 ± 7.91 at 26 wk, P < .0001), whereas testes of Inha+/− animals did not increase (96.05 ± 6.99 mg at 8 wk compared with 103.6 ± 9.89 mg at 26 wk, P = .053). At 26 weeks, of age, Inha+/− males remained fertile, but DSP was reduced to 80% of the output of age-matched wild-type animals [Figure 5D, P = .026; a reduction in DSP of 27.5% compared with 8 wk old Inha+/− mice (P = .0009)]. Spermatogenic efficiency in wild-type animals was maintained between 8 and 26 weeks; however, in 26-week-old Inha+/− mice, spermatogenic efficiency had declined to 80% of wild-type levels (Figure 5E) and 77% of that measured in 8-week-old Inha+/− mice (P = .0009). Inha+/− testes had mostly normal spermatogenesis; however, tubules were sporadically noted in which elongating spermatids were depleted or absent or in which the seminiferous epithelium appeared underpopulated (Figure 5F), features not observed in wild-type mice. Flow cytometric analysis identified that 30% of cells in testes of 26-week-old Inha+/+ mice were haploid, compared with approximately 25% in Inha+/− mice (Figure 5G, P < .01). Circulating activin A and B, FSH, and T concentrations (Figures 5, H–K) were not different between genotypes, although serum inhibin concentrations remained significantly lower in Inha+/− animals (Figure 5L).

By 26 weeks of age, daily sperm production and spermatogenic efficiency in Inha+/− mice has declined without measurable changes in circulating hormone concentrations. A, Body weight, (B) testis weight and (C) testis to body weight ratios of Inha+/− mice were the same as wild type by 26 weeks of age; however, (D) DSP and (E) spermatogenic deficiency had significantly declined. F, Histological analysis of hematoxylin-stained testis sections revealed a loss of postmeiotic germ cells in some tubules of Inha+/− mice (magnification, ×40) and was corroborated by flow cytometric ploidy analysis (G), which showed a significantly lower proportion of haploid cells in Inha+/− mice compared with age-matched, wild-type littermates. H–L, The reduction in postmeiotic germ cells in Inha+/− was not associated with changes in circulating concentrations of activin A, activin B, FSH, or T, but serum inhibin concentrations remained significantly lower compared with wild type. Data points represent values from individual animals, with Inha+/+ animals indicated by black circles and Inha+/− by gray circles (n = ≥ 5 per genotype). Bars indicate mean ± SEM. Statistical significance was tested by t test (A–E, G–I, and K) or Mann-Whitney U test (J), with P < .05 considered significant (indicated by asterisk).
The presence of fewer postmeiotic germ cells in 26-week-old Inha+/− mice could indicate altered function of testicular somatic cells. It is presently understood that a predominantly nonproliferative, terminally differentiated Sertoli cell population is necessary to support robust spermatogenesis, although some adult Sertoli cells are reported to have proliferative capacity (29, 70). Ploidy analysis of Sertoli cells (WT1 positive) by flow cytometry established that Sertoli cells with more than 2n DNA content were present in similar proportions in both Inha+/+ and Inha+/− testes at 10–11 weeks of age (Figure 6, A and B). By 26 weeks of age, the proportion of S-phase Sertoli cells in Inha+/+ mice declined but in Inha+/− mice had increased (P < .0001, Figure 6B). We hypothesized that lower inhibin levels in Inha+/− facilitated increased activin signaling, implying a role for activin in the proliferation of adult Sertoli cells. A direct role for activin in adult Sertoli cell proliferation was confirmed by measuring EdU incorporation in cultured 12-week-old Sertoli cells; a basal proliferation rate of approximately 5% (EdU for the last 18 h of 96 h culture) increased to 20%–40% in Sertoli cells exposed to 50 ng/mL activin A (Figure 6, C and D).

Sertoli and Leydig cell function are impaired in 26-week-old Inha+/− mice. A, S-phase Sertoli cells are present in testes of adult Inha+/+ and Inha+/− mice, detected by flow cytometry using an antibody to WT1 (see Materials and Methods and Supplemental Figure 2 for detailed description of method and controls). B, Similar proportions of S-phase Sertoli cells were detected in young adult Inha+/+ and Inha+/− mice. By 26 weeks of age, the number of S-phase Sertoli cells in Inha+/+ had reduced, but the proportion of proliferating Sertoli cells in Inha+/− testes had increased. C and D, Culture of adult (12 wk) Sertoli cells with activin A promoted EdU incorporation (green), with Sertoli cell identity confirmed by detection of WT1 (red, n = 3, images collected at ×20 magnification). No fluorescence was observed in samples incubated without primary antibody; DAPI counterstaining confirmed presence of cells. E–J, Quantification of CYP11A1 expression (red fluorescence) in Leydig cells of Inha+/+ and Inha+/− mice established that expression levels were similar between genotypes at 8 weeks of age (images collected at ×60 magnification). By 26 weeks, a trend of decreased signal intensity was indicated in testes of Inha+/+ mice, but a significant decrease was measured in Inha+/− mice. Sections were counterstained with DAPI, and no signal was detected in the absence of primary antibody (control; n ≥ 6 per genotype). K, Serum LH concentrations did not differ between genotypes at 8 or 26 weeks of age. L–P, Immunohistochemistry confirmed nuclear localization of the AR in peritubular myoid, Leydig, and Sertoli cells, indicating sufficient androgen availability to activate this transcription factor (images collected at ×40 magnification). Most Sertoli cells in Inha+/+ testes were localized to the base of the cell; however, irregularities were seen in 26-week-old Inha+/− mice, with a greater proportion of misplaced Sertoli cell nuclei (M; black arrows) and apparent sloughing of Sertoli cells from the seminiferous epithelium (N; black arrows), which was observed in one mouse. No signal was observed in samples incubated without primary antibody. Data points represent values from individual animals, with Inha+/+ animals indicated by black circles and Inha+/− by gray circles. Bars indicate mean ± SEM. Statistical significance was tested by ANOVA (B, J, K, and P) or a Mann-Whitney U test (D), with P < .05 considered significant. Significant differences between groups are indicated by either asterisk or different letters.
T is a key regulator of Sertoli cell terminal differentiation and cell cycle exit and is essential for maintaining sperm production (71, 72). Although circulating T concentrations were not different between Inha+/+ and Inha+/− mice, it remained possible that the small shift toward increased Sertoli cell proliferation and loss of spermatids in 26-week-old Inha+/− mice reflected regionalized T deficiency. CYP11A1 is a critical rate-limiting enzyme upstream of T synthesis that is expressed in Leydig cells and is down-regulated upon aging (73). Quantification of CYP11A1 using confocal images (Figure 6, E–J) established that expression is similar in Inha+/+ and Inha+/− mice at 8 weeks of age. Twenty-six-week-old Inha+/+ mice exhibited a trend toward reduced fluorescent intensity, whereas a significant decline was measured in Inha+/− mice, suggestive of functional decline of Inha+/+ Leydig cells by 26 weeks of age. Because LH up-regulates Cyp11a1 transcripts in a mouse Leydig cell tumor cell line (74) and LH levels are reported to increase with age in men (75), we investigated whether differences in circulating LH in Inha+/+ and Inha+/− mice could explain why CYP11A1 expression declines during adulthood in Inha+/− mice. Serum LH concentrations did not differ between genotypes at either 8 or 26 weeks (Figure 6K), implicating a requirement for inhibin in maintaining CYP11A1 expression in adult mice.
To identify whether declining CYP11A1 expression might lead to focal regions of T deficiency that may not otherwise be detectable, AR immunolocalization was performed. AR was localized to the nucleus of peritubular myoid cells, Leydig cells, and Sertoli cells (Figure 6, L–O), indicating sufficient androgen availability for AR activation. However, this approach did reveal Sertoli cell abnormalities in 26-week-old Inha+/− mice, with fewer basally localized Sertoli cell nuclei compared with 26-week wild-type animals (Figure 6P). In one animal, sloughing of Sertoli cells from the seminiferous epithelium was apparent (Figure 6N). There was no obvious association between the observed abnormalities in spermatogenesis and areas of reduced CYP11A1 expression or Sertoli cell abnormalities.
Discussion
This study has demonstrated that Inha haploinsufficiency lowers testicular and circulating inhibin concentrations and impairs mouse testis function without altering related reproductive hormones. These are intriguing findings because in addition to directly inhibiting activin signaling, inhibin has long been considered to antagonize activin production. Substantially elevated serum activin A and B concentrations in Inha−/− mice was interpreted to be a consequence of the absence of the α-subunit, leading to unhindered dimerization of β-subunits (76). That study reported normal serum concentrations of activin A and B in Inha heterozygous mice, but it did not simultaneously measure inhibin; thus, direct correlations of activin and inhibin production could not be made. Our approach of measuring total inhibin and activin A and B concentrations in each animal shows that Inha+/− mice have normal circulating activin concentrations despite inhibin levels being one-third lower than normal. Because circulating activin is derived from gonadal as well as nongonadal sources (77), whereas inhibin is primarily of gonadal origin (43, 78, 79), we predicted the greatest impact of reduced inhibin production on activin synthesis might occur in the testis. However, this was not the case, suggesting that moderately reduced inhibin-α subunit availability was not sufficient to favor increased β-subunit dimerization or, alternatively, that there are other as-yet-unknown mechanisms regulating activin production. Furthermore, the fact that serum FSH concentrations were not different from wild-type despite significantly lower serum inhibin may reflect resilience in the regulation of FSH secretion, with pituitary function sustained across a broad range of inhibin concentrations.
Distinct age-related differences in Inha+/− mice in the absence of measurable hormonal changes are strong evidence for an intratesticular function of inhibin. The mixed phenotype at 16 dpp of accelerated spermatogenesis alongside regions with considerable germ cell loss identifies this age as particularly sensitive to Inha haploinsufficiency. In the context of the dynamic expression of the inhibin-α subunit that is evident both in neighboring Sertoli cells and in adjacent tubules in the immature testis, it is conceivable that loss of one copy of the Inha gene may result in regionalized inhibin-α insufficiency that results in striking regionalized phenotypic effects. Yet mechanisms to enable recovery of spermatogenesis must exist because testes appeared normal by 28 days. Subtle differences during this recovery period likely lead to the increased spermatogenic efficiency in young Inha+/− adult mice, possibly reflecting greater capacity for each Sertoli cell to support more differentiating germ cells during the first wave of spermatogenesis compared with that in the adult. A recent characterization of inducible nitric oxide synthase-deficient mice showed that enhanced spermatogenic efficiency correlated with increased immature Sertoli cell proliferation, with evidence of greater androgen production without obvious defects in pubertal testis development (80, 81). These features are not shared with Inha+/− mice, implying that altered nitric oxide production is an unlikely candidate for the greater spermatogenic efficiency observed in 8 week old Inha+/− mice.
Whereas 6-month-old Inha+/− mice were fertile, this study presents the first evidence that a threshold level of inhibin or the inhibin-α subunit is required to maintain full spermatogenesis throughout adulthood. This extends our understanding of inhibin beyond the historical consideration that it is merely a passive marker of testis function (44, 82) and is an important finding with potential relevance for understanding testicular function in boys and men. At all ages examined, Inha+/− mice appear healthy without obvious confounding factors, such as ill health, weight loss, FSH deficiency, or obesity (83–86), which could otherwise explain the reduction in DSP as adulthood progresses. We postulate that the changes exhibited by Inha+/− Sertoli and Leydig cells reflect impaired functionality of the testicular somatic environment and its compromised capacity to support complete, ongoing spermatogenesis. Several studies have identified an increased risk of premature ovarian failure in women with mutations in the Inha gene that result in lower inhibin production (48–50, 87). Males also carry these mutant alleles (48), but the link between these mutations, inhibin production, and male reproductive function has not been explored. Furthermore, men experience a slight, but significant, decline in serum inhibin B from approximately 30 years of age (88, 89), occurring 10–15 years before changes in circulating FSH, LH, T, or activin A and coinciding with an age-related decline in total sperm output (90–94). Our finding that chronic inhibin insufficiency is associated with declining daily sperm production and testicular abnormalities without affecting hormone concentrations leads us to propose that Inha+/− mice will be a useful tool for investigating the impact of inhibin insufficiency in different contexts relevant to human male reproductive physiology.
Acknowledgments
We thank Professor Martin Matzuk (Baylor College of Medicine, Houston, Texas) for the kind gift of the inhibin knockout mice; Associate Professor David Robertson (Prince Henry's Institute, Clayton, Victoria, Australia) for the anti-inhibin-α antibody; Associate Professor George Enders (University of Kansas, Lawrence, Kansas) for the gift of the GCNA antibody; and Susan Hayward for performing the activin and inhibin assays. Provision of reagents for the activin A and B assays by Oxford Brookes University (Oxford, United Kingdom) and initial development of the activin B assay by Dr Helen Ludlow is gratefully acknowledged. The automated imaging and morphometric analysis was performed at the Monash Micro Imaging Facility (Monash University, Clayton, Victoria, Australia). Access to flow cytometry equipment and advice from Nicole Cole at the Analytical Biomolecular Research Facility at the University of Newcastle is gratefully acknowledged. We are also indebted to Nicole Hansbro for assistance in performing cardiac punctures.
This work was supported by a National Health and Medical Research Council of Australia Grant GNT1011192 (to C.I.), Senior Research Fellowship Grants 545916 (to K.L.L.) and 1020269 (to M.P.H.) and the Victorian State Government Operational Infrastructure Support Program.
Disclosure Summary: The authors have nothing to disclose.
Abbreviations
- AR
androgen receptor
- CV
coefficient of variation
- CYP11A1
cytochrome P450, family 11, subfamily A, polypeptide 1
- DAPI
4′6-diamidino-2-phenylindole dihydrochloride
- dpp
days postpartum
- DSP
daily sperm production
- FCS
fetal calf serum
- GCNA
germ cell nuclear antigen
- PCNA
proliferating cell nuclear antigen
- PNA
peanut agglutinin
- SALL4
spalt-like transcription factor 4
- SOX9
sex-determining region Y-box 9
- WT1
Wilm's tumor 1.
