


Abstract
To understand how endothelial cell (EC) dysfunction contributes to the failure of arteriovenous graft (AVG), we investigated the role of fibroblast-specific protein 1 (FSP-1) in cultured ECs and a mouse AVG model. In vitro, we uncovered a new FSP-1-dependent pathway that activates rho-associated, coiled-coil-containing protein kinase 1 (ROCK1) in ECs, leading to phosphorylation of myosin light chain 2 resulting in EC dysfunction. In cultured ECs, high glucose stimulated FSP-1 expression and increased permeability of an EC monolayer. The increase in permeability by the high glucose concentration was mediated by FSP-1 expression. Treatment of cultured ECs with FSP-1 caused leakage of the endothelial barrier plus increased expression of adhesion molecules and decreased expression of junction molecules. These responses were initiated by binding of FSP-1 to receptor for advanced glycation end products, which resulted in ROCK1 activation. In vivo, diabetes increased infiltration of inflammatory cells into AVGs and stimulated neointima formation. Increased FSP-1 expression and ROCK1 activation were found in AVGs of diabetic mice. Blocking FSP-1 suppressed diabetes-induced ROCK1 activation in AVGs. In mice with FSP-1 knockout or with ROCK1 knockout, accumulation of inflammatory cells and neointima formation in AVG were attenuated despite diabetes. Thus, mechanisms of inhibiting FSP-1 in ECs could improve AVG function.
Arteriovenous grafts (AVGs) are commonly created to relieve ischemic heart disease, and a functioning arteriovenous fistula is the “life line” of dialysis patients. Unfortunately, as many as 50% of AVGs fail within 10 years of the procedure (1, 2). Failure of AVGs is mainly due to neointima formation, and as expected, there has been intense interest in determining how a neointima is formed in AVGs and how its formation can be blocked. In pursuing this question in a mouse model of AVG, we have found that endothelial cell (EC) dysfunction in the AVGs is associated with neointima formation (3).
The endothelium, at the interface between the extravascular space and blood, plays a crucial role in maintaining vascular function (4). For example, after EC injury or exposure to vascular risk factors, vascular permeability increases, promoting extravasation of inflammatory cells that contributes to formation of the neointima (3). The mechanism by which EC dysfunction causes failure of arteriovenous fistula depends on a change in a Notch-induced endothelial phenotype (5). In mice with chronic kidney disease, these adverse responses to EC in arteriovenous fistulas are aggravated (5). However, our results did not identify how EC dysfunction is mediated and which factor is involved in this process. To address this question, we examined the potential candidates that cause dysfunction of ECs.
Fibroblast-specific protein 1 (FSP-1) is one of the potential candidates to cause EC dysfunction. It is a member of the S100 family of calcium-binding proteins and is expressed in fibroblasts as well as in cancer and inflammatory cells. It is not expressed in normal vascular cells but is up-regulated in diseases (5). Secreted FSP-1 acts as a paracrine factor that induces cell proliferation and migration of smooth muscle cells (SMCs) and macrophages (6, 7). FSP-1 also binds to nonmyosin light chain 2 (MLC2) to increase cell motility (8). In colorectal cancer cells or melanoma cells, FSP-1 has been shown to interact with receptor for advanced glycation end products (RAGEs) and promote metastases (9). The role of FSP-1 as the stimulus of EC leakiness and dysfunction in AVGs has not been identified.
Our goal is to identify a mechanism that interferes with EC barrier dysfunction in AVGs. We found that FSP-1 initiates EC barrier dysfunction by a mechanism that activates rho-associated, coiled-coil-containing protein kinase 1 (ROCK1) resulting in alterations of adhesion and junction molecules. The alterations increase inflammatory cell infiltration, trigger neointima formation, and ultimately, the failure of AVGs.
Materials and Methods
Animals
All studies were approved by the Institutional Animal Care and Use Committee of Baylor and performed in accordance with National Institutes of Health guidelines. Mice were housed in a conventional animal facility with a 12-hour light, 12-hour dark cycle. Wild-type (WT) mice (C57BL/6J) and FSP-1 knockout (KO) mice (B6.129S4-S100A4tm1Egn/YunkJ, stock number 012904) were from The Jackson Laboratory. ROCK1 KO mice (FVB) were used as described (10). The genotyping was performed according to the protocol provided in The Jackson Laboratory.
Diabetes model
Eight week-old male mice were injected on 3 consecutive days with 80-mg/kg·d streptozotocin (STZ) (Sigma-Aldrich) in 0.1M citrate buffer (pH 4). Control mice were injected only with the citrate buffer. Diabetes was confirmed by tail-vein blood glucose measurements (10). We did not treat the mice with insulin, because it substantially increases the variability in blood glucose and hence the number of mice required for the experiments. The STZ-based protocol that we used is similar to that of other investigators (11–15) and yields mice with blood glucose values of more than 300 mg/dL. In addition, insulin is an established factor that interferes with SMC growth and neointima formation (16) and would complicate interpretation of results. The creatinine assay was performed according to the procedure in QuantiChrom Creatinine Assay kit (DICT-500) (BioAssay Systems). Urine albumin was measured by following the protocol of the Albuwell M ELISA kit (Exocell, Inc).
Mouse AVG model
AVGs were created as described previously (7). In brief, the right common carotid artery of a male mouse was mobilized and divided. A cuff was placed on both ends of the artery, and the ends were everted over the cuff and ligated with an 8.0 silk suture. Vena cavas from donor mice were grafted between the 2 ends of the carotid artery by “sleeving” the ends of the vein over the cuff and securing them with 8.0 silk sutures. After 4 weeks, AVGs were removed and the thicknesses of the neointima plus lumen were measured. The vessel wall thickness was measured as area of the vessel minus that of the lumen using National Institues of Health Image Program ImageJ and AxioVision software. Five cross-sections were examined by an observer blinding to the treatment.
Reagents and virus
Penicillin, streptomycin, DMEM, and fetal bovine serum were obtained from Invitrogen Life Technologies. The protein assay kit was from Bio-Rad, and dextran-FITC was purchased from Sigma-Aldrich. The FSP-1 antibody was obtained from DAKO, and antibodies against ROCK1, CD45, CD31, and Vascular endothelial (VE)-cadherin were from BD Biosciences. Antibodies against α-SMA (Smooth muscle actin) antibodies were from Abcam. Antibodies against VCAM-1 (Vascular cell adhesion molecule 1), ICAM-1 (Intercellular adhesion molecule 1), and Occludin were from Santa Cruz Biotechnology, Inc. Antibodies against ZO-1 (Zona occulden 1) were from Zymed Laboratories. Antibodies against phosphor-MLC2 (Myosin light chain 2) were from Cell Signaling. Antibodies against neutrophil marker (MCA) were from AbD Serotec. Anti-RAGE IgG were from Santa Cruz Biotechnology, Inc. The fluorescent 700 or 800 secondary antibodies were obtained from Invitrogen. The FSP-1 recombinant protein was purified as described (7), and endotoxin was removed using the Endotoxin Free kit from QIAGEN. The FSP-1 expression recombinant adenovirus was kindly provided by Dr T. C. He (University of Chicago). The adenovirus expressing dominant-negative ROCK1 was used as described (10). The Short hairpin RNA (shRNA) FSP-1 lentivirus was from Sigma-Aldrich (for antibodies, see Table 1).
Antibody Table
| Peptide/Protein Target | Antigen Sequence (if known) | Name of Antibody | Manufacturer, Catalog Number, and/or Name of Individual Providing the Antibody | Species Raised in; Monoclonal or Polyclonal | Dilution Used |
|---|---|---|---|---|---|
| FSP-1 | FSP-1 | DAKO (A5114) | Rabbit | 1:500 | |
| Neutrophil | MCA | AbD Sero Tec (MCA771G) | Rat | 1:500 | |
| Smooth muscle actin | SMA | Abcam (ab5694) | Rabbit | 1:800 | |
| CD45 | CD45 | BD Bioscience (553076) | Rat | 1:400 | |
| Endothelial marker | CD31 | BD Pharmingen (553370) | Rat | 1:250 | |
| ICAM-1 | ICAM-1 | Santa Cruz Biotechnology, Inc (sc-7891) | Rabbit | 1:1000 | |
| VCAM-1 | VCAM-1 | Santa Cruz Biotechnology, Inc (sc-8304) | Rabbit | 1:1000 | |
| VE-cadherin | VE-cadherin | Santa Cruz Biotechnology, Inc (sc-28644) | Mouse | 1:1000 | |
| ROCK1 | ROCK1 | Epitomics (1761-1) | Rabbit | 1:1000 | |
| pMLC (T18/s19) | pMLC | Cell Signaling (3674) | Rabbit | 1:1000 | |
| pMYPT1 | pMYPT1 | Millipore (36-003) | Rabbit | 1:1000 | |
| Occludin | Occludin | Santa Cruz Biotechnology, Inc (sc-8144) | Rabbit | 1:1000 | |
| ZO-1 | ZO-1 | Santa Cruz Biotechnology, Inc (sc-8146) | Goat | 1:1000 | |
| GAPDH | GAPDH | Santa Cruz Biotechnology, Inc (sc-32233) | Mouse | 1:1000 |
Cell culture
Mouse ECs were isolated from the lungs as described (5). Human umbilical vein cells were purchased from Lonza. The ECs were maintained in Endothelial growth medium 2 Single Quot kit Supplement and Growth Factors (Lonza) plus 20% FBS. To detect FSP-1 expression in ECs, cells were incubated with mannitol or high glucose (25mM) for the indicated times, and cells were collected for Western blot analysis.
ROCK1 activation assay
ECs or vessels were lysed in RIPA buffer (Sigma), and 500 ng of MYPT1 (Myosin phosphatase target subunit 1; Upstate Biotechnology) were added to the lysates. After 30 minutes of incubation at 30°C, the reaction was stopped by adding 2× Laemmli Sample buffer (Bio-Rad). Phosphorylation of MYPT1 was detected by immunoblotting with an antiphospho-MYPT1 (Thr850; Millipore).
Immunohistochemistry
For histologic analysis, AVGs were perfused through the left ventricle with 10% phosphate-buffered formaldehyde and processed as described (17). Sections were blocked with 10% goat serum (Vector Laboratories) for 30 minutes and then incubated with primary antibodies (FSP-1, 1:300; α-SMA, 1:500; CD45, 1:200; MCA, 1:300; ICAM-1, 1:300; and VCAM-1, 1:300). Sections were washed in 0.5% Tween 20 in PBS and incubated at room temperature with a biotinylated secondary antibody (Vector Laboratories). After washing in 0.5% Tween 20 in PBS, tissue sections were incubated with an Elite ABC reagent (Vector Laboratories) followed by instructions as described in a peroxidase substrate kit (Vector Laboratories). Sections were counterstained by hematoxylin. For double immunofluorescent staining of samples, fluorescent secondary antibodies were applied to sections; 4′,6-diamidino-2-phenylindole was used in counterstaining. Pictures were recorded using a Nikon Eclipse 80i Fluorescence Microscope (Nikon).
Real-time RT-PCR
Total RNA from fresh tissue or cultured ECs was isolated using the RNeasy kit (QIAGEN). Real-time RT-PCR was performed using the Opticon real-time RT-PCR machine (MJ Research). GAPDH (Glyceraldehyde 3-phosphate dehydrogenase) was used as an internal standard. The primers was designed for mouse ICAM-1 (forward, 5′-AGATCACATTCACGGTGCTGGCTA-3′ and reverse, 5′-AGCTTTGGGATGGTAGCTGG AAGA-3′) and VCAM-1 (forward, 5′-ACTCTACTGCGCATCTTCCTTGGT-3′ and reverse, 5′-AATGCATGGCTTGGTTTGTGGAGG-3′). The primers for mouse VE-cadherin, FSP-1, and GAPDH were used as described (5).
Western blot analysis
Tissue or cell extracts were prepared in RIPA buffer; protein concentrations in the extracts were assayed using a Bradford protein assay kit (Bio-Rad), and 30-μg protein was separated by SDS-PAGE. After transfer to nitrocellulose membranes, immunoblots were probed separately with various primary antibodies after blocking with 5% skimmed milk in tris-buffered saline. Fluorescent-labeled secondary antibodies were used, and the membranes were scanned with Odyssey Infrared Imaging System (LICOR, Inc).
Endothelium permeability assay
ECs were cultured in 24-well Boyden Transwell inserts (2 × 10⁵/well) until they formed a confluent monolayer. After treatment as described, the cells were then kept in 25mM HEPES [4-(2-hydroxyethyl)-1-piperazineethanesulfonic acid]-DMEM (pH 7.4) for 15 minutes. The HEPES-DMEM was then removed from the top of the well; 100-μL FITC-labeled dextran (12 000 kDa molecular mass; 1 mg/mL in 25mM HEPES-DMEM) was added to the top of each well. Aliquots (50 μL) were removed from the bottom well at special times and collected in 96-well plates. FITC-labeled dextran was measured in a luminescence spectrometer (LS 50B; PerkinElmer) using 480 and 530 nm as the excitation and emission wavelengths, respectively. Each experiment was repeated at least 3 times.
Transendothelial migration assay
ECs were treated as in the Permeability Assay after a monolayer was formed in 24-well Boyden Transwell inserts. Bone marrow cells (2 × 10⁶) were added to the inserts and cultured for 24 hours. The number of bone marrow cells in the lower chamber was counted. Each experiment was repeated at least 3 times.
Statistical analysis
All data are presented as the mean ± SEM. Comparison between groups was made using one-way ANOVA followed by pairwise comparisons with P value adjustment; P < .05 was considered to be statistically significant.
Results
Diabetes increases neointima formation in AVGs
In a mouse model of arteriovenous fistula, we have found that chronic kidney disease accelerates neointima formation (3). To examine whether neointima accumulation is accelerated in other catabolic disorders, we studied a mouse model of type 1 diabetes (STZ injection) and examined the formation of neointima in the AVGs. After STZ, we found that the body weight decreased and the blood glucose values increased (>300 mg/dL) in diabetic mice (Figure 1, A and B). The serum creatinine was not different between control and STZ-treated mice (Figure 1C). But the urinary albumin to creatinine ratio in diabetic mice was higher vs the ratio in control mice (Figure 1D). These results indicate that STZ-treatment induces persistent hyperglycemia and body weight loss. In AVGs, there was decreased VE-cadherin (Figure 1E) and increased expression of ICAM-1 and VCAM-1 (Figure 1, F–H) plus invasion by inflammatory cells, including leukocytes (CD45+), neutrophils (MCA+); and macrophages (F4/80+ or Mac2+) (Figure 1, I and J). Diabetes also induced accumulation of α-SMA+-positive vascular SMCs in AVGs; this was followed by accelerated formation of the neointima in AVGs (Figure 1, K and L).
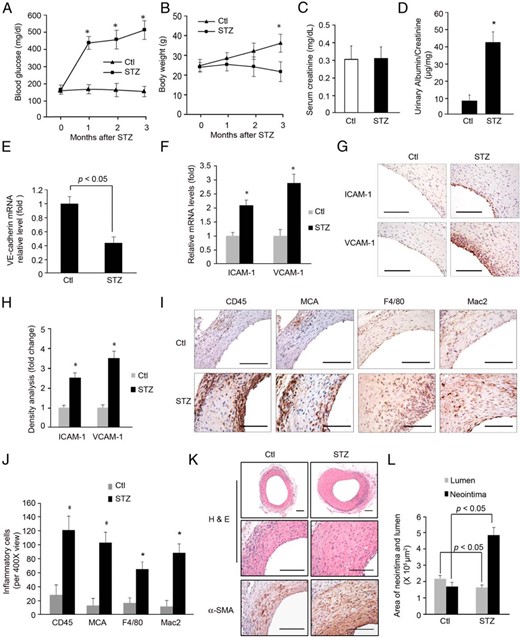
Diabetes increases neointima formation in AVGs. A and B, In mice with STZ-induced diabetes, blood glucose and body weight were measured for 3 months (n = 5; *, P < .05, vs control). C and D, Serum creatinine (C), urinary albumin, and creatinine were measured in the control and diabetic mice at 3 months after STZ treatment. The ratio of urinary albumin to creatinine was presented (D) (n = 5, P < .05). E, After 3 months of diabetes, AVGs were created and 1 month later, the RNA isolated from AVGs was evaluated for VE-cadherin expression. F–H, The expressions of ICAM-1 and VCAM-1 in AVGs were detected by RT-PCR (F) and immunostaining (G). The density analysis is shown in H (*, P < .05 vs control, n = 5). I and J, After 1 month, AVGs from control and STZ-treated mice were examined by immunostaining with antibodies against CD45 (leukocyte), MCA (neutrophil), or F4/80 and Mac2 (macrophage markers). Cells positive for each marker were counted and compared statistically (*, P < .05 vs control, n = 5). K and L, AVGs created in control and diabetic mice were analyzed. Compared with results from control mice, there was a statistically increase in the size of the neointima and number of α-SMA+-positive SMCs in AVGs of diabetic mice. Representative pictures of the neointima formed in AVGs are shown. The areas of the neointima and lumen in AVGs created in 5 mice were measured (mean ± SEM; n = 5). Scale bar in G, I, and K: 100 μm.
Diabetes increases expression of FSP-1 in ECs
In searching for the mediator of endothelial dysfunction associated with diabetes and precedes neointima formation in AVGs placed in mice, we assessed the expression of FSP-1. It was studied because it is induced not only in arteriovenous fistulas in mice but also in failed fistulas from dialysis patients (5). In AVGs created in diabetic mice, the levels of FSP-1 mRNA and protein were 2.5-fold higher than values in otherwise normal mice (Figure 2, A and B). To examine whether ECs in the AVGs express FSP-1, we coimmunostained AVGs with antibodies against FSP-1 and the EC marker, CD31; it was costained with CD31 (Figure 2, C and D).
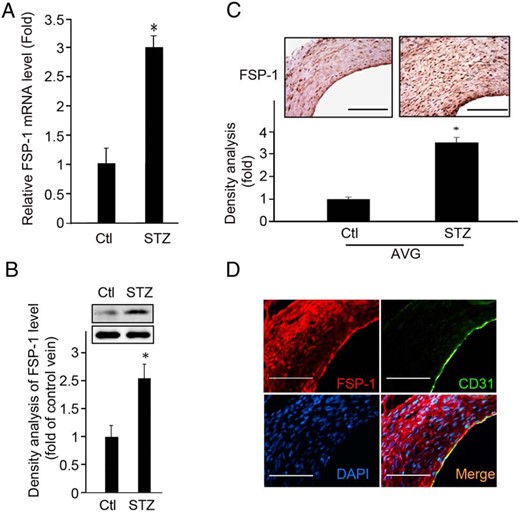
Diabetes increases the expression of FSP-1 in ECs. A and B, mRNA and protein levels of FSP-1 were assessed in AVGs. C, A representative picture of FSP-1 expression in AVGs is shown in the upper panel with the density analysis presented in the lower panel (*, P < .05 vs control, n = 5). D, FSP-1 is expressed in endothelium. Results of double immunostaining of FSP-1 (red) and EC marker, CD31 (green), in AVGs in diabetic mice, are shown. Scale bar in C and D, 100 μm.
FSP-1 suppresses EC functions
Because the increase in FSP-1 expression in ECs is parallel to the increase in neointima formation in AVGs, we examined FSP-1 expression and changes in EC functions. First, we found that a high-glucose concentration induces a 2-fold increase in FSP-1 expression in ECs (Figure 3A). As a control, we studied responses to an equimolar amount of mannitol (10mM) and found a small increase in FSP-1 expression. Treatment of ECs with 25mM glucose induced FSP-1 expression 3.5-fold over control. Again, 25mM mannitol stimulated FSP-1 to a lesser degree compared with an equimolar concentration of glucose (Supplemental Figure 1). These results suggest that a high glucose is the major factor stimulating FSP-1 expression, but we acknowledge that an increased osmolarity contributes to a lesser degree. Knockdown of FSP-1 in ECs using shRNA suppressed the permeability of a layer of ECs that was being stimulated by high glucose (Figure 3, A–C). Second, overexpression of FSP-1 in ECs using an adenovirus, AdFSP-1, impaired EC barrier function and increased EC permeability to FITC-dextran plus the transendothelial migration of bone marrow cells (Figure 3, D–F). These results suggest that FSP-1 mediates EC barrier permeability.
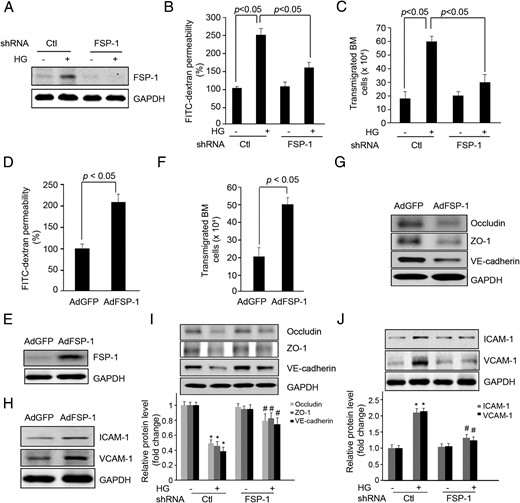
FSP-1 mediates high glucose (HG)-induced endothelial dysfunction. A–C, Endothelial permeability is suppressed by FSP-1 knock down with FSP-1 shRNA lentivirus. ECs were infected with shRNA lentivirus against FSP-1 for 48 hours followed with treatment of HG, the FSP-1 expression was detected by Western blotting (A). The FITC-dextran transwell permeability (B) and transendothelial migration of bone marrow cells were measured (C). D–F, Overexpression of FSP-1 increases EC permeability measured as FITC-dextran influx and transendothelial migration of bone marrow cells. G and H, In cultured ECs, overexpression of FSP-1 regulated the expression of junction (G) and adhesion molecules (H). I and J, FSP-1 knockdown suppressed HG-induced alterations in expression of junction (I) and adhesion molecules (J) (*, P < .05 vs control; #, P < .05 vs HG-treated group).
Increased permeability is linked to altered expression of the junction and adhesion molecules. We found that overexpression of FSP-1 decreased the expression of the junction molecules, VE-cadherin, ZO-1, and Occludin in both mouse ECs (Figure 3G) and in human umbilical vein cells (Supplemental Figure 2A). The increase in FSP-1 also stimulated the expression of the adhesion molecules, ICAM-1 and VCAM-1, in ECs (Figure 3H and Supplemental Figure 2B). When FSP-1 expression was knocked down by shRNAs, the expression of junction molecules increased, whereas the expression of adhesion molecules decreased (Figure 3, I and J). Thus, the FSP-1-induced alterations in these molecules could regulate the permeability of a monolayer of ECs.
Activation of ROCK1 mediates FSP-1-induced EC dysfunction
Because FSP-1 and ROCK1 both target MLC and regulate cell migration (8, 18). Because ROCK1 activation is at least associated with neointima formation (19), we hypothesized that FSP-1 activates ROCK1, leading to impaired EC barrier function and ultimately to neointima formation in AVGs. To test the hypothesis, we firstly examined ROCK1 expression and activity. There was a substantial induction of ROCK1 kinase activity in AVGs of mice with diabetes (Figure 4, A and B). Notably, in ROCK1 KO mice, neointima formation was reduced, and the ratio of the areas of lumen to the neointima in the AVG was about 4-fold higher vs results in wild-type mice (Supplemental Figure 3, A and B).
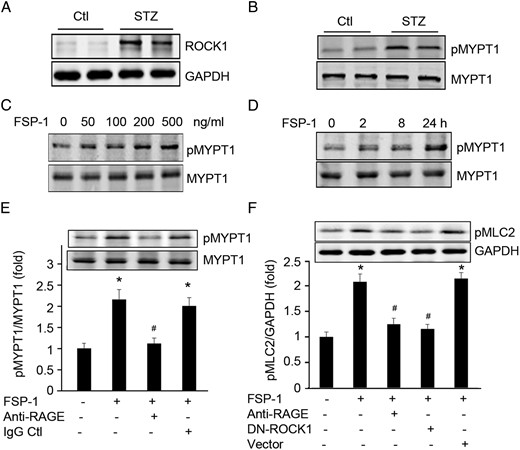
FSP-1 activates ROCK1. A and B, Diabetes enhanced expression and activation of ROCK1 in AVGs. C and D, FSP-1 treatment induced dose- and time-dependent activation of ROCK1 in cultured ECs. E, FSP-1 interacts with RAGE to activate ROCK1 kinase activity. ECs treated with anti-RAGE antibody blocked FSP-1-induced ROCK1 activity. F, FSP-1 induces phosphorylation of MLC2 via the RAGE receptor and ROCK1. ECs were pretreated with RAGE neutralizing antibodies or transfected with dnROCK1 before exposure to FSP-1 for 30 minutes, MLC2 phosphorylation was detected by Western blotting (*, P < .05 vs control; #, P < .05 vs FSP-1-treated group).
Because FSP-1 impairs EC function, we also tested whether FSP-1-induced-EC leakage is regulated via ROCK1 activation. We treated ECs with FSP-1 and found that there was a dose- and time-dependent ROCK1 kinase activation (Figure 4, C and D). Next, we examined whether RAGE is required for the FSP-1-induced ROCK1 activation because this receptor reportedly interacts with FSP-1. Pretreatment of ECs with a neutralizing antibody against RAGE in ECs blocked FSP-1-stimulated ROCK1 kinase activation and phosphorylation of a ROCK1 target, MLC2 (Figure 4, E and F). Moreover, ECs treated with a dominant-negative ROCK1 plasmid exhibited reduced-phosphorylation of MLC2 that was stimulated by FSP-1 (Figure 4F).
When RAGE in ECs was blocked with the neutralizing antibody or when ECs were transfected with a ROCK1 dominant-negative plasmid, the ability of FSP-1 to induce EC permeability as well as the expression of VCAM-1 and ICAM-1 was lost (Figure 5, A–C). These treatments also partially prevented FPS-1-down-regulated expression of the junction molecules, Occludin, ZO-1, and VE-cadherin (Figure 5D).
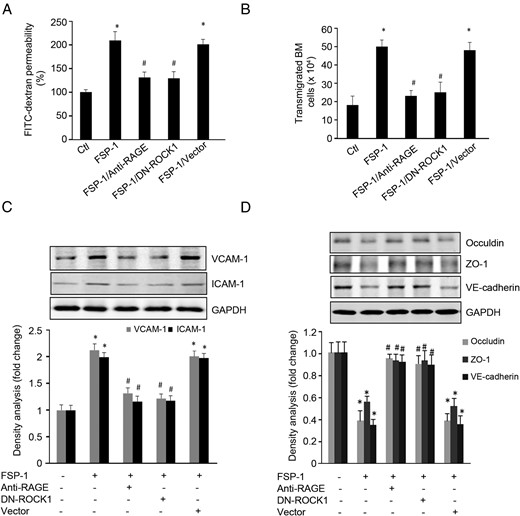
FSP-1 induced-barrier dysfunction in ECs is regulated by RAGE or ROCK1 activation. A and B, FSP-1-induced EC permeability and bone marrow cell transendothelial migration were blocked by inhibiting RAGE or dnROCK1. C, FSP-1-induced expression of ICAM-1 and VCAM-1 were suppressed by blocking RAGE or dnROCK1. D, FSP-1 decreased the expression of junction molecules. These responses were mediated by RAGE or ROCK1 activity (*, P < .05 vs control; #, P < .05 vs FSP-1-treated group).
FSP-1 KO suppresses ROCK1 activation and improves the function of AVGs
Our results suggest that FSP-1 binds to RAGE, leading to stimulation of ROCK1 activity and loss of EC barrier function. The FSP-1-activated pathway would result in formation of a neointima and ultimately, the loss of AVG function. To evaluate the therapeutic potential of blocking the pathway, we examined neointima formation in FSP-1 KO mice with diabetes. Blood glucose and body weights of wild-type and FSP-1 KO mice did not differ statistically (Figure 6, A and B). Although FSP-1 KO had no effect on serum creatinine level in diabetic mice (data not shown). There was a significant decrease in the ratio of urinary protein-to-creatinine when compared with that found in control mice (Figure 6C). ROCK1 protein and its kinase activity were suppressed in AVGs of diabetic FSP-1 KO mice (Figure 6, D and E). There also was reduced invasion of leukocytes and neutrophils into AVGs in FSP-1 KO mice compared with that of results in wild-type mice (Figure 6, F and G). Consistently, FSP-1 KO suppressed the development of the neointima, despite the presence of diabetes (Figure 6, H and I).
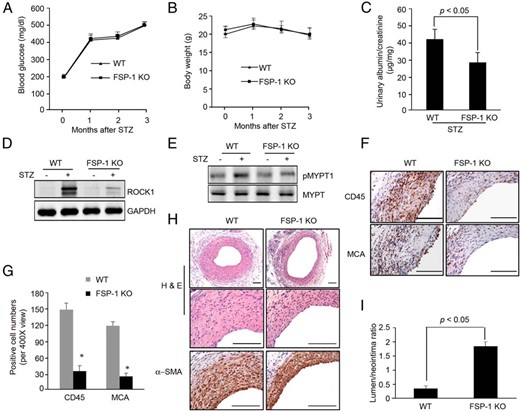
FSP-1 KO suppresses diabetes-induced neointima formation in AVGs. A and B, In mice with STZ-induced diabetes, blood glucose and body weight were measured for 3 months (n = 5 WT and FSP-1 KO mice; *, P < .05, vs control). C, Urinary albumin and creatinine were measured in the WT and FSP-1 KO mice at 3 months after STZ treatment. The ratio of urinary albumin to creatinine was presented (n = 5, P < .05). D and E, FSP-1 KO suppressed ROCK1 expression and activation in AVGs. F and G, FSP-1 KO ameliorates inflammatory cell infiltration in AVGs. AVGs from wild-type or FSP-1 KO diabetic mice were subjected to immunohistochemical staining with antibodies against CD45 and MCA (F). Staining positive cells were counted and summarized in G (*, P < .05, vs wild type; n = 5). H and I, FSP-1 KO suppressed diabetes-induced neointima formation. Representative pictures are presented after H&E and α-SMA immunostaining (mean ± SEM, n = 5; *, P < .05, compared with wild type). Scale bar in F and H, 100 μm.
Discussion
Vascular homeostasis depends on precise regulation of EC permeability to prevent the penetration of molecules from the blood into the vessel wall (4). In fact, dysfunction of the EC monolayer is a hallmark of pathologic metabolic disorders, including diabetes, atherosclerosis, hypertension, inflammation, and tumor metastasis (20, 21). For example, dysfunction of the EC monolayer after vascular injury or loss of ECs leads to increased influx of neutrophils and leukocytes into the vessel wall. Infiltration of inflammatory cells promotes the proliferation of SMCs and, hence, the growth of a neointima (7, 22, 23).
Proteinuria frequently occurs in kidney diseases and has been associated with the development of EC dysfunction. For example, the adriamycin-induced nephrotic syndrome includes decreased expression of versican in ECs but exacerbation of proteinuria (24). It is tempting to speculate that endothelial dysfunction may interact with uremic toxins, hypertension, and hyperlipidemia that are present in the severe proteinuria of the nephrotic syndrome, aggravating the formation of neoinimas in AVGs.
Recently, we reported on events in a mouse model of an arteriovenous fistula (5). Chronic kidney disease increased the expression of FSP-1 in ECs associating with the development of a neointima. In those experiments, we did not identify the role of FSP-1 in promoting EC dysfunction (5). In the current study, we uncovered a series of events in which an intracellular signaling pathway beginning with FSP-1 expression and EC dysfunction lead to formation of a neointima. Specifically, we have demonstrated that the increase in FSP-1 expression in ECs results in an interaction between FSP-1 and RAGE. The interaction, in turn, stimulates ROCK1 to phosphorylate MLC2. This step in the pathway leads to dysfunction of EC as characterized by increased expression of adhesion molecules and decreased expression of junction molecules, resulting in increased leakage of the endothelial layer. Consequently, a neointima is formed in AVGs. These observations indicate that induced FSP-1 expression in ECs could be a biomarker that signals impaired EC function.
FSP-1 (also known as S100A4) is expressed in vascular cells and affects vascular remodeling after vascular injury. Increased FSP-1 expression links to epithelial-mesenchymal transition in cancer cells (25) and migration in inflammatory cells (7). In current study, we found that increased expression of FSP-1 in ECs in diabetic mice mediates hyperglycemia-induced EC permeability. Overexpression of FSP-1 in ECs leads to altered expression of adhesion and junction molecules that result in EC inflammatory responses and barrier dysfunction.
How does FSP-1 mediate EC dysfunction? The pathway from FSP-1 to activation of ROCK1 and the alteration of adhesion and junction molecules provide new insights into the role of FSP-1 in EC dysfunction. Included in this pathway is activation of RAGE, which has been associated with other metabolic abnormalities in diabetes (26). For example, activation of RAGE accelerates the development of atherosclerosis in vein grafts placed in diabetic patients (27). Persistent hyperglycemia in STZ-treated rat and mice stimulates RAGE expression, which plays a role in the genesis of diabetic nephropathy (10, 28–30). Moreover, in STZ-induced diabetes in Apolipoptrotein E (ApoE)−/− mice, the diabetes-associated atherosclerosis is attenuated in ApoE−/−/RAGE−/− mice (31). We studied mice with persistently high blood glucose concentration, because other investigators have reported that such degree of prolonged hyperglycemia induces metabolic disorders (11–15). These observations indicate that RAGE plays an important role in diabetes-related complications.
RAGE activation has also been linked to the function of S100 families and ROCK1 activation. In microglia, Bianchi et al (32) reported that the calcium binding protein, S100B, interacts with RAGE to activate ROCK1. Activated RAGE increases ROCK1 activation resulting in deterioration of atherosclerosis in ApoE-null mice (33). In the current study, we found that FSP-1 stimulates ROCK1 activation in a dose- and time-dependent manner, and this response can be blocked by a neutralizing antibody against RAGE (Figures 4 and 5). This observation is consistent with report that FSP-1-induced inflammation is mediated via RAGE (26). Furthermore, we found that FSP-1 KO can suppress hyperglycemia-induced ROCK1 expression and activation (Figure 6). We conclude that ROCK1 is a downstream mediator of FSP-1.
ROCK1 mediates FSP-1-induced endothelial hyperpermeability and the invasion of inflammatory cells. ROCK1 also increases MLC2 phosphorylation by directly phosphorylating MLC2 or indirectly by inactivating its phosphatase, MYPT1 (34). These reactions lead to increased MLC2 phosphorylation, which can destabilize the actin cytoskeleton and increase peripheral actomyosin contraction (35). Increased EC contraction changes its barrier function, as uncovered in the FITC-dextran influx in FSP-1-treated ECs. Notably, inhibition of ROCK1 protected ECs from FSP-1-induced EC hyperpermeability.
The molecular mechanism resulting in FSP-1-induced EC leakage depends on decreased expression and modification of junction molecules. ECs express 2 types of junction complexes, tight junction and adheren junction, mediating cell-cell interactions (36). Tight junction molecules (Occludin and ZO-1) regulate monolayer permeability (37), whereas the adheren proteins, including VE-cadherin, participate in the establishment and maintenance of cell-cell adhesion and the organization of the actin cytoskeleton (37). We found that FSP1 can decrease the expression of these junction molecules through the activation of ROCK1. In addition, FSP-1 also induces expression of proinflammatory molecules, ICAM-1 and VCAM-1, in ECs. The increased levels of adhesion molecules promote leukocyte/neutrophil adhesion and slow down their rolling and tethering to the surface of the endothelium. These alterations in ECs induce transendothelial migration of inflammatory cells. Inhibiting ROCK1 can block FSP-1-induced EC dysfunction (Figure 4).
During AVG surgery, the vein was subjected to an increase in blood pressure and shear stress (38). Thus, we speculate that neointima formation could represent an adaptive response to these pressure changes or to the release of growth factors that promote SMC accumulation in AVGs (39–41). In diabetic condition, the process of neointima formation was accelerated, whereas KO FSP-1 suppresses diabetes-induced accumulation of SMCs and neointima formation.
We conclude that endothelial dysfunction, including responses that are induced by diabetes, is at least in part due to activation of a FSP-1/ROCK1 pathway. In this pathway, hyperglycemia increases FSP-1 expression in ECs; FSP-1 binds to RAGE and stimulates ROCK1 kinase activity to phosphorylate the downstream target, MLC2. Phosphorylated MLC2 stimulates contraction of the cytoskeleton, resulting in a decrease in junction molecules. These responses lead to dysfunction of the EC barrier. In this model of AVGs, KO of FSP-1 or ROCK1 can reverse the hyperglycemia-induced dysfunction of ECs and inhibit neointima formation. Our results, therefore, imply that blocking FSP-1/ROCK1 signaling could be a therapeutic target for suppressing neointima formation in AVGs.
Acknowledgments
This work was supported by National Institutes of Health Grant RO1 DK095867 and American Heart Association Grant 10SDG2780009 (to J.C.), National Institutes of Health Grants R37 and DK37175, and a generous grant from Dr and Mrs Harold Selzman.
Disclosure Summary: The authors have nothing to disclose.
Abbreviations
- AVG
arteriovenous graft
- EC
endothelial cell
- FSP-1
fibroblast-specific protein 1
- MLC2
myosin light chain 2
- RAGE
receptor for advanced glycation end product
- ROCK1
rho-associated, coiled-coil-containing protein kinase 1
- SMC
smooth muscle cell
- STZ
streptozotocin.
