


Thyroid hormone (TH) transporters facilitate cellular TH influx and efflux, which is paramount for normal physiology. The L-type amino acid transporters LAT1 and LAT2 are known to facilitate TH transport. However, the role of LAT3, LAT4, and LAT5 is still unclear. Therefore, the aim of this study was to further characterize TH transport by LAT1 and LAT2 and to explore possible TH transport by LAT3, LAT4, and LAT5. FLAG-LAT1–5 constructs were transiently expressed in COS1 cells. LAT1 and LAT2 were cotransfected with the CD98 heavy chain. Cellular transport was measured using 10 nM 125I-labeled T4, T3, rT3, 3,3′-T2, and 10 μM [125I]3′-iodotyrosine (MIT) as substrates. Intracellular metabolism of these substrates was determined in cells cotransfected with either of the LATs with type 1 or type 3 deiodinase. LAT1 facilitated cellular uptake of all substrates and LAT2 showed a net uptake of T3, 3,3′-T2, and MIT. Expression of LAT3 or LAT4 did not affect transport of T4 and T3 but resulted in the decreased cellular accumulation of 3,3′-T2 and MIT. LAT5 did not facilitate the transport of any substrate. Cotransfection with LAT3 or LAT4 strongly diminished the cellular accumulation of 3,3′-T2 and MIT by LAT1 and LAT2. These data were confirmed by metabolism studies. LAT1 and LAT2 show distinct preferences for the uptake of the different iodocompounds, whereas LAT3 and LAT4 specifically facilitate the 3,3′-T2 and MIT efflux. Together our findings suggest that different sets of transporters with specific influx or efflux capacities may cooperate to regulate the cellular thyroid state.
Thyroid hormone (TH) is the common name for the prohormone T4 and the active hormone T3, which are important for development and metabolism of virtually all tissues. T3 exerts its action by binding to nuclear TH receptors (TRs) which regulate the transcription of target genes (1, 2). The biological activity of TH is therefore dependent on the intracellular T3 concentration, which is importantly controlled by deiodinases and plasma membrane TH transporters. The deiodinases can either convert T4 to T3 (type 1 deiodinase [D1], type 2 deiodinase [D2]) or degrade T4 to rT3 (D1, type 3 deiodinase [D3]), rT3 to 3,3′-T2 (D1, D2) and T3 to 3,3′-T2 (D1, D3) (3).
It has been well established that TH transporters mediate the uptake and efflux of iodothyronines across the plasma membrane (4, 5). So far, only organic anion transporting polypeptide 1C1 (6), monocarboxylate transporter (MCT)-8 (7), and MCT10 (8) have been identified as relatively specific TH transporters. The importance of TH transporters has been demonstrated by the identification of mutations in MCT8, which result in a severe phenotype with psychomotor retardation and disturbed serum TH levels (9). Mct8 deficient mice display similar TH levels as patients but lack a neurological phenotype (10, 11). In this context, members of the L-type amino acid transporter (LAT) family have gained attention (12, 13).
System L transporters are mostly present on the basolateral membrane of various tissues and mediate sodium-independent exchange of neutral amino acids and are specifically inhibited by 2-aminobicyclo-(2,2,1)-heptane-2-carboxylic (BCH) acid (14). LAT1 and LAT2 are heterodimeric proteins (∼40 kDa) composed of a common heavy chain (CD98, SLC3A2) and different light chains (SLC7A5,8), whereas LAT3, LAT4 and LAT5 are monomeric proteins (∼50 kDa) from an entirely different family (SLC43A1,2,3). LAT1 and LAT2 have been suggested to prevent a neurological phenotype by compensating for the defect in TH transport in Mct8 deficient mice (12) because LAT1 is predominantly expressed in the murine blood-brain barrier and LAT2 mainly in neurons (15–17). Mct8/Lat2 double knockout (KO) mice do not show the transient increase in T3 levels and expression of T3 target genes in the cerebral cortex as observed in neonatal Mct8 KO mice (13). This led to the suggestion that the perinatal uptake of T3 in the cerebral cortex is facilitated by LAT2.
Evidence that LAT1 and LAT2 transport TH is scarce because most studies show indirect evidence of inhibited LAT-mediated uptake of amino acids by iodothyronines (15, 18–21). The first direct evidence of TH transport by LAT1 was presented by Ritchie et al (22). Also, our group showed direct uptake of T4 and T3 by human LAT1 in oocytes and described the uptake of iodothyronines by mouse LAT2 (18). The possibility that LATs may participate in the transport of TH in the brain may have important consequences for understanding the neurological phenotype of patients with MCT8 mutations. Therefore, we have studied the characteristics of iodothyronine transport by LAT1 and LAT2 in detail. Furthermore, we explored the possibility of iodothyronine transport by the recently identified LAT3, LAT4 and LAT5.
Materials and Methods
Constructs
Cloning vectors containing full-length cDNA inserts of human (h) LAT1, LAT2, LAT3, LAT4, and LAT5 were obtained from Thermo Fisher Scientific and subcloned into the expression vector pcDNA3 using oligonucleotides (Integrated DNA Technologies) carrying the sequence for the FLAG tag and suitable restriction sites for the individual inserts. All constructs were verified by sequencing (BaseClear). The cloning of hMCT8.pcDNA3 (7), CRYM.pSG5 (7), rD1.pcDNA3 (23), and hD3.pCIneo (23) constructs have been previously described. Mouse CD98 was amplified from kidney cDNA and cloned into the expression vector pcDNA3 (Invitrogen) using HindIII and XbaI cloning sites.
Cell culture and transfection
COS1 cells were cultured at 37°C and 5% CO2 in 75-cm2 flasks with DMEM/F12 (Life Technologies) supplemented with 9% heat-inactivated fetal bovine serum (Sigma-Aldrich), 1% penicillin-streptomycin, and 100 nM Na2SeO3. At confluence, cultured cells were split and seeded in 24-well dishes for the uptake and metabolism studies and in six-well dishes to prepare lysates for immunoblots. At 70% confluence, cells were transiently transfected using X-tremeGENE 9 transfection reagent (Roche Diagnostics) according to the manufacturer’s protocol.
For uptake studies, COS1 cells were transiently transfected in duplicate with 5–50 ng of FLAG-LAT1, LAT2, LAT3, LAT4, or LAT5.pcDNA3 or MCT8.pcDNA3 together with 50 ng of CD98.pcDNA3 in case of LAT1 or LAT2 and with or without CRYM.pSG5. In some experiments 50 ng of FLAG-LAT1 or LAT2.pcDNA3 plus 50 ng CD98.pcDNA3 were cotransfected with 5–50 ng FLAG-LAT3 or LAT4.pcDNA3. For metabolism experiments, cells were additionally transfected with 50 ng D1.pcDNA3 or D3.pCIneo. To study the influence of transfection of LAT3, LAT4, or LAT5 on the endogenous expression of LAT1, COS1 cells were transfected with 5–50 ng LAT3, LAT4, or LAT5.pcDNA3. Empty pcDNA3 vector (EV) was always added to bring the total amount of plasmid to 250 ng/well. For immunoblots, cells were transfected with 200 ng of each FLAG-LAT1, LAT2, LAT3, LAT4, or LAT5.pcDNA3, adjusted with EV to a total amount of 1000 ng plasmid.
Uptake experiments
Two days after the transfection, cells were washed with assay buffer (Dulbecco’s PBS (DPBS) + Ca2+/Mg2+ + 0.1% D-glucose) and incubated for 5–60 minutes at 37°C with 10 nM (50 000 cpm) [125I]T4, [125I]T3, [125I]rT3, [125I]3,3′-T2, or 10 μM (50 000 cpm) [125I]3′-iodotyrosine (MIT) or [3H]leucine (Leu) in 0.5 mL assay buffer with or without 0.1% BSA. All radioactive iodocompounds were prepared as previously described (24). Nonradioactive iodothyronines were obtained from Henning and MIT and Leu from Sigma-Aldrich. To evaluate the pH dependence of 3,3′-T2, rT3, and MIT uptake, the pH of the assay buffer was adjusted to 7.3, 6.3, or 5.3 with 1 M HCl or KOH. After incubation, the cells were washed with assay buffer and lysed with 0.1 M NaOH. Radioactivity in the lysate was measured in a γ-counter (125I) or a β-counter (3H).
Metabolism experiments
Two days after the transfection, cells were washed with assay buffer and subsequently incubated for 2 or 4 hours at 37°C with 1 nM (200 000 cpm) [125I]T4, [125I]T3, [125I]rT3, or [125I]3,3′-T2 in 250 μl assay buffer + 0.1% BSA. After incubation, 100 μL of incubation medium was added to 125 μL ice-cold ethanol (pH 2.3) and incubated for 30 minutes on ice. After centrifugation, 125 μL supernatant was mixed with 100 μL 0.1% TFA in water. Metabolites were separated by ultraperformance liquid chromatography as described previously for the HPLC method (23).
Immunoblotting
Two days after transfection, COS1 cells were rinsed with DPBS, lysed in 100 μL ice-cold lysis buffer (150 mM NaCl; 1% Triton X-100; 50 mM Tris/HCl, pH 8.0; 1 mM EDTA) and centrifuged for 5 minutes at 800 × g. Postnuclear supernatants (2.5–25 μg) were separated on 12% precise Tris-HEPES sodium dodecyl sulfate-gel (Fisher Scientific) and transferred to a nitrocellulose membrane (GE Healthcare). The membrane was blocked for 1 hour in DPBS/0.1% Tween 20/5% milk and incubated overnight at 4°C in DPBS/0.1% Tween 20/5% milk with 1:1000 mouse anti-FLAG M2 antibody (F1804; Sigma-Aldrich) or 1:10 000 mouse antihuman glyceraldehyde-3-phosphate dehydrogenase (GAPDH) antibody (MAB374; Chemicon International) (Table 2). The membranes were washed three times for 5 minutes with DPBS/0.1% Tween 20 and incubated for 1 hour at room temperature in DPBS/0.1% Tween 20 with 1:3000 goat antimouse IgG horseradish peroxidase conjugate (number 172–1011; Bio-Rad Life Science). Finally, the blots were washed three times for 5 minutes with DPBS/0.1% Tween 20 and incubated for 1 minute in enhanced chemiluminescent substrate for detection of horseradish peroxidase (Thermo Scientific) before scanning by the Alliance 4.0 using Uvitec software.
Antibody Table
| Peptide/Protein Target | Antigen Sequence (if Known) | Name of Antibody | Manufacturer, Catalog Number, and/or Name of Individual Providing the Antibody | Species Raised (Monoclonal or Polyclonal) | Dilution Used |
|---|---|---|---|---|---|
| FLAG | DYKDDDDK | Mouse anti-FLAG M2 antibody | Sigma-Aldrich, F1804 | Monoclonal | 1:1000 |
| GAPDH | Mouse antihuman GAPDH antibody | Chemicon International, MAB374 | Monoclonal | 1:10 000 |
Quantitative RT-PCR
Total RNA was isolated from COS-1 cells using the high pure RNA isolation kit (Roche Diagnostics). RNA (1 μg) was reverse transcribed using the Transcriptor high-fidelity cDNA synthesis kit (Roche Diagnostics). Quantitative real-time PCR was performed using the quantitative PCR Core kit for SYBR Green I No deoxyuridine 5-triphosphate (Eurogentec). Results were normalized using GAPDH as the housekeeping gene. The PCR primers used are listed in Supplemental Table 1.
Statistical analysis
All results are presented as the means ± SEM of two to six independent experiments performed in duplicate. Statistical analysis was carried out in GraphPad Prism version 5.01 for Windows (GraphPad Software). The statistical significance of differences in substrate uptake after transfection with LAT1, LAT2, LAT3, LAT4, or LAT5 vs EV or after cotransfection with LAT1 or LAT2 plus LAT3 or LAT4 vs LAT1 or LAT2 alone and of differences in endogenous LAT1 mRNA levels in cells transfected with LAT3, LAT4, or LAT5 vs EV was determined using the Student’s t test for unpaired observations.
For the plasmid titration experiments of 3,3′-T2 and MIT uptake and time courses of 3,3′-T2, rT3, and MIT uptake, we used a two-way ANOVA followed by a Bonferroni posttest to calculate significant differences between transfection with LAT1 or LAT2 alone vs cotransfection with LAT1 or LAT2 plus LAT3 or LAT4. Statistical significance in the metabolism and pH experiments was determined using a one-way ANOVA followed by a Bonferroni posttest. P < .05 was considered statistically significant.
Results
To study the transport characteristics of TH by LAT1, LAT2, LAT3, LAT4, and LAT5, we transiently transfected COS1 cells with these transporters and used MCT8 as a control. LAT1 and LAT2 were combined with the CD98 heavy chain. All constructs were designed with a FLAG tag to visualize expression of the proteins. First, we confirmed expression of the transporter proteins by immunoblot analysis using an antibody against the FLAG tag that is present in the different constructs. Cells cotransfected with CD98 and LAT1 or LAT2 showed bands of approximately 40 and approximately 45 kDa, respectively (Supplemental Figure 1). For cells transfected with FLAG-tagged LAT3, LAT4, or LAT5, we observed the most pronounced bands at approximately 50 kDa (Supplemental Figure 1). All bands were in agreement with the predicted molecular weights of the different LATs. Additional bands with a higher molecular mass in cells transfected with LAT3, LAT4, or LAT5 are likely explained by glycosylation (25). To confirm functional expression of transporters, we measured Leu uptake in cells transfected with LAT1, LAT2, LAT3, LAT4, or LAT5 (Figure 1A). As anticipated, in cells expressing LAT1 or LAT2, we observed increased Leu uptake, whereas in cells expressing LAT3 or LAT4, Leu uptake was decreased compared with control EV-transfected cells. Also, LAT5-expressing cells showed slightly diminished Leu accumulation. These results support the functional expression of LAT1–5 in our cell system (Figure 1A).
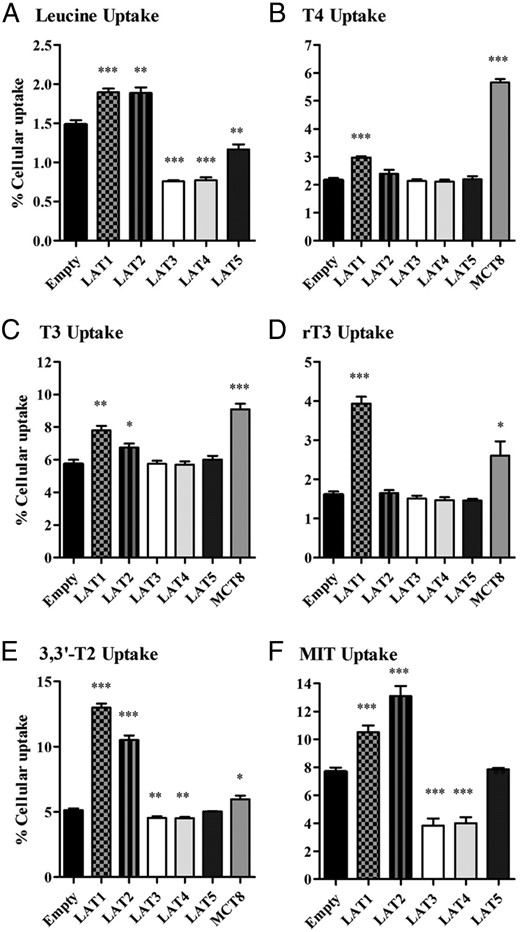
A–F, Cellular uptake of 10 nM T4, T3, rT3, 3,or 3′-T2 or 10 μM of MIT or Leu by COS1 cells transfected with EV, FLAG-tagged LAT1, LAT2, LAT3, LAT4, LAT5, or MCT8 after 30 minutes or 10 minutes (Leu) of incubation. Uptake is presented as a percentage of added substrate. Results are the means ± SEM of four to six experiments. Significance represents EV vs different transporters. *, P < .05; **, P < .01; ***, P < .001.
We next measured the uptake of T4, T3, rT3, 3,3′-T2, and MIT by COS1 cells transfected with LAT1, LAT2, LAT3, LAT4, or LAT5. Preliminary data showed that substrate uptake was linear with time for at least 30 minutes, and we chose this incubation time for our initial experiments. Cells transfected with LAT1 showed significantly higher uptake of all substrates than cells transfected with EV (Figure 1, B–F) Net uptake of rT3 and 3,3′-T2 was even higher for LAT1 than for MCT8. In cells transfected with LAT2, there was significant uptake of T3, 3,3′-T2, and MIT, and MIT uptake even exceeded that mediated by LAT1 (Figure 1, D and E). Interestingly, transfection with LAT3 or LAT4 induced a significant decrease in cellular 3,3′-T2 and MIT accumulation, similar to our findings with Leu, suggesting that LAT3 and LAT4 predominantly facilitate the efflux of these substrates (Figure 1, E and F). For LAT5, we could not detect any differences in uptake of the iodothyronines and MIT (Figure 1, B–F). These experiments were also performed in JEG3 cells, with similar results (data not shown).
An alternative explanation for the decreased uptake of 3,3′-T2 and MIT in cells transfected with LAT3 or LAT4 is a diminished expression of endogenous LAT1 or LAT2. Therefore, we explored how sensitive substrate uptake responds to a decrease in LAT1–4 expression. Uptake of 3,3′-T2 by LAT1 and LAT2 decreased by only approximately 15% when the amount of plasmid was reduced from 50 to 25 ng, and only by approximately 50% when the plasmid was further reduced to 5 ng (Figure 2A). MIT uptake by LAT1 was hardly affected when the amount of plasmid was reduced from 50 to 10 ng (Figure 2B). Cellular accumulation of MIT was similarly reduced after transfection of cells with 25 or 50 ng LAT3 or LAT4 plasmid. Even when only 5 ng of LAT3 or LAT4 plasmid was transfected, cellular MIT accumulation was still significantly decreased (Figure 2B). In view of these results and to maximize the effects on cellular iodothyronine and MIT accumulation without compromising endogenous transport, we used 50 ng of transporter plasmid in all further experiments.
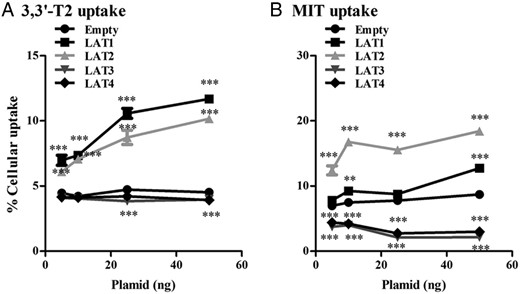
A and B, Cellular uptake of 10 nM 3,3′-T2 and 10 μM of MIT by COS1 cells transfected with 5–10–25 or 50 ng of FLAG-tagged LAT1, LAT2, LAT3, or LAT4 after 30 minutes of incubation. Uptake is presented as a percentage of added substrate. Significance represents EV vs different transporters. *, P < .05; **, P < .01; ***, P < .001.
The cellular accumulation of T4 induced by LAT1 and T3 by LAT1 and LAT2 was only modest, which could be explained if these transporters mediate not only influx but also efflux of TH. To test this, we compared uptake of T4 and T3 in cells cotransfected with CRYM, a high-affinity cytoplasmic TH-binding protein (8), or EV as control. Cotransfection with CRYM resulted in an expected increase in accumulation of T4 and T3 in cells expressing MCT8, which facilitates both uptake and efflux of TH (8) but not in cells expressing LAT1 or LAT2 (Figure 3). Cotransfection of CRYM with LAT3 or LAT4 did not result in any uptake of T4 or T3 (Figure 3). These results indicate that LAT1 and LAT2 facilitate influx but not efflux of T3 and T4 and further confirm that T4 and T3 are not substrates for LAT3 and LAT4.
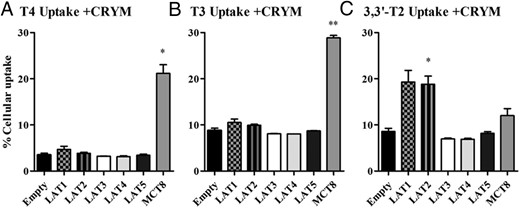
A–C, Cellular uptake of 10 nM T4, T3, and 3,3′-T2 by COS1 cells transfected with CRYM in combination with EV, FLAG-tagged LAT1, LAT2, LAT3, LAT4, LAT5, or MCT8 after 30 minutes of incubation. Uptake is presented as a percentage of added substrate. Results are the means ± SEM of two to three experiments. Significance represents EV vs different transporters. *, P < .05; **, P < .01; ***, P < .001.
To get further insight in the transport characteristics of LAT1, LAT2, LAT3, and LAT4, we studied the time course of 3,3′-T2, rT3, and MIT uptake. The uptake of 3,3′-T2 by LAT1 and LAT2 increased significantly over time until a steady state was almost reached after 30 minutes (Figure 4, A–D).
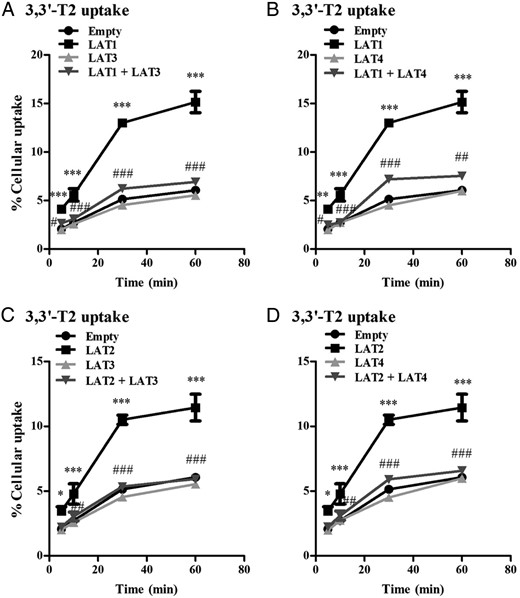
A and B, Cellular uptake of 10 nM 3,3′-T2 by COS1 cells transfected with EV, LAT1, LAT3, or LAT4 alone or cotransfected with LAT1 plus LAT3, or LAT4 after 5–60 minutes of incubation. C and D, Cellular uptake of 10 nM 3,3′-T2 by COS1 cells transfected with single EV, LAT2, LAT3, or LAT4 alone or cotransfection of LAT2 together with LAT3 or LAT4 after 5, 10, 30, and 60 minutes of incubation. Uptake is presented as a percentage of added substrate. Results are the means ± SEM of three experiments. Significance represents EV vs LAT1 or LAT2 (*) and single LAT1 or LAT2 alone vs LAT1 or LAT2 plus LAT3 or LAT4 (#). *, P < .05; **, P < .01; ***, P < .001.
To further investigate the efflux of 3,3′-T2 by LAT3 and LAT4, we analyzed transport of 3,3′-T2 by cells cotransfected with LAT1 or LAT2 together with LAT3 or LAT4. We observed a significant decrease in cellular 3,3′-T2 accumulation in the cotransfected cells compared with cells expressing LAT1 or LAT2 alone (Figure 4, A–D). This suggests that 3,3′-T2 taken up by LAT1 or LAT2 is exported by LAT3 or LAT4, when these transporters are coexpressed.
Transfection with LAT1, but not with LAT2, LAT3, or LAT4 (data not shown), induced a significant increase in rT3 uptake at all time points, beyond 5 minutes of incubation time (Figure 5, A and B). Cotransfection of LAT1 with LAT3 or LAT4 decreased rT3 uptake at all time points (Figure 5, A and B), indicating rT3 efflux by LAT3 and LAT4.

A and B, Cellular uptake of 10 nM rT3 by COS1 cells transfected with EV, LAT1, LAT3, or LAT4 alone or cotransfected with LAT1 plus LAT3 or LAT4 after 5–60 minutes of incubation. Results are the means ± SEM of three experiments. Significance represents EV vs LAT1 or LAT2 (*) and LAT1 or LAT2 alone vs LAT1 or LAT2 plus LAT3 or LAT4 (#). *, P < .05; **, P < .01; ***, P < .001.
MIT uptake peaked after 10 minutes in control cells transfected with EV, followed by a marked decline (Figure 6, A–D). At all time points, both LAT1 and LAT2 induced a marked increase, whereas LAT3 and LAT4 produced an even greater decrease in cellular MIT accumulation compared with cells transfected with EV (Figure 6, A–D). Cellular accumulation of MIT was equally decreased in cells transfected with LAT1 or LAT2 in combination with LAT3 or LAT4 as in cells transfected with LAT3 or LAT4 alone, supporting the hypothesis that MIT is actively exported by the latter transporters (Figure 6, A–D).
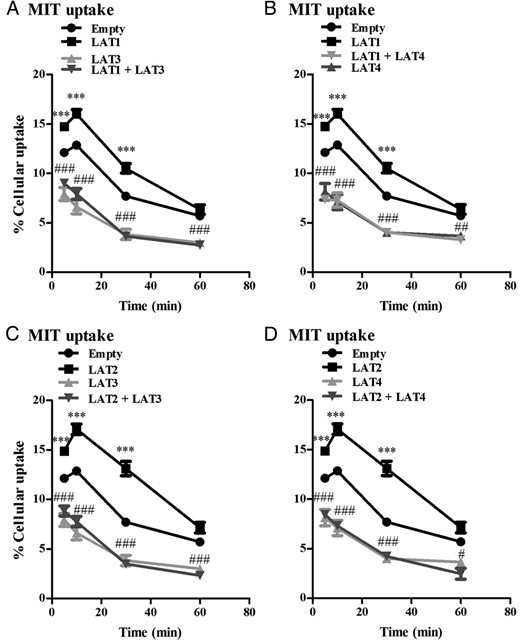
A and B, Cellular uptake of 10 μM MIT by COS1 cells transfected with single EV, LAT1, LAT3, or LAT4 alone or cotransfected with LAT1 plus LAT3 or LAT4 after 5–60 minutes of incubation. C and D, Cellular uptake of 10 μM MIT by COS1 cells transfected with EV, LAT2, LAT3, or LAT4 alone or cotransfected with LAT2 plus LAT3 or LAT4 after 5–60 minutes of incubation. Uptake is presented as a percentage of added substrate. Results are the means ± SEM of three experiments. Significance represents EV vs LAT1 or LAT2 (*) and LAT1 or LAT2 alone vs LAT1 or LAT2 plus LAT3 or LAT4 (#). *, P < .05; **, P < .01; ***, P < .001.
Transport of iodothyronines by LAT1, LAT2, LAT3, and LAT4 will change their intracellular levels and consequently their metabolism by deiodinating enzymes. To study this, we cotransfected cells with LAT1–4, or MCT8 as a positive control, together with D1 or D3 and analyzed metabolism of T4, T3, rT3, and 3,3′-T2. We measured metabolites in the medium that contains greater than 80% of added radioactivity and reflects total cellular iodothyronine metabolism (23). LAT1 and LAT2 induced insignificant increases in the metabolism of T4, T3, and 3,3′-T2 by D3 (Figure 7, A–C). LAT3 and LAT4 had little, insignificant effect on the metabolism of T4 and T3 by D3 but induced an almost 25%, albeit insignificant decrease in 3,3′-T2 metabolism by D3. This suggests that LAT3 and LAT4 export 3,3′-T2 before this substrate can be metabolized by D3. Again, we cotransfected LAT1 or LAT2 with LAT3 or LAT4 to test their effects on the intracellular availability of 3,3′-T2 for metabolism by D3. As anticipated, the metabolism of rT3 by D1 was increased in cells expressing only LAT1, but not LAT2 (Figure 7, D and E). Both LAT3 and LAT4 expression decreased 3,3′-T2 metabolism (Figure 7D) and modestly decreased rT3 metabolism by D1 (Figure 7E), which was abolished by cotransfection with LAT1 or LAT2 (Figure 7, D and E).
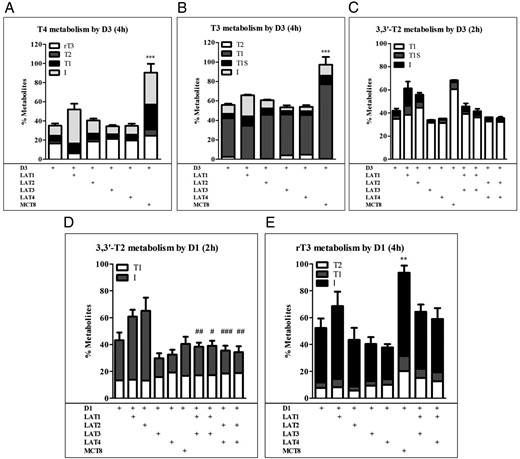
A–C, Metabolism of 1 nM T4, T3, and 3,3′-T2 during 2–4 hours of incubation with COS1 cells cotransfected with D3 plus EV, LAT1, LAT2, LAT3, LAT4, or MCT8 or with D3 plus LAT1 or LAT2 plus LAT3 or LAT4. D and E, Metabolism of 1 nM 3,3′-T2 and rT3 after 2–4 hours of incubation with COS1 cells cotransfected with D1 plus EV, LAT1, LAT2, LAT3, LAT4, or MCT8 or with D1 plus LAT1 or LAT2 plus LAT3 or LAT4. Metabolism is shown as percentage metabolites in the incubation medium. Metabolites are expressed as percentage of total radioactivity in the medium. Results are the means ± SEM of three experiments. Significance represents D1 or D3 alone vs D1 or D3 plus transporter (*) or D1 or D3 plus LAT1 or LAT2 vs D1 or D3 plus LAT1 or LAT2 plus LAT3 or LAT4 (#). *, P < .05; **, P < .01; ***, P < .001.
As mentioned above, the decrease in cellular accumulation of MIT, 3,3′-T2, or rT3 by LAT1 or LAT2 after cotransfection with LAT3 or LAT4 may be explained by the direct efflux of these iodocompounds by LAT3 or LAT4 and/or by a decreased expression of LAT1 or LAT2 protein. Therefore, we cotransfected cells with LAT1 or LAT2 and increasing amounts of LAT3 or LAT4. Then we analyzed 3,3′-T2 and MIT uptake in parallel with LAT1 and LAT2 protein expression by immunoblotting. Cellular accumulation of 3,3′-T2 and MIT was already significantly decreased when 50 ng of LAT1 or LAT2 was cotransfected with as low as 5 ng LAT3 or LAT4, which did not affect LAT1 and LAT2 protein expression (Supplemental Figures 2, A–D, and 3, A and B). This indicates that the decreased accumulation of MIT and 3,3′-T2 and decreased the metabolism of 3,3′-T2 in cells (co-)transfected with LAT3 or LAT4 are due, at least in part, to direct export of these compounds by LAT3 and LAT4. This may also hold to some extent for rT3, although we did not detect decreased rT3 uptake by cells transfected with LAT3 or LAT4 alone (Figure 1C). As a final approach, we measured endogenous levels of LAT1 and LAT2 in COS1 cells after transfection with increasing concentrations of LAT3, LAT4, and LAT5. First, COS1 expressed only LAT1 and not LAT2 (data not shown). Next, we measured LAT1 levels after cotransfection with 5, 10, 25, or 50 ng of LAT3 and LAT4 and showed that 5–50 ng of LAT3 or LAT4 did not decrease LAT1 mRNA levels (Supplemental Figure 2, E and F).
The uptake of amino acids by LAT2 depends on the pH of the incubation medium, but this has not been tested for LAT1 (11). Therefore, we first studied the effects of pH on the uptake of the preferred iodocompounds by LAT1 or LAT2. Adjusting the pH from 7.3 to 5.3 significantly increased the uptake of rT3 by LAT1 (Figure 8A), whereas uptake of rT3 by LAT2 was very low at all pH values tested (Figure 8B). Uptake of 3,3′-T2 by LAT1 and LAT2 was optimal at pH 6.3, although not significantly different from pH 5.3 or 7.3 (Figure 8, C and D). Uptake of MIT by LAT1 was significantly higher at pH 5.3 than at pH 7.3 (Figure 8E), whereas uptake of MIT by LAT2 was already significantly increased at pH 6.3 (Figure 8F). To exclude the possibility that the increased substrate uptake at lower pH was caused by a decreased substrate binding to BSA, the experiments were also performed in the absence of BSA, yielding very similar results for all substrates (data not shown). Finally, we studied the pH dependence of T4 and T3 by LAT1 or LAT2. The uptake of T4 and T3 by LAT1 increased when the pH was adjusted from 7.3 to 5.3. The modest transport of T3 by LAT2 was not pH dependent (data not shown).
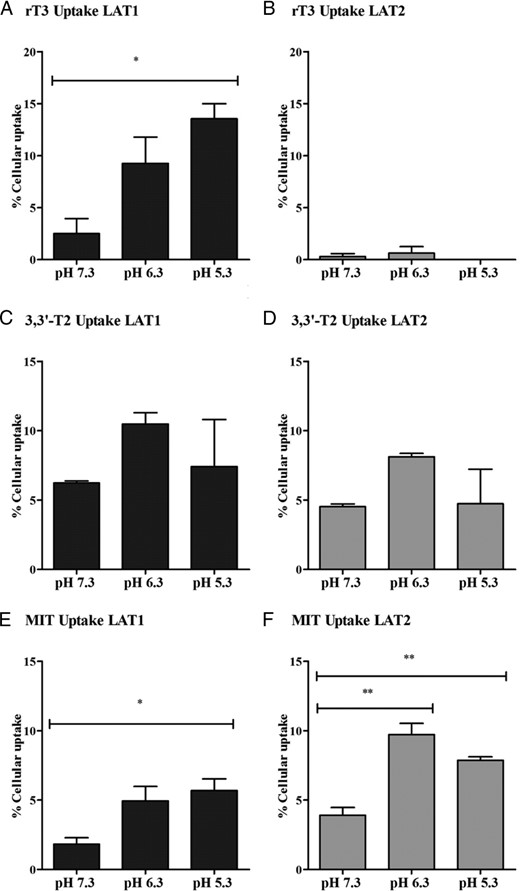
A–E, Effects of pH 5.3–7.3 on the uptake of 1 nM rT3, 3,3′-T2, or MIT by COS1 cells transfected with LAT1 or LAT2 after 30 minutes of incubation. Uptake is presented as a percentage of added substrate. Results are the means ± SEM of three experiments. Significance represents pH 5.3 or 6.3 vs pH 7.3. *, P < .05; **, P < .01; ***, P < .001.
Discussion
In this study, we characterized iodothyronine transport by LAT1 and LAT2. Furthermore, we explored the possibility of iodothyronine transport by the recently identified LAT3, LAT4, and LAT5. LAT1 and LAT2 are highly homologous heterodimeric proteins consisting of the nonglycosylated 12 transmembrane domains containing light chains SLC7A5 and SLC7A8, respectively, and a common glycosylated 4F2 heavy chain (CD98/SLC3A2) containing a single-transmembrane domain. Compared with LAT1, which preferably transports large, neutral, amino acids with branched or aromatic side chains, LAT2 has a remarkably broad substrate specificity. Also, LAT2-mediated transport is increased at lower pH values. LAT1 is mainly expressed in brain, spleen, colon, and placenta, whereas LAT2 is widely expressed mostly at basolateral membranes of various tissues, like the kidney and intestine, but also in the brain, placenta, and liver (26–30).
LAT3 (SLC43A1), LAT4 (SLC43A2), and LAT5 (SLC43A3) are transporters with a predicted membrane topology of 12 transmembrane domains with a conserved N-glycosylation site. The transport activity of LAT3 and LAT4 corresponds to that of amino acid transport system L. These transporters facilitate efflux of branched chained, neutral amino acids in a sodium-independent manner at the basolateral side into the blood and are inhibited by 2-aminobicyclo-(2,2,1)-heptane-2-carboxylic (BCH) acid. LAT5 is an orphan transporter. LAT3 is mainly expressed in liver, pancreas, skeletal muscle, and also in placenta and podocytes. LAT4 is expressed in placenta, kidney, liver, and small intestine (25, 31–35). Table 1 presents an overview of the tissue distribution of LAT1, LAT2, LAT3, LAT4, and LAT5 (26, 28, 29, 31–33, 35–39).
Tissue Distribution of LAT Transporters
| Brain | Spleen | Intestine | Placenta | Liver | Kidney | Pancreas | Skeletal Muscle | Heart | Testis | References | |
|---|---|---|---|---|---|---|---|---|---|---|---|
| LAT1 | Human, rat | Human, rat | Rat | Human, rat | Human, rat | Human, rat | 26, 29, 36–39 | ||||
| LAT2 | Human, rat | Human | Human, rat | Human, rat | Human, rat | Human, rat | Human, rat | Human | Rat | 28, 29, 36 | |
| LAT3 | Human | Human | Human | Human | Human | Human | 31, 35 | ||||
| LAT4 | Mouse | Human, mouse | Mouse | Mouse | Mouse | 32 | |||||
| LAT5 | Human | Human | Human | Human | 33 |
Several features distinguish LAT1 and LAT2 from LAT3 and LAT4 including the following: 1) LAT3 and LAT4 do not need to bind to a heavy chain to traffic to the plasma membrane; 2) LAT1 and LAT2 are exchangers, whereas LAT3 and LAT4 are known to efflux substrates; and 3) LAT3 and LAT4 exhibit narrow substrate selectivity and show highly complex two-component kinetics (25).
In our studies, LAT1 facilitated the intracellular accumulation of T4 and T3 (Figure 1), and this transporter can therefore be important for normal uptake of TH in various tissues. LAT1 is highly expressed in the syncytiotrophoblast, mainly at the maternal, apical side, and also less pronounced at the fetal, basolateral side (26, 40). This suggests that LAT1 could also regulate TH transport from mother to child. It is noteworthy that LAT1 transports the receptor inactive metabolites rT3, 3,3′-T2, and MIT, whereas it is not expressed in the liver, kidney, or thyroid, where these compounds are mainly metabolized by D1 and DEHAL1 (41–43). However, iodothyronines may also exert nongenomic biological effects (41, 44–46). It has been shown that T4 and rT3 regulate actin polymerization and D2 activity in the developing brain via nontranscriptional ways (44). Also, 3,3′-T2 can influence mitochondrial energy metabolism (46, 47). rT3 levels in the human fetus are relatively high due to high placental and fetal tissue D3 activities (48). Notably, Lat1 KO mice are embryonic lethal (39). The expression of LAT1 in the syncytiotrophoblast may therefore indicate a role for LAT1 in transport of iodothyronines from the fetus back to the mother. However, because LAT1 is predominantly expressed at the maternal side of the syncytiotrophoblast (40), the exact role of LAT1 in placental TH transport, if any, remains to be elucidated.
In neonatal Mct8 KO mice, local hyperthyroidism and expression of TH target genes in the cerebral cortex are prevented by additional deletion of Lat2 (13). It has been suggested that LAT2 facilitates T3 transport in neurons in the prenatal and perinatal period. Our data indicate that LAT2 is a poor T4 and T3 transporter (Figure 1). These observations may be reconciled if mouse and human LAT2 differ in substrate preference. Alternatively, if LAT2 expression is sufficiently high, it may still contribute to neuronal T3 uptake despite its low intrinsic T3 transport capacity. Given the net accumulation of T4 and T3 by LAT1 and its expression in the mouse brain, LAT1 could be a compensatory TH transporter in Mct8-deficient mice (15).
In our studies, we found significant uptake of 3,3′-T2 and MIT by LAT2 (Figure 1, D and E). The accumulation of MIT by LAT2 is even more pronounced compared with LAT1. LAT2 is expressed in almost all tissues (28), including the thyroid gland (49). LAT2 may have a role in the transport of 3,3′-T2 and MIT in the liver and thyroid, in which these substrates are metabolized and the iodide produced is reutilized for the production of TH.
Our findings indicate that LAT1 facilitates cellular accumulation of all tested substrates and LAT2 showed a net uptake of T3, 3,3′-T2, and MIT. This size selectivity for the iodothyronines is consistent with known preferences of LAT1 for larger amino acids and LAT2 for smaller amino acids (26–30).
The uptake of MIT in control cells, showed a marked decline over time, which could be explained by extensive intracellular metabolism of MIT. However, ultraperformance liquid chromatography analysis indicated that MIT was completely stable during these incubations (data not shown). It is more likely that MIT uptake by COS1 cells is driven by the exchange with intracellular amino acids because LAT1 and LAT2 are obligatory exchangers (26–30). Cells were cultured in amino acid-replete medium, but during the uptake assay, the cells were incubated in amino acid-deplete PBS, which probably results in a decline in intracellular amino acids and thus a decrease in cellular MIT uptake with time of incubation. The physiological role of the possible exchange of TH and amino acids needs to be elucidated.
LAT3 and LAT4 are known system L transporters (25). Similar to LAT1 and LAT2, both LAT3 and LAT4 are expressed in the placenta, and they are both expected to mediate efflux of amino acids from the syncytiotrophoblast to the fetus (35). It has also been suggested that the observed up-regulation of LAT3 in liver and skeletal muscle during starvation benefits the transport of amino acids from the liver and muscle to energy depleted organs such as the brain (50). A zebrafish morphant lacking Lat3 function showed collapsed glomeruli and disruption of glomerular permeability, suggesting that LAT3 may play a crucial role in the development and maintenance of podocyte structure and function (51). Recently the group of Guetg et al (52) showed that LAT4 facilitates the uptake and efflux amino acids and that LAT4 is important in nutrition during early development. In Lat4 KO mice, they observed intrauterine and postnatal growth retardation, low amniotic amino acid concentrations, and premature death after 9 days. In our studies we showed efflux of 3,3′-T2 and MIT by LAT3 and LAT4 (Figure 1). We confirmed these data by using metabolism assays (Figure 7) and were also able to observe a decrease in net accumulation of 3,3′-T2 and MIT by cotransfecting LAT1 or LAT2 together with LAT3 or LAT4 (Figures 4 and 6).
The decreased intracellular accumulation of 3,3′-T2 and MIT in the presence of LAT3 or LAT4 was not caused by lower levels of endogenous LAT levels because transfection with 5–50 ng of LAT3 or LAT4 did not alter LAT1 mRNA levels (Supplemental Figure 2, E and F), and 5 ng of plasmid already resulted in decreased accumulation of 3,3′-T2 and MIT (Figure 2). Furthermore, in cotransfection studies, we showed that the accumulation of 3,3′-T2 and MIT by LAT1 and LAT2 could be abolished in the presence of LAT3 and LAT4. We used different approaches to show that this effect was not caused by lower endogenous or exogenous LAT1 or LAT2 expression. First, 5 ng of LAT3 or LAT4 already significantly decreased the intracellular accumulation of 3,3′-T2 and MIT by LAT1 and LAT2, without affecting protein levels (Supplemental Figures 2 and 3). Second, we showed that the 50 ng of LAT3 or LAT4 did not affect LAT1 mRNA levels (Supplemental Figure 2, E and F). Third, the plasmid titration curve showed that the uptake of 3,3′-T2 and MIT decreased by only half when 10-fold lower concentrations of plasmid were used (Figure 2). Altogether these data strongly suggest that LAT3 and LAT4 directly contribute to the efflux of 3,3′-T2 and MIT. The physiological role of iodothyronine export by LAT3 and LAT4 in vivo remains to be elucidated, for example by measuring TH levels in the Lat3 KO zebrafish model and the lat4 knockout mice (51, 52).
Uptake of the different substrates by LAT1 and LAT2 is dependent on the pH in the incubation medium because we found a significant increase in uptake by decreasing the pH from 7.3 to 6.3 or 5.3 (Figure 8). Although in the range studied, pH may affect the charge at the phenolic hydroxyl group of T4 and rT3, the increased MIT uptake by LAT1 and LAT2 at lower pH agrees with previous data showing higher uptake of substrates by LAT2 at lower pH. The physiological role of increased transport by LAT1 and LAT2 at lower pH remains to be elucidated.
In conclusion, our data highlight novel functions for LAT1, LAT2, LAT3, and LAT4 in the transport of iodothyronines. LAT1 and LAT2 facilitate mainly uptake of TH, whereas LAT3 and LAT4 can be regarded as T2 and MIT exporters. Further studies are necessary to explore the physiological role of these transporters in vivo.
Acknowledgments
W.E.V. is supported by an Erasmus University Fellowship. E.C.L.d.S. is supported by a grant from the Sherman Group, Sydney, Australia.
Disclosure Summary: The authors have nothing to disclose.
Abbreviations
- D1
type 1 deiodinase
- D2
type 2 deiodinase
- D3
type 3 deiodinase
- DPBS
Dulbecco’s PBS
- EV
empty pcDNA3 vector
- GAPDH
glyceraldehyde-3-phosphate dehydrogenase
- h
human
- KO
knockout
- LAT
L-type amino acid transporter
- Leu
[3H]leucine
- MCT
monocarboxylate transporter
- MIT
[125I]3′-iodotyrosine
- TH
thyroid hormone
- TR
TH receptor.
