


In the stomach, somatostatin (SST) acts as a general paracrine negative regulator of exocrine secretion of gastric acid and pepsinogen and endocrine secretion of gastrin, ghrelin, and histamine. Using reporter mice expressing red fluorescent protein (RFP) under control of the SST promotor, we have characterized the G protein-coupled receptors expressed in gastric Sst-RFP-positive cells and probed their effects on SST secretion in primary cell cultures. Surprisingly, besides SST, amylin and PYY were also highly enriched in the SST cells. Several receptors found to regulate SST secretion were highly expressed and/or enriched. 1) The metabolite receptors calcium-sensing receptor and free fatty acid receptor 4 (GPR120) functioned as positive and negative regulators, respectively. 2) Among the neurotransmitter receptors, adrenergic receptors α1a, α2a, α2b, and β1 were all highly expressed, with norepinephrine and isoproterenol acting as positive regulators. The muscarinic receptor M3 acted as a positive regulator, whereas M4 was conceivably a negative regulator. 3) Of the hormone receptors, the GLP-1 and GIP receptors, CCKb (stimulated by both CCK and gastrin) and surprisingly the melanocortin MC1 receptor were all positive regulators. 4) The neuropeptide receptors for calcitonin gene-related peptide, adrenomedullin, and vasoactive intestinal peptide acted as positive regulators, no effect was observed using galanin and nociceptin although transcripts for the corresponding receptors appeared highly expressed. 5) The SST receptors 1 and 2 functioned in an autocrine negative feedback loop. Thus, the article provides a comprehensive map of receptors through which SST secretion is regulated by hormones, neurotransmitters, neuropeptides and metabolites that act directly on the SST cells in the gastric mucosa.
Somatostatin (SST) was isolated in 1973 from hypothalamic extracts based on its ability to inhibit GH (“somatotropin”) secretion (1). Shortly thereafter, it was, as expected, shown to reduce the high levels of GH in plasma of diabetic patients during exercise (2). Importantly, SST was found to be able to inhibit the secretion of not only GH but also insulin, as measured during an oral glucose tolerance test in healthy subjects (3). Inspired by this observation, a series of studies in the mid-1970s demonstrated that SST was broadly expressed outside the hypothalamus in endocrine cells of the pancreatic islets, the gastrointestinal (GI) tract and the enteric nervous system, and SST was found to function as a general inhibitor of multiple endocrine and other secretory processes.
In the pancreatic islets, SST is expressed in a subset of the endocrine cells called the δ cells, where it functions as an important local regulator of both insulin and glucagon secretion (4). In the GI tract, SST expressing (D) cells are found in the epithelium throughout the GI tract but are particularly common in the stomach (5, 6). Here, SST was at an early stage shown to inhibit gastric acid secretion from the parietal cells (7), histamine secretion from the enterochromaffin-like (ECL) cells (8), pepsinogen secretion from the chief cells as well as gastrin secretion from the G cells (9); it was later also shown to inhibit ghrelin secretion (10) (Figure 1). Although changes in plasma concentrations of SST can be measured, the peptide appears to function mainly in a paracrine fashion to regulate the secretion from neighboring cells both in the pancreatic islets and in the GI tract (11–13). In fact, gastric SST cells were the first enteroendocrine cells for which long basal, neurite-like processes were identified (14). Already in 1979, it was suggested that these processes may be the morphological manifestation of targeted local paracrine control of specific neighboring cells (Figure 1) (14, 15). It was already then demonstrated that such long basal processes are also present on several other types of enteroendocrine cells (14). This phenomenon has recently been rediscovered, now focusing on the possibility that these processes may serve sensory functions (16); this could also apply to SST cells.
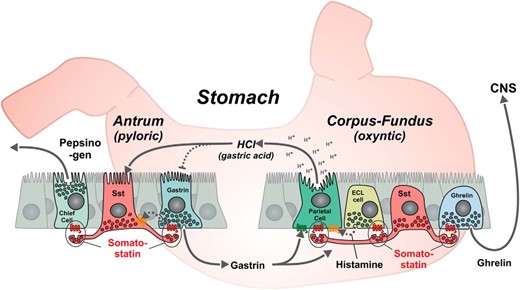
SST as a general paracrine inhibitor of exocrine and endocrine secretion in the gastric mucosa. In the oxyntic glands of the stomach the SST, cells are of the so-called “closed type,” which do not reach and sense the gastric lumen directly, whereas in the pyloric glands, the microvilli decorated apical process of the SST cells reach the gastric lumen similar to the gastrin cells. As shown, the SST cells have long basal processes through which they target their paracrine secretion of SST to specific neighboring cells (14), like inhibitions of ghrelin release. SST inhibits luminal gastric acid secretion from the parietal cells and it inhibits baso-lateral secretion of histamine from the ECL cells, which locally stimulates the acid secretion from the parietal cells. The paracrine secretion of SST inhibits the baso-lateral secretion of gastrin and pepsinogen secretion from the chief cells. As indicated, gastrin will stimulate the acid secretion from the parietal cells and has a trophic effect on the ECL cells, whereas luminal gastric acid as part of a feedback inhibitory mechanism will stimulate the secretion of SST and inhibit the secretion of gastrin, conceivably through stimulation of SST.
The regulation and function of gastric SST cells has been studied for almost half a century, and a vast amount of knowledge has been gathered. Several signaling molecules, including neurotransmitters (17–22), peptide hormones (23–27), neuropeptides (28–32), and metabolites have been shown to regulate gastric SST release (33). All of these ligands are sensed by specific G protein-coupled receptors (GPCRs) (34, 35). However, in most cases, it is not known whether the different agents act directly on the SST cells or indirectly through other endocrine or neuronal pathways. Thus, within the stomach, multiple interrelated regulatory pathways appear to function in various feedback mechanisms (Figure 1). Immunohistochemistry has been used in some cases to try to locate receptors on SST cells, but generation of specific antibodies for GPCRs is difficult and seldom leads to truly specific antibodies (36, 37).
In the present study, we took advantage of a reporter mouse expressing red fluorescent protein (RFP) under the control of the promoter for the Sst gene to identify and purify gastric SST cells to perform an unbiased characterization of the expression profile of the entire GPCR receptor and secretory peptide repertoire of these cells. Based on this, we subsequently revisited a number of the regulatory mechanisms thought to pertain to the SST cells, in order to perform functional analysis of these receptors regarding control of SST secretion in primary cell cultures from the stomach. Among the interesting observations was that in addition to expressing SST, SST cells also express peptide YY (PYY), amylin and pancreatic polypeptide. Furthermore, it was found that SST functions in an autocrine negative feedback loop to control its own secretion.
Materials and Methods
Transgenic mice
The Sst-RFP reporter mice were obtained by crossing the Cre driver mice Ssttm2.1(cre)Zjh/J (stock number 013044; The Jackson Laboratory) (38) with the RFP reporter mice B6.Cg-Gt(ROSA)26Sortm14(CAG-tdTomato)Hze/J (stock number 007914; The Jackson Laboratory) (39). The Ssttm2.1(cre)Zjh/J mice driving the Cre expression was constructed using an internal ribosome entry site and Cre recombinase in the 3′-UTR of the SST locus (38), it has not previously been characterized for expression in the stomach, which we did using multiple sections of stomachs from 3 mice; likewise, we characterized the expression in pancreas of the same mice.
Ffar4 knockout (KO) mice (40) were kindly provided by Merck and the Gpr81 KO (41) mice were kindly provided by Professor Dr Stefan Offermanns.
Only male mice were used in this study and animal procedures were approved by the Danish animal experiments inspectorate.
Immunohistochemistry
Mice were euthanized by cervical dislocation, and their stomachs were excised, rinsed with cold PBS, and transferred to 4% paraformaldehyde for overnight fixation at 4°C. Subsequently, the tissue was transferred to 20% sucrose at 4°C and left overnight. The fixed stomach was then cut open and embedded in Tissue-Tek OCT compound (Sakura Finetek), snap frozen in isopentane, and sectioned at a 8- to 10-μm thickness using a cryostat (CM3050S; Leica) onto SuperFrost plus slides (Thermo Scientific) and air dried for 1 hour in the dark.
Paraffin-embedded normal human gastric tissue sections (from untraceable historical archives originally collected during surgery) were also studied. The paraffin sections were deparaffinized, rehydrated, and antigen retrieved by boiling in 0.01 mol/L citrate buffer (pH 6.0) for 15 minutes.
Tissue sections were rinsed with PBS and incubated with blocking buffer (2% BSA, 0.1% Triton X-100 in PBS) at room temperature. The primary antibodies (anti-SST, 1:1600, sc-7819 [Santa Cruz Biotechnology, Inc]; anti-PYY, 1:6000, 7260–5104 [Steen Seier Poulsen]; and antiamylin, 1:100, ab53952 [Abcam]) were diluted in blocking buffer, applied and left to incubate overnight at 4°C. Sections were washed in PBS, and fluorophore-conjugated secondary antibodies (donkey antirabbit IgG Alexa Fluor 488, A-21206, and donkey antigoat IgG Alexa Fluor 568, A-11055; Life Technologies) diluted 1:200 in blocking buffer were added and incubated for 1 hour at room temperature. Lastly, the sections were washed with PBS and mounted with Prolong Gold Antifade Reagent with DAPI (P-36931; Invitrogen). Sections were analyzed using the IX70 Olympus microscope and XM10 Olympus camera. Pseudocolor application and picture merging were carried out using Adobe Photoshop.
In situ hybridization
Mice were euthanized by cervical dislocation and their stomachs were excised, rinsed with cold PBS, and transferred to 4% paraformaldehyde for 24-hour fixation at room temperature and subsequently stored in 70% alcohol before infiltration (Shandon Excelsior; Thermo Fisher) and embedding in paraffin blocks; 5-μm sections were cut using a microtome (RM2125; Leica) and mounted onto Superfrost Plus Slides (Thermo Scientific) at 60°C for 1 hour.
The distribution of SST receptor (Sstr)1 and Sstr2 in the gastric ventricle was investigated in 3 mice using the RNAscope 2.0 HD Detection kit (Red) assay (catalog number 320487; Advanced Cell Diagnostics) with probes for Sstr1 and Sstr2 (Advanced Cell Diagnostics). Sections were dewaxed in a series of xylene and ethanol and allowed to dry before incubation with “pretreatment 1” for 10 minutes at room temperature, boiled in “pretreatment 2” for 14 minutes, and protease digested in “pretreatment 3” at 40°C for 30 minutes. Slides were then treated according to the RNAscope 2.0 HD Detection kit (Red) assay user manual. Sections were counterstained with Gill’s hematoxylin (Sigma-Aldrich) and mounted with Ecomount (Biocare Medical). Positive and negative controls are visualized below.
Cell isolation and FACS purification
The Sst-RFP mice were sacrificed by cervical dislocation and single cell suspension was obtained followed by FACS purification using the MoFlo Astrios (Beckman Coulter) as previously described (42), with the next additional step: cells were incubated in 0.05% trypsin-EDTA (Gibco) at 37°C for 3 minutes and passed through a 25-gauge needle until a single cell suspension was obtained, visually inspected in the microscope (IX70 Olympus). The fraction of Sst-RFP-positive cells in 5 different preparations varied as follows: 0.33%, 0.32%, 0.65%, 0.53%, and 0.54% providing 5 preparations with 5000–15 000 of FACS-purified Sst-RFP+ cells (with corresponding Sst-RFP− cells), each preparation originated from a pool of 2 stomachs.
RNA extraction and quantitative PCR (qPCR)
Primary gastric mucosal cell cultures
After cervical dislocation, the stomach was tied off at the esophagus and duodenum, excised, turned inside out through an incision in the nonglandular forestomach, rinsed with PBS, filled with DMEM-F12, and placed in a 50-mL tube containing 10-mL DMEM-F12 with 1-mg/mL collagenase (type XI; Sigma-Aldrich) and 0.15% BSA (Sigma-Aldrich). The tube was incubated in a 37°C water bath shaking at 155 RPM for 40 minutes, after which the tube was shaken vigorously for 5 minutes. One milliliter of fetal bovine serum (FBS) (Gibco) was added. The stomach was removed, and the released cell clumps were allowed to sediment for 10–15 minutes. The pellet was dissolved in DMEM-F12 containing 10% FBS and 0.5mM dithiothreitol (Invitrogen). The supernatant was centrifuged for 3 minutes at 0.2g, and the pellet was mixed with the rest of the cell clumps, whereafter the cell suspension was passed through a 500-μm nylon mesh. The cell clumps were allowed to sediment for 15 minutes, after which the pellet was resuspended in DMEM-F12 containing 10% FBS, 0.15% fatty acid free BSA, 0.01-mg/mL penicillin/streptomycin, and 2mM glutamine. The cell suspension was plated (300 μL/well) in 48-well Matrigel-coated plates (100-μL Matrigel (BD Biosciences) diluted 1:20 in DMEM-F12 and aspirated after at least 1 hour, filled with 200-μL/well DMEM-F12 containing 10% FBS, 0.15% fatty acid free BSA, 0.01-mg/mL penicillin/streptomycin, and 2mM glutamine. Cells from 1 mouse were seeded in 24 wells. The plate was left for 10 minutes and then kept overnight in humidified 90% air 10% CO2 at 37°C.
Hormone secretion studies
The day after the preparation of primary gastric mucosal cells, media was aspirated from the wells, and ligands were added in duplicates or triplicates in 250-μL 37°C DMEM (low glucose) with 0.5% FBS and 0.15% fatty acid free BSA. Cells were incubated with ligands for 4 hours, after which 200-μL supernatant was centrifuged for 3 minutes at 1500 RCF and 4°C. The supernatant was kept at −80°C until hormone measurements. SST was measured using RIA as described in Ref. 43. Secretory response of SST cells to administered ligands was expressed as percentage of secreted SST from cells exposed to medium alone.
Calcium imaging in Sst-RFP-positive cells
Gastric glands from Sst-RFP mice were prepared as described above, plated in glass bottom chambers (Lab-Tek) in growth medium as previously described (44). Ca2+ imaging experiments were performed after 1 day of culture. Cells were loaded with 4μM fluo-4 AM, 2.5mM probenicid and PowerLoad (all from Invitrogen) in growth medium for 1 hour at 37°C (45). Cells were then washed and incubated for 30 minutes in basal medium consisting of DMEM-F12 (no phenol red), 0.5% FBS, 0.1% BSA, and 10mM HEPES. Live cell imaging was performed using an inverted confocal microscope LSM 780 (Zeiss) with a ×40 water-immersion objective in an incubation chamber at 37°C. Sst-RFP cells were first located using a HeNe laser at 543 nm, after which a z-stack of the cell was taken to determine cell’s boundaries. Fluo-4 intensity was measured in the optical slice (4–10 μm) using an argon laser 488 nm, controlled by ZEN software. Fluo-4 intensity was recorded during 5 minutes (last minute is shown in Figure 5) to establish baseline. Then, gastrin (200μM) or calcitonin gene-related peptide (CGRP) (20μM) was added to reach final concentration of 100nM or 10nM, gastrin and CGRP, respectively, and the fluo-4 signal was recorded every 2 seconds.
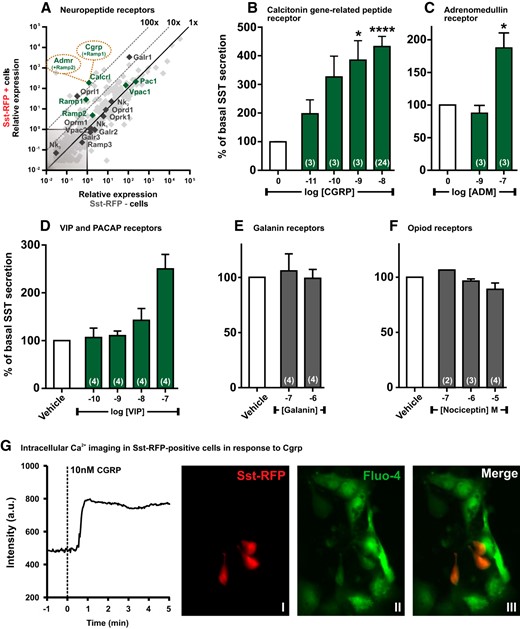
qPCR and functional analysis of the neuropeptide GPCRs. A, Expression of 379 GPCRs in Sst-RFP− (x-axis) vs Sst-RFP+ (y-axis). The neuropeptide receptors are highlighted in green or black and displayed with gene name, whereas the remaining GPCRs are indicated in light gray. B–F, SST release from primary gastric mucosal cells normalized to basal secretion, shown as mean ± SEM, with number of repeated experiments indicated in brackets in each bar. B, Increasing concentrations of CGRP. B, Increasing concentrations of ADM. D, Increasing concentrations of VIP. E, Two concentrations of galanin. F, Increasing concentrations of nociceptin. G, A representative single cell intracellular calcium recording in response to 10nM CGRP (n = 6). I, the Sst-RFP+ cells; II, Fluo-4 loading of the cells; and III, an overlay indicating the Fluo-4 loaded Sst-RFP+ used for measurements.
Compounds and ligands
The free fatty acid receptor (FFAR4)-selective agonist compound B provided by Merck is example 209 in Ref. 46. Isoproterenol, sodium acetate, sodium propionate, sodium L-lactate, gastrin, serotonin, and norepinephrine were from Sigma-Aldrich. α-CGRP, vasoactive intestinal peptide (VIP), cholecystokinin (CCK)8, glucose-dependent insulinotropic polypeptide (GIP), glucagon-like peptide 1 (GLP-1), α-melanocyte-stimulating hormone (α-MSH), BIM-23627, cyclo-(7-aminoheptanoyl-Phe-D-Trp-Lys-Thr(Bzl)), nociceptin, and galanin were from Bachem. BW-723C86, R-568 hydrochloride, and WB-4101 were from Tocris.
Statistics
Data were visualized and tested for significance using GraphPad Prism 6. Differences in SST release from primary gastric mucosal cells were assessed using nonparametric one-way ANOVA (Kruskal-Wallis) with Dunn’s post hoc test, when 3 or more samples were compared. When only comparing 2 samples, a Mann-Whitney test was used. Statistical significance was defined as *, P < .05; **, P < .01; and ***, P < .001 for all tests.
Results
Peptide expression in Sst cells from the Sst-RFP reporter mice
The Sst-RFP reporter mice were generated by crossing Ssttm2.1(cre)Zjh/J with B6.Cg-Gt(ROSA)26Sortm14 (CAG-tdTomato)Hze/J, and are referred to as the Sst-RFP mice henceforth. The Ssttm2.1(cre)Zjh/J mice driving the Cre expression to the SST cells were generated but only partially characterized as they were published together with approximately 20 other novel Cre and inducible CreER knock-in driver lines by Taniguchi et al in a paper focusing on central nervous system neurons (38). Consequently, our first goal was to establish whether the expression of the Cre and consequently the RFP reporter in the stomach as well as the pancreas correlated with Sst expression. For pancreas, the Sst-RFP reporter protein was expressed selectively in the SST-immunoreactive δ cells, which in the mice are preferentially located in the periphery of the islets (Supplemental Figure 1A). Based on multiple sections from pancreas of 3 mice counterstained with antibody against SST, we observed that 96% of the SST-immunoreactive cells expressed the Sst-RFP reporter, whereas 91% of the cells positive for RFP also displayed SST-immunoreactivity. Multiple sections from the stomach revealed that 92% of the SST-immunoreactive cells expressed the Sst-RFP reporter, whereas 89% of the cells positive for RFP also displayed SST-immunoreactivity (Figure 2A and Supplemental Figure 1A). It should be noted that the RFP reporter protein is expressed throughout the cytosol, whereas the SST-immunoreactivity is only observed in the distinct location of the cells were the SST containing secretory granules are located. This is especially relevant in the stomach were the apical part of the cells and the basal processes of the SST cells are red due to the RFP reporter, whereas these parts of the cells only costain for SST when they contain secretory granules with SST.
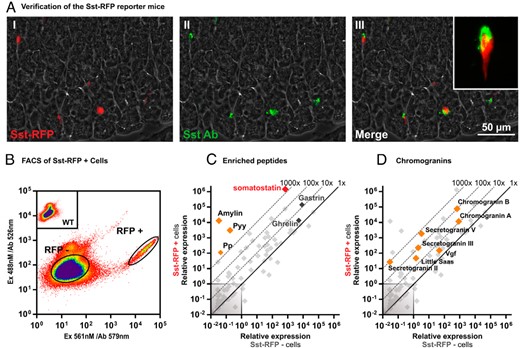
Basic characterization and verification of the Sst-RFP mice. A, A representative image from the immunohistochemical characterization of Sst-RFP expression in gastric tissue from the Sst-RFP mice: I, Sst-RFP endogenous fluorescence; II, immunohistochemical staining for SST; and III, overlay. B, Representative FACS diagram indicating the gating strategy for selecting RFP+ vs RFP− cells. C and D, qPCR for 88 transcripts encoding peptide hormones, neuropeptides, and granins in RFP+ vs RFP− cells. The relative expression in Sst-RFP− cells (x-axis) vs Sst-RFP+ cells (y-axis). C, The enriched neuropeptides Sst, Pp, Pyy, and amylin are highlighted in red and orange, whereas the data point for gastrin and ghrelin are given in dark gray. D, The expression levels of all granins are indicated in orange.
FACS purification of the Sst-RFP+ cells (Figure 2B) enabled RNA extraction and qPCR analysis of the Sst-RFP+ vs Sst-RFP− cells from the stomach. Coexpression of several different peptide hormones has been reported for intestinal enteroendocrine cells (42, 47); consequently, we probed the Sst-RFP+ cells for the expression of 88 different peptide hormone and neuropeptide precursors. As expected, SST was the most highly expressed peptide transcript and was more than 1000-fold enriched in the purified Sst-RFP+ cells compared with surrounding cells (Figure 2C). Surprisingly, Pyy, Iapp (the transcript for proamylin), and Ppy (the transcript for propancreatic polypeptide) were also enriched by more than 1000-fold in the Sst-RFP+ cells, although their actual expression level was rather low, in particular for Ppy (Figure 2C). Immunohistochemistry demonstrated costaining for PYY and SST in a subpopulation of SST cells of both the human and mouse stomach (Supplemental Figure 1, B and C).
A number of granins, which are acid proteins selectively expressed in large dense-core secretory vesicles (48), were also enriched in the Sst-RFP+ cells with chromogranin A and B and secretogranin V being the most highly expressed and enriched (Figure 2D).
Expression and function of gastric SST cell metabolite GPCRs
A number of metabolite GPCRs were highly expressed and enriched in the Sst-RFP+ cells. Of these, the calcium-sensing receptor (CaSR), which is activated by calcium ions and amino acids such as phenylalanine, was both the most highly expressed and most enriched receptor (∼200-fold). FFAR2 (GPR43) and FFAR4 (GPR120), the receptors for short chain fatty acids and long-chain fatty acids, respectively, were both highly expressed and enriched by approximately 50-fold (Figure 3A). The lactate receptor GPR81 was similarly highly expressed but was not as enriched in the SST cells as compared with the neighboring cells (Figure 3A).
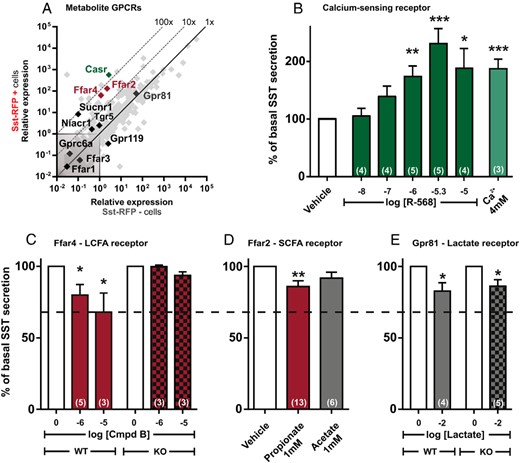
qPCR and functional analysis of the metabolite GPCRs. A, Expression of 379 GPCRs in Sst-RFP− (x-axis) vs Sst-RFP+ (y-axis). The metabolite receptors are displayed with gene name, whereas the remaining GPCRs are shown in light gray in the background. B–E, SST release from primary gastric mucosal cells normalized to basal secretion, shown as mean ± SEM, with number of repeated experiments indicated in brackets in each bar. B, Increasing concentration of the CaSR agonist R-568 and 4mM Ca2+ (the media contains 1.8mM Ca2+). C, Two concentrations of the FFAR4 agonist, compound B, in wild-type mice (red bars) and Ffar4 KO mice (red and black bars). D, The FFAR2 agonists, propionate (red bar) and acetate (gray bar), in wild-type mice. E, The GPR81 receptor agonist, lactate, in wild-type mice (gray bar) and Gpr81 KO mice (gray and black bars).
Functional analysis showed that the calcimimetic R-568 hydrochloride as well as calcium ions stimulated SST release robustly from primary cultures of gastric epithelial cells (Figure 3B). The FFAR4-specific agonist compound B (46), which inhibits ghrelin secretion efficiently (40), also inhibited SST release, which was not observed in cells isolated from Ffar4-deficient mice (Figure 3C). The short chain fatty acid, propionate, slightly but significantly inhibited SST release, whereas acetate, another short chain fatty acid, did not achieve a significant level of inhibition of SST release (Figure 3D). Lactate, which functions as a GPR81-dependent inhibitor of ghrelin secretion in this preparation (40), had a minimal but significant inhibitory effect on SST release. However, this effect was also was observed in Gpr81-deficient mice, indicating that this is likely a nonspecific effect (Figure 3E).
Expression and function of gastric SST cell neurotransmitter GPCRs
The qPCR analysis demonstrated that the muscarinic acetylcholine receptor M4 is the most highly enriched receptor in Sst-RFP+ cells, exhibiting an enrichment of over 10 000-fold. Although the M3 receptor was not enriched in the SST cells, it was as highly expressed as the M4 receptor (Figure 4A). Appropriate selective agonists are not available for these muscarinic receptors; however, the nonselective stable muscarinic agonist, vincamine, stimulated SST secretion from the primary gastric cultures, indicating that the stimulatory, Gαq-coupled M3 receptor dominates over the inhibitory Gαi-coupled M4 receptor in this preparation (Figure 4B).
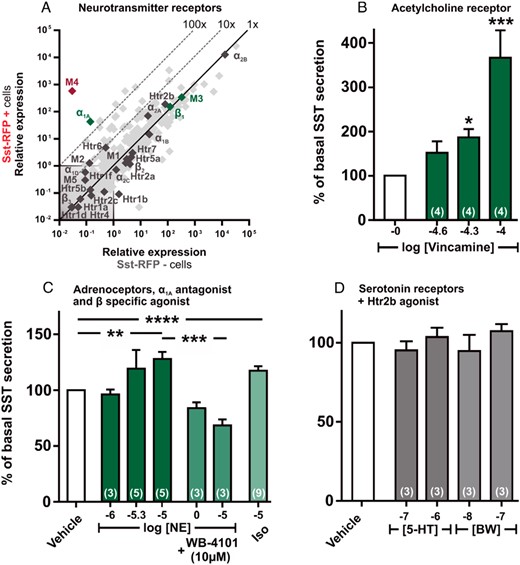
qPCR and functional analysis of the neurotransmitter GPCRs. A, Expression of 379 GPCRs in Sst-RFP− (x-axis) vs Sst-RFP+ (y-axis). The neurotransmitter receptors are displayed with gene name, whereas the remaining GPCRs are light gray in the background. B–D, SST release from primary gastric mucosal cells normalized to basal secretion, shown as mean ± SEM, with number of repeated experiments indicated in brackets in each bar. B, Increasing concentration of the acetylcholine receptor agonist Vincamine. C, Increasing concentrations of norepinephrine (dark green bars), norepinephrine + WB-4101 (α1A antagonist) (medium green bars), and isoproterenol (light green bar). D, Two concentrations of serotonin (gray bars) and 2 concentrations of BW-723C86 (Htr2b agonist) (light gray bars).
Among the adrenergic receptors, the α2B receptor was very highly expressed, but not enriched, in the Sst-RFP+ cells (Figure 4A). Similarly, the α2A and β1 receptors were highly expressed, albeit at a lower level in the SST cells, but were not enriched. In contrast, the α1a receptor was the only adrenergic receptor that was highly enriched in the Sst-RFP+ cells, exhibiting 300-fold enrichment (Figure 4A). Norepinephrine stimulated release of SST, which was eliminated by the α1A-specific antagonist, WB-4101 (Figure 4C). Isoproterenol, a specific ligand for the β-adrenergic receptors, stimulated SST release significantly, conceivably through the Gαs-coupled β1 receptor, which was also very highly expressed and stimulated gastric ghrelin secretion in similar preparation (40).
The 5-HT2b receptor was highly expressed, although not enriched, in the Sst-RFP+ cells. However, neither serotonin nor the 5-HT2b-selective agonist BW-723C86 had any effect on SST release (Figure 4D).
The expression profile of the remaining small-molecule neurotransmitter receptors is listed in Supplemental Figure 2.
Expression and function of gastric SST cell neuropeptide receptors
The qPCR analysis showed that a number of neuropeptide receptors were highly expressed in the Sst-RFP+ cells, including the galanine receptor 1 (Galr1), the VIP and pituitary adenylate cyclase activating polypeptide 1 receptors (Vpac1 and Pac1). The receptor for CGRP, a heterodimer comprising a family C GPCR called calcitonin-related peptide receptor 1 (Calcrl) and the single-pass transmembrane receptor-associated modifying protein (Ramp)1, which both are highly expressed and reasonably enriched in the SST cells, with Calcrl showing a 100-fold enrichment (Figure 5A). Ramp2 is also enriched, albeit to a lower degree than Ramp1, but this raises the possibility that the receptor for adrenomedullin (ADM) composed of a heterodimer between Calcrl and Ramp2 could also be functionally expressed (Figure 5A). CGRP was the most efficacious and potent SST secretagogue tested in the primary gastric cell cultures, invoking a more than 4-fold increase in the release of SST (Figure 5B), whereas ADM also clearly stimulated SST release although with a lower potency (Figure 5C). VIP, which acts through both the VPAC1/2 and the PAC1 receptors, also stimulated SST release efficiently but also with a relatively low potency (Figure 5D). In contrast, neither galanin nor nociceptin (the opiate receptor-like 1 ligand) had any effect on the SST secretion (Figure 5, E and F), although RNA transcripts for both receptors were highly expressed.
Ex vivo gastric cultures from the Sst-RFP mice were loaded with fluo-4 and stimulated with CGRP, which induced a rapid, robust increase in intracellular calcium in the Sst-RFP-positive cells (Figure 5G).
The expression profile of the remaining neuropeptide receptors can be found in Supplemental Figure 3.
Expression and function of gastric SST cell peptide hormone receptors
Several peptide hormone receptors were found to be highly expressed and/or enriched in the Sst-RFP+ cells (Figure 6A). The GLP-1 receptor was the most highly expressed receptor but was not enriched, reflecting that it is also highly expressed on other epithelial cells of the gastric mucosa, such as ghrelin cells (40). GLP-1, as expected, functioned as a potent and efficacious stimulator of SST secretion from the primary gastric cell cultures (Figure 6B). The receptor for GIP, the other incretin hormone, was the most enriched peptide hormone receptor in the SST cells (Figure 6A). Accordingly, stimulation with GIP increased SST secretion to the same degree as it did under the influence of GLP-1, although GIP was slightly less potent (Figure 6C).
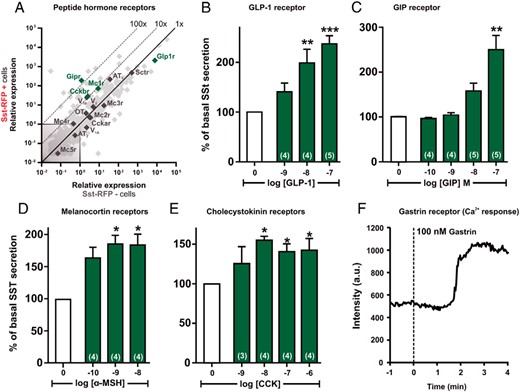
qPCR and functional analysis of the peptide hormone GPCRs. A, Expression of 379 GPCRs in Sst-RFP− (x-axis) vs Sst-RFP+ (y-axis). The peptide hormone receptors are displayed with gene name, whereas the remaining GPCRs are light gray in the background. B–E, SST release from primary gastric mucosal cells normalized to basal secretion, shown as mean ± SEM, with number of repeated experiments indicated in brackets in each bar. B, Increasing concentrations of GLP-1. C, Increasing concentrations of GIP. D, Increasing concentrations of α-MSH. E, Increasing concentrations of CCK. F, A representative single cell intracellular calcium recording in response to 100nM gastrin (n = 5).
The MC1 receptor, which is chiefly expressed in the skin, was surprisingly both highly expressed and enriched (∼100-fold) in the Sst-RFP+ cells (Figure 6A) and α-MSH stimulated SST secretion to the same degree as the 3 other peptide hormones tested, but with subnanomolar potency (Figure 6D).
Cholecystokinin is known to stimulate SST secretion, an observation that was confirmed in the primary gastric cell cultures (Figure 6E). Because the CCKb receptor was highly expressed and 10-fold enriched (Figure 6A), it is likely that it is a direct target for CCK and gastrin on the SST cells. That the CCKb receptors are functionally expressed on the SST cells was supported by the observed increase in intracellular calcium observed in Sst-RFP-positive cells in fluo-4 loaded primary gastric cultures (Figure 6F) after stimulation with gastrin.
The expression profile of the remaining peptide hormone receptors can be found in Supplemental Figure 4.
Expression and function of SSTRs on the gastric SST cells
Surprisingly, 2 of the receptors for SST itself, SSTR1 and SSTR2, were found to be among the most highly expressed receptors in the Sst-RFP+ cells (Figure 7A). SSTR1 was approximately 100-fold enriched, whereas SSTR2 was not enriched at all (Figure 7A). We did not have access to selective SSTR1 and 2 receptor antagonists; however, treatment with 2 different nonselective peptide-based SSTR antagonists, BIM-23627 and cyclo(-7-aminoheptanoyl-Phe-D-Trp-Lys-Thr(Bzl)), increased SST release from the gastric mucosal cell cultures to a similar degree as the tested peptide hormones did (Figure 7B). In situ hybridization with probes specific for Sstr1 and Sstr2, respectively, revealed that although Sstr2 is broadly expressed in most epithelial cells throughout the ventricle, ie, in both the corpus and the antrum, Sstr1 is very weakly or not at all expressed in the corpus, but strongly expressed in a subpopulation of cells in the base of the gastric glands in the antrum, which is also where the SST cells are located (Figure 7, C and D) (11, 15).
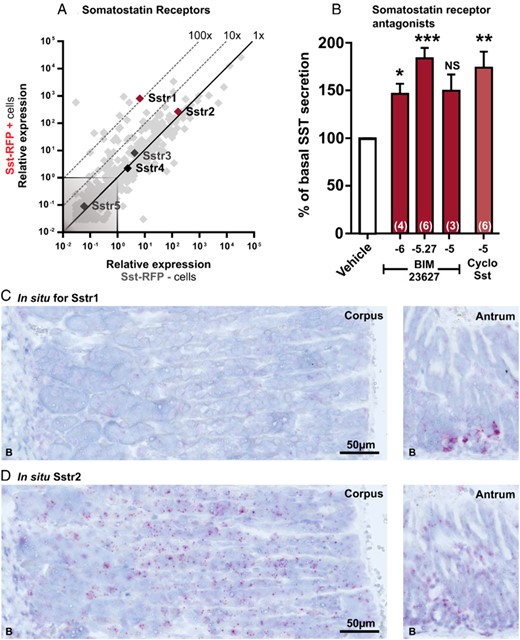
qPCR and functional analysis of the SSTRs (Sstr1–Sstr5) and in situ hybridization for Sstr1 and Sstr2. A, Expression of 379 GPCRs in Sst-RFP− (x-axis) vs Sst-RFP+ (y-axis). The SSTRs are displayed with gene name, whereas the remaining GPCRs are light gray in the background. B, SST release from primary gastric mucosal cells normalized to basal secretion, shown as mean ± SEM, with number of repeated experiments indicated in brackets in each bar. Increasing concentrations of BIM-23627 (dark red bars), 10μM cyclo(-7-aminoheptanoyl-Phe-D-Trp-Lys-Thr(Bzl)) (light red bar). C and D, Representative in situ hybridization in mouse gastric tissue from corpus and antrum performed in 3 mice. Probes for Sstr1 (C) and probes for Sstr2 (D). See Supplemental Figure 14 for the corresponding control experiments.
SSTR1 was highly enriched in the FACS-purified Sst-RFP cells and was localized by in situ hybridization to the base of the gastric glands in the antrum; SST cells are known to localize to the same region. Consequently, the stimulatory effect of the SST antagonists reveals that SSTR1 is most likely the receptor responsible for the autocrine feedback inhibition of SST, at least in the antrum.
The complete gastric SST cell GPCRs expression profile
The expression data for all 379 of the nonodorant GPCRs probed for by qPCR analysis in the FACS-purified Sst-RFP+ cells are listed in Supplemental Table 3. We recently probed and published the expression pattern of these GPCRs in the gastric ghrelin cells (40). Furthermore, the scattergrams for all GPCR families not presented in the result section above are shown in Supplemental Figures 5–13.
Discussion
In the present study, we have characterized the expression and function of GPCRs in gastric SST cells from reporter mice expressing RFP selectively in these cells. Our findings have enabled us to provide a preliminary map (Figure 8) illustrating the receptors present on the SST cell and their regulation by hormones, neurotransmitters, neuropeptides, and metabolites. We present evidence that these ligands act directly on the SST cell to regulate its secretion of SST, which acts in a paracrine manner to control many important luminal and basolateral secretory processes in the gastric mucosa (see Figure 1).
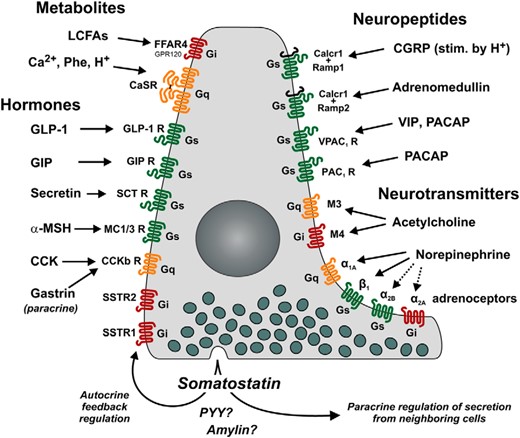
Repertoire of 7TM GPCRs controlling SST secretion directly on the SST cells of the stomach as based on the results of the present study. Receptors in green (Gαs-coupled) and orange (Gαq-coupled) stimulate, whereas red (Gαi-coupled) receptors inhibit, SST release. Seven identified receptors for hormonal control are indicated on the left, with the receptors for GLP-1, GIP, secretin α-MSH, and CCK/gastrin inducing release of SST, whereas SSTR1 and SSTR2 receptors function as autoinhibitory negative regulators. Metabolites elicit both excitatory (CaSR) and inhibitory (FFAR4) signals through Ca2+/H+/aromatic amino acids and long-chain fatty acids, respectively. The 10 neuronally controlled receptors are indicated on the right. The VIP and pituitary adenylate cyclase activating polypeptide 1 (PACAP) receptors positively regulate SST release together with CGRP and ADM. Acetylcholine is capable of both inhibiting and stimulating SST release by acting at the muscarinic receptors M4 and M3, respectively. The adrenoceptors are also capable of both stimulating and inhibiting the secretion of SST, depending on which subtype receptor is stimulated; α2B, α1A, and β1 elicit secretion, whereas α2A inhibits secretion of SST.
CaSR and Ffar4 are the main metabolite GPCRs regulating SST release
CaSR, which is a sensor of amino acids such as phenylalanine, as well as calcium ions, is the most highly enriched and expressed metabolite receptor, and the calcimitetic R-568 acts as a robust positive regulator of SST release (Figure 3, A and B). In the stomach, CaSR was already known to be expressed in gastrin (49), parietal (50), and ghrelin cells (40), but the receptor is also relatively highly expressed in both the mucosa and the muscularis, and is in fact expressed in 50%–75% of all the cells in the gastric glands (50).
FFAR4 (GPR120), which is a receptor for long-chain fatty acids, is enriched 50-fold in the SST cells and the FFAR4-specific ligand compound B is the most efficacious negative regulator of SST secretion among the tested ligands (Figure 3C). Recent publications have demonstrated that FFAR4 also acts as an efficacious negative regulator of ghrelin secretion (40, 51, 52) and that this is mediated via Gαi (40), which was surprising, because FFAR4 generally is considered to be a Gαq-coupled receptor. However, it has recently been shown that FFAR4 also inhibits the secretion of pancreatic SST (53). Free fatty acids have previously been proposed to stimulate rather than inhibit gastric SST secretion (33). However, this conclusion was based on experiments that used iv injection of triglycerides, a method that is likely to result in indirect effects, unrelated to the direct action of free fatty acids on SST cells.
Among the other metabolites that are important negative regulators of ghrelin secretion (40) lactate induced only a small, nonreceptor mediated, inhibitory effect on SST secretion, whereas the inconspicuous negative effect of the short chain fatty acid, propionate, remains to be validated in FFAR2-deficient animals.
The M3 and M4 muscarinic acetylcholine receptors have opposite actions on the SST cells
Acetylcholine as a vagal parasympathetic transmitter is generally believed to inhibit gastric SST release, although the muscarinic receptor(s) it activates have not yet been identified (18, 54). However, activation of muscarinic receptors in stomach cultures has also been observed to stimulate SST release (17). This was attributed to differences between the regions of the stomach being assayed, the antrum and the corpus-fundus (17, 19, 22); however, the results were difficult to interpret also due to interspecies variations. However, by using pertussis toxin to block Gαi signaling, Chiba et al (19) observed a shift in SST response to acetylcholine from inhibition to stimulation of SST release. This suggested that gastric SST secretion is regulated by a combination of inhibitory and stimulatory muscarinic receptors. Our receptor study may provide a likely explanation for this phenomenon. Although the Gαi-coupled M4 receptor is highly enriched (by >20 000-fold) in the gastric SST cells, the stimulatory M3 receptor is expressed at similarly high levels without any enrichment. In our preliminary functional analysis using vincamine, which has a slight, 3-fold preference for the M3 receptor (55), we observed a stimulation of SST secretion in the gastric cells cultures (Figure 4B). In order to elucidate whether these muscarinic receptors are coexpressed on SST cells or expressed separately in the corpus-fundus and the antrum, qPCR and functional analysis should be performed on cells and crypts isolated separately from these stomach regions. This will clarify the mixed findings obtained using the corpus-fundus and the antrum fractions (17, 19). Nevertheless, our study demonstrates that both the inhibitory muscarinic M4 and the stimulatory M3 receptors are involved in the control of gastric SST secretion.
The α1A and the β1 receptors are main adrenergic regulators of SST secretion
Adrenergic stimulation is known to stimulate gastric SST secretion (20, 21). We find that several adrenergic receptors are expressed on the gastric SST cells. The α1A receptor is the most highly enriched, whereas the α2B receptor is similarly expressed, but is not enriched at the mRNA level (Figure 4A). Using norepinephrine and a specific antagonist against the α1A receptor, we find that the α1A receptor is a major positive regulator of SST release (Figure 4C). The β1 receptor is highly expressed in gastric SST cells as well as in the ghrelin cells (40), and the β-selective agonist, isoproterenol, also stimulates SST secretion (Figure 4C). Thus, we believe that our study shows that the Gαq-coupled α1A and the Gαs-coupled β1 receptor are positive regulators of SST secretion, whereas the functional consequences of high expression of transcripts for the α2A and α2B receptors needs to be further characterized.
The neuropeptide CGRP, ADM, and VIP receptors act as positive regulators of SST secretion
The sensory neuropeptide CGRP has been shown to stimulate SST secretion and thereby protect the gastric mucosa (29, 32). Our data indicate that this effect is mediated by CGRP, which is conceivably released from the sensory nerve endings to act directly on the gastric SST cells, where the composite CGRP receptor is highly expressed and enriched and where CGRP is the most effective of the SST secretagogues tested (Figure 5B). ADM is also known to stimulate SST release through the composite ADM receptor (56), which we also observe (Figure 5C), although with lower potency than CGRP. Another neuropeptide, VIP, was identified early on as a stimulator of SST secretion (28, 31). Our study identifies the VPAC1 receptor as the likely target for VIP on the SST cells. However, the Gαs-coupled PAC1 receptor is also highly expressed (but not enriched) on SST cells and therefore also needs to be taken into consideration.
The apparent high level of transcripts coding for the 2 other neuropeptide receptors, Galr1 and the opiate receptor-like 1 receptor, without any response to their cognate agonists is puzzling. Galanin has been shown to suppress gastric acid secretion, albeit independently of SST (30). We do not observe any inhibition of SST secretion from galanin, although the Gαi-coupled GalR1 receptor is among the most highly expressed receptors on SST cells and is enriched by approximately 10-fold (Figure 5A). Similarly, nociceptin was expected to decrease SST release, because its Gαi-coupled receptor is highly expressed and 100-fold enriched and nociceptin has previously been reported to inhibit SST secretion (24). A potential explanation for this is that Lippl et al (24) specifically studied the inhibitory effect of nociception on the GIP-stimulated SST secretion. Interestingly, classical opioid agonists have been known for years to inhibit gastric SST secretion. However, we find the μ- and κ-opioid receptors to be expressed on the SST cells at relatively low levels. Thus, we propose that the inhibitory effect of the opioids on the SST secretion is mediated indirectly through some neuronal or endocrine regulatory mechanism.
Several peptide hormone receptors stimulate SST secretion
GLP-1 and GIP are known stimulators of gastric SST secretion (23, 24, 26). Because we find the receptor for GLP-1 to be among the most highly expressed GPCRs in the SST cells and the GIP receptor also to be highly expressed and more than 100-fold enriched, we conclude that these 2 gut hormones exert their effects by acting directly on the gastric SST cells.
Likewise, CCK is known to stimulate SST release from the gastric SST cells (25), although the subtype of CCK receptor involved has been debated (27). Our data suggest that CCK acts directly through the CCKb receptor. However, the CCKb receptor also functions as the gastrin receptor and gastrin is known to stimulate SST release (27), which we also observe, indicating that gastrin secreted from the neighboring gastrin cells in the antrum acts in a paracrine manner in a local mutual feedback regulatory mechanism, similar to that of SST.
Surprisingly, our results show that the melanocortin MC1 receptor is highly expressed and enriched in the SST cells, and that α-MSH stimulates SST release from the gastric SST cells. To the best of our knowledge, this is the first time α-MSH has been shown to stimulate SST secretion. Interestingly, α-MSH has been shown to protect against ethanol-induced gastric injury in rats through a at that time elusive mechanism (57). Because we now provide evidence that α-MSH through the MC1 receptor is capable of stimulating gastric SST release directly, we propose that this is the mechanism through which it provide its protective effect on the gastric mucosa.
Generally, it appears that all of the expressed peptide hormone receptors act as positive modulators of the SST cells. The receptor for secretin, which is highly expressed, although not enriched, has also been reported to stimulate gastric SST secretion (28). There are no data available for the function of angiotensin; however, because we observed that the Gαq-coupled AT1 receptor is highly expressed and highly enriched compared with the Gαi coupling AT2 receptor, we expect that angiotensin will also stimulate SST secretion.
SST acts as an autocrine feedback inhibitor on its own secretion
Surprisingly, we found both the SSTR1 and SSTR2 receptor to be highly expressed on the gastric SST cells. Although SSTR2 is not enriched, SSTR1 is 100-fold enriched (Figure 7). The fact that 2 different nonselective SSTR blockers increased SST secretion demonstrates that SST acts in an autocrine feedback loop to inhibit its own secretion. Whether it is the SSTR1 or SSTR2 receptor, or both, which are responsible for this is unclear. The high enrichment of SSTR1 and the in situ hybridization data together indicate that this receptor is at least responsible for the effect observed in the antrum. More detailed pharmacological studies and an analysis of the expression and function of the SSTRs in the corpus-fundus vs the antrum are required to elucidate these observations. However, the in situ hybridization data show that the SSTR2 receptor is the most widely expressed receptor throughout the gastric epithelium, and the receptor through which SST mediates its inhibitory effects on cells of the gastric mucosa.
The gastric SST cells coexpress PYY and amylin
Enteroendocrine cells of the intestine generally express and store 2 or more, often functionally related, peptide hormones (42, 47, 58). However, this is not the case for the gastric ghrelin cell, in which the expression of peptide hormone precursors other than proghrelin is negligible (42, 59). Although we had expected a similar situation in the gastric SST cells, our data show that transcripts for amylin and PYY transcripts are not only expressed at reasonably high levels, but are actually enriched to an even greater degree than are transcripts for SST itself (Figure 2C). Initially, there were methodological problems related to the FACS-purification of the Sst-RFP+ cells, which were difficult to separate and purify compared with the other enteroendocrine cell populations we have worked with in the past (40, 42, 45), conceivably due to their intimate interactions with neighboring cells through their autocrine secretory processes (14, 15). However, in the final preparations of highly purified Sst-RFP+ cells, the transcripts from the neighboring gastrin and ghrelin cells are not particularly enriched; rather, we observe that the transcripts for amylin, PYY and pancreatic polypeptide, are highly enriched. Although highly enriched, the expression level of pancreatic polypeptide appears to be too low to have functional consequences. However, the expression of amylin and PYY in SST cells, which has also been previously has been reported (60, 61), could merit further investigation.
Acknowledgments
We thank Susanne Hummelgaard and Stine Lindberg Vedersø for expert technical assistance.
The Novo Nordisk Foundation Center for Basic Metabolic Research is supported by an unconditional grant from the Novo Nordisk Foundation to University of Copenhagen. M.S.E. was fully supported by a postdoc fellowship from the Novo Nordisk Foundation through the Danish Diabetes Academy.
Disclosure Summary: The authors have nothing to disclose.
Abbreviations
- ADM
adrenomedullin
- Calcrl
calcitonin-related peptide receptor 1
- CaSR
calcium-sensing receptor
- CCK
cholecystokinin
- CGRP
calcitonin gene-related peptide
- Ct
cycle threshold
- ECL
enterochromaffin like
- FBS
fetal bovine serum
- FFAR4
free fatty acid receptor 4
- GI
gastrointestinal
- GIP
glucose-dependent insulinotropic polypeptide
- GLP-1
glucagon-like peptide 1
- GPCR
G protein-coupled receptor
- KO
knockout
- MSH
melanocyte-stimulating hormone
- PYY
peptide YY
- qPCR
quantitative PCR
- Ramp
receptor-associated modifying protein
- RFP
red fluorescent protein
- SST
somatostatin
- Sstr
SST receptor
- VIP
vasoactive intestinal peptide
- Vpac1
VIP receptor type 1.
