


Abstract
We determined the consequences of the loss of D2 receptors (D2R) on the GH-IGF-I axis using mice deficient in functional dopamine D2 receptors by targeted mutagenesis (D2R−/−). Body weights were similar at birth, but somatic growth was less in male D2R−/− mice from 1–8 months of age and in D2R−/− females during the first 2 months. The rate of skeletal maturation, as indexed by femur length, and the weight of the liver and white adipose tissue were decreased in knockout male mice even though food intake was not altered. The serum GH concentration was significantly decreased during the first 2 months in knockout female and male mice, and IGF-I and IGF-binding protein-3 levels were lower in knockout mice. PRL was significantly higher in knockout mice, and females attained higher levels than males. Pituitaries from adult knockout mice had impaired basal GH release and a lower response to GHRH in vitro. We propose that the D2R participates in GHRH/GH release in the first month of life. In accordance, the D2R antagonist sulpiride lowered GH levels in 1-month-old wild-type mice. Our results indicate that lack of D2R alters the GHRH-GH-IGF-I axis, and impairs body growth and the somatotrope population.
GH SECRETION from the pituitary is primarily controlled by two major hypothalamic factors, GHRH and somatostatin. Other hypothalamic peptides and neurotransmitters are thought to be involved in the modulation of GH secretion either at the pituitary level or via the hypothalamus interacting with the GHRH or somatostatin neurons (1). The role of dopaminergic systems in the control of GH release remains controversial at some points, i.e. the direction of action (stimulatory or inhibitory) and the species differences. Inhibitory as well as stimulatory effects of the amine have been reported on plasma levels of GH in vivo depending upon the experimental conditions used. This may be explained by the ability of dopamine to release both GHRH and somatostatin from the rat hypothalamus (2) and by the different sensitivities of somatostatin and GHRH in relation to the endogenous dopaminergic tone. In vitro, positive as well as negative GH responses to the catecholamine have been described in pituitary cells freshly dispersed or kept in primary culture (1, 3–7). In particular, it has been suggested that dopamine receptors can mediate the stimulation by dopamine of GH provided that other neural inhibitory inputs to the pituitary are removed (8).
Gene targeting using homologous recombination to inactivate a chosen gene has been developed in the last years, and its application to dopamine receptor biology has provided an invaluable tool to investigate the function of each receptor subtype (9–12). In the present experiments we have used mice that are deficient in functional D2 receptors by targeted mutagenesis of the D2 receptor (D2R) gene in embryonic stem cells (D2R−/−) to determine the endocrine consequences of the loss of dopamine D2 receptors on the GH-IGF I axis. We reported previously that these mice have chronic hyperprolactinemia, and female mice develop anterior lobe lactotrope hyperplasia due to the lack of dopaminergic inhibition (13). Furthermore, pituitary adenomas composed mainly of lactotropes, with no detectable mammosomatotrope component, develop in both female and male mice at 17–20 months of age (14). However, the GH axis of these mice has not been studied in detail. In this regard D2R−/− mice provide a useful experimental model to assess the controversial role of the D2R in GH regulation.
Although GH is recognized as having direct cellular effects on the growth and metabolism of cells, the predominant effect is on the synthesis and secretion of IGFs. The most important family member is IGF-I, which is mainly synthesized in the liver under the influence of GH. The IGF system is known to consist of the growth factors themselves and at least 7, and probably up to 10, IGF-binding proteins (IGFBP) (15). These act by either regulating the availability of IGFs to their receptors or directly at their target cells. In this context we have evaluated not only GH secretion, but also plasma levels of IGF-I and IGFBP-3 [which binds >95% of circulating IGF-I and -II (1)] in relation to growth rate in wild-type and mutant D2R−/− mice.
Materials and Methods
Animals
D2 dopamine receptor knockout mice, official strain designation B6.129S2-Drd2tm1low by the Induced Mutant Resource at The Jackson Laboratory (Bar Harbor, ME), generated by targeted mutagenesis of the D2R gene in embryonic stem cells (13, 14) were used. The original F2 hybrid strain (129S2/Sv × C57BL/6J) containing the mutated D2 receptor allele was backcrossed for eight generations to wild-type C57BL/6J mice. Mutant and wild-type mice were generally the product of heterozygote crossings, and in all cases sibling controls were used. Mice were separated by sex, housed in groups of four or five with mixed genotypes in an air-conditioned room with lights on at 0700 and off at 1900 h. They had free access to laboratory chow and tap water. Wild-type, heterozygous, and knockout mice were identified by PCR of genomic DNA. All experimental procedures were reviewed and approved by the institutional animal care and use committee of either Instituto de Biología y Medicina Experimental, Buenos Aires (Division of Animal Welfare, Office for Protection from Research Risks, NIH) or Oregon Health and Science University.
Drugs
Unless specified, all chemicals were purchased from Sigma (St. Louis, MO).
DNA extraction and PCR
DNA was extracted from ear tissue using the Wizard Genomic DNA Purification Kit (Promega Corp., Madison, WI). Genotyping was performed by touchdown PCR using three primers: intron 7 sense, 5′-TGA TGA CTG GGA ATG TTG GTG TGC-3′; exon 8 antisense, 5′-CCG AGC CAA GCT AAC ACT GCA GAG-3′; and NEO antisense, 5′-AGG ATT GGG AAG ACA ATA GCA G-3′. The expected amplification products were wild-type allele (∼700 bp) and knockout allele (∼350 bp).
Food intake
Thirteen- to 14-wk-old knockout or wild-type male mice were individually caged and provided with a known amount of chow pellets (5% fat, 19% protein, and 5% fiber by weight; 3.4 kcal/g) in one corner of their cage. The mice and residual food were weighed at 1600 h on 3 consecutive days.
Blood samples
Blood samples were obtained under ether anesthesia by retroorbital puncture. Blood sampling was performed in newborn, 2-wk-old, and 1-, 2-, 3-, 4-, 5-, 6-, and 7-month-old female and male mice of both genotypes. In one group of mice (4–6 months old) we determined the effect of ether fumes on hormone secretion. To that end, half of the animals were killed by decapitation (1 min after removal from cage), and trunk blood was collected; the other half were subjected to ether fumes (1 min in jar with ether-soaked towels beneath them), and blood was immediately collected by retroorbital puncture. Blood for determination of serum IGFBP-3 was collected by decapitation of 6-wk-old mice.
In vivo experiments
Wild-type or knockout female and male mice of different ages were divided in groups and treated with saline solution (controls) or with either (−)sulpiride (Vipral, Laboratorios Roemmers, Buenos Aires, Argentina), a D2 antagonist in a dose of 5 mg/kg, ip, or SCH 23390-HCl, (1-chloro-8-hydroxy-3-methyl-1-phenyl-2,3,4,5 tetrahydro-1H-3-benzazepine), a D1 antagonist, dissolved in hexadistilled water in a dose of 0.1 mg/kg, ip. Fifty minutes after injection blood was collected by decapitation. Sera were kept at −20 C until RIAs were performed.
Cell dispersion and culture
Anterior pituitaries from 20-d-old or 8-month-old wild-type and knockout mice of both sexes were weighed and dissociated into single cells. Anterior pituitaries were placed in chambers containing freshly prepared Krebs-Ringer bicarbonate buffer without Ca2+ or Mg2+. Buffer contained 14 mm glucose, 1% BSA, 2% MEM amino acids, 1% MEM vitamins (Life Technologies, Inc., Buenos Aires, Argentina), and 2 mm glutamine and was previously gassed during 15 min with 95% O2 and 5% CO2, and adjusted to pH 7.35–7.40. Buffer was sterilized by filtration through a 0.45-μm pore diameter membrane (Millipore Corp., Bedford, MA). Pituitaries were washed three times with Krebs-Ringer bicarbonate buffer and then cut into 1-mm pieces. Fragments obtained were washed and incubated in the same buffer containing 0.5% trypsin for 30 min at 37 C in 95% O2 and 5% CO2. They were treated for 2 additional min with 50 μl deoxyribonuclease I (1 mg/ml; Worthington Biochemical Corp., Lakewood, NJ). Digestion was ended by adding 1 mg/ml lima bean trypsin inhibitor. Fragments were disassociated to single cells by gentle trituration through siliconized Pasteur pipettes. The resulting suspension was filtered through a nylon gauze (160 μm pore size) and centrifuged 10 min at 120 × g. Before centrifugation, an aliquot of cellular suspension was taken to quantify pituitary cell yield, using a Neubauer chamber. Viability of cells, determined by trypan blue exclusion, was always greater than 90%. Cells (50,000 cells/well) were cultured for 4 d. Cell culture was performed as previously described with minor modifications (16). Human GHRH-(1–29) amide (provided by the NIDDK’s National Hormone and Peptide Program and Dr. A. F. Parlow) was used.
RIAs
PRL and GH were measured by RIA using kits provided by the NIDDK. Assays were performed using 10 μl serum in duplicate. Results are expressed in terms of mouse PRL RP3, and mouse GH AFP-10783B. Intra- and interassay coefficients of variation were 7.2% and 12.8%, and 8.4% and 13.2%, respectively.
For IGF-I RIA serum samples (15 μl) and IGF-I standards were subjected to the acid-ethanol cryoprecipitation method as previously described (17). IGF-I was determined using antibody (UB2–495) provided by Drs. L. Underwood and J. J. Van Wyk, and distributed by the Hormone Distribution Program of the NIDDK. Recombinant human IGF-I (rh IGF-I, Chiron Corp., Emeryville, CA) was used as radioligand and unlabeled ligand. The assay sensitivity was 6 pg/tube. Intra- and interassay coefficients of variation were 8.2% and 14.1%, respectively.
IGFBP-3 was measured by a radioligand Western blot of serum proteins. Two microliters of each serum sample was loaded on nondenaturing, discontinuous PAGE gels (5% stacking, 10% separating). After electrophoresis, the proteins were electroblotted in a Tris-glycine buffer onto nitrocellulose membranes. Iodination of IGF-I and IGF-II to a specific activity of 350–500 μCi/μg was performed by a modification of the chloramine-T technique (18). The nitrocellulose membranes were incubated with 1 × 10⁶ cpm of each of the iodinated ligands overnight, washed, dried, and exposed to a PhosphorImager screen (Molecular Dynamics, Inc., Sunnyvale, CA) as described previously (19). The density of each band on the gels was quantified using IP Labgel H software (Molecular Dynamics, Inc.) and expressed in arbitrary units after subtracting background per lane.
Statistical analyses
Results are expressed as the mean ± se. Developmental patterns of body weight, GH, PRL, and IGF-I were analyzed by two-way ANOVA for the effects of age and genotype for each sex. GH datasets with different means were compared after calculating z-scores [z = (x − μ)/ς] for each data point. The z transformation permits an approximation of the probabilities for each x using the probabilities derived from a standard normal distribution (μ = 0; ς = 1). Body lengths, femur lengths, organ weights, and serum IGFBP-3 levels were analyzed by two-way ANOVA for the effects of sex and genotype. GH secretion in vitro was analyzed by two-way ANOVA for repeated measures for the effects of drug treatment and genotype. PRL and GH secretion in response to ether or dopamine antagonists were analyzed by two-way ANOVA for the effects of genotype and drug. In all cases if F of interaction was found significant, individual means were compared by Tukey’s honest significant difference or Fisher’s protected least significant difference tests, if it was not significant, groups of means were analyzed by the same tests. P < 0.05 was considered significant.
Results
Somatic growth from birth to 8 months of age in female and male wild-type and D2R knockout mice
In newborn and 2-wk-old mice body weight did not differ between genotypes [1 d old, mean ± se, 2.10 ± 0.12 g (n = 9) and 2.14 ± 0.09 g (n = 10) for wild-type female and male mice, and 2.25 ± 0.18 g (n = 10) and 2.01 ± 0.20 g (n = 11) for D2R−/− female and male mice]. On the other hand, there was a reduction in body weight in D2R−/− males from 1–8 months of age (15% average decrease) and in D2R−/− females during the first 2 months (Fig. 1). A two-factor ANOVA indicated that in females there was significant interaction between genotype and age [F(8,355) = 2.08; P = 0.050], and post hoc comparisons revealed that body weight was decreased only in 1- and 2-month-old knockout females. In males, body weights were significantly lower in D2R−/− compared with wild-type mice from 1–8 months [P = 0.00001]. Nearly identical growth data were obtained for two independent cohorts of N5 and N6 C57BL/6J incipient congenic wild-type and D2R−/− mice raised in the vivarium at Portland (Table 1). Results of heterozygous mice are not shown because they did not differ from those of wild-type mice.
![Upper panels, Body weight in female and male wild-type (+/+) and knockout (−/−) mice from birth to 8 months of age (n = 20–28 animals/group). For this and the following three figures, the line represents the average, and lines on top indicate 1 se. *, P < 0.05 vs. knockout sex- and age-matched mice. Lower panels, Ontogenic body weight increase [grams per month; for example, at 0.5 months: (BW at 0.5 − BW at 0)/period elapsed (0.5 mo)].](https://oup.silverchair-cdn.com/oup/backfile/Content_public/Journal/endo/143/4/10.1210_endo.143.4.8750/1/m_ee0428750001.jpeg?Expires=1750871748&Signature=L5d4tmHUL2HwdeHIsuJEYdjYlMQjKYFoYAxNFRKv45MI2Cj~tbQvPYgw6CeLRKdCxDmxb4c7ToSEzIDZaIkHgdMOnCmJFkCBAyJ2OYt2dMPX4Vp-d6RzEvS0pVEjD9GwPm2NMlN5kWGXK9ptHVYgF7MQVycXdFhpCYj-Bi0zH4IKHlei3~gGWAj4yKiCbcQOwv1Z9Q6rPUdPguxmgTGUcEf2DRtymHDVboOcMlQOkDsNmTWbbPNsHxxicDoFHX~QYbyuUKew2ET24Vfy2A~-u8rFit5PjH~rWyG3uEBs8s1DP2GogPHZ95sCGcyNmxZ3IVHA-MiDR12XX0hZhsbmxw__&Key-Pair-Id=APKAIE5G5CRDK6RD3PGA)
Upper panels, Body weight in female and male wild-type (+/+) and knockout (−/−) mice from birth to 8 months of age (n = 20–28 animals/group). For this and the following three figures, the line represents the average, and lines on top indicate 1 se. *, P < 0.05 vs. knockout sex- and age-matched mice. Lower panels, Ontogenic body weight increase [grams per month; for example, at 0.5 months: (BW at 0.5 − BW at 0)/period elapsed (0.5 mo)].
Indices of somatic growth in wild-type and D2R−/− mice at the indicated ages
| Wild-type (WT) males (n) | Knockout (KO) males (n) | WT females (n) | KO females (n) | |
|---|---|---|---|---|
| Body weight (g) 1 d | 1.66 ± 0.04 (6) | 1.56 ± 0.07 (6) | ||
| Body weight (g) 13 wkb | 30.0 ± 0.7 (14) | 25.4 ± 0.6a (24) | 22.3 ± 0.9 (9) | 22.8 ± 0.9 (15) |
| Food intake (g/d) 13–14 wk | 4.59 ± 0.23 (13) | 4.67 ± 0.33 (12) | ||
| Relative food intake (g/d/g BW) | 0.151 ± 0.010 (13) | 0.198 ± 0.014c (12) | ||
| Body length (cm) 13 wkb | 9.9 ± 0.08 (14) | 9.4 ± 0.05a (24) | 9.5 ± 0.06 (9) | 9.4 ± 0.1 (15) |
| Femur length (mm) 15 wkd | 14.2 ± 0.1 (17) | 13.1 ± 0.3a (8) | 13.4 ± 0.2 (15) | 13.3 ± 0.3 (10) |
| Liver (g) 15 wkb | 1.61 ± 0.08 (17) | 1.04 ± 0.05a (8) | 1.18 ± 0.05 (15) | 1.17 ± 0.08 (10) |
| Inguinal fat (g) 15 wkc | 1.88 ± 0.11 (17) | 1.25 ± 0.07a (8) | 0.91 ± 0.15 (15) | 1.03 ± 0.21 (10) |
| Kidney (mg) 15 wke | 398 ± 11 (17) | 394 ± 24 (8) | 285 ± 7 (15) | 285 ± 13 (10) |
| Spleen (mg) 15 wkf | 93 ± 4 (17) | 74 ± 4 (8) | 91 ± 4 (15) | 76 ± 4 (10) |
| IGFBP-3 arbitrary units 6 wkgh | 110 ± 12 (5) | 73 ± 10 (7) | 80 ± 13 (7) | 58 ± 9 (7) |
All data are expressed as mean ± sem.
One-factor ANOVA, main effect of genotype for males, P < 0.001.
Two-factor ANOVA, genotype × sex interaction, P ≤ 0.001.
One-factor ANOVA, main effect of genotype, P < 0.008.
Two-factor ANOVA, genotype × sex interaction, P < 0.05.
Two-factor ANOVA, main effect of sex, P < 0.0001.
Two-factor ANOVA, main effect of genotype, P < 0.0005.
Two-factor ANOVA, main effect of genotype, P = 0.01.
Two-factor ANOVA, main effect of sex, P = 0.05.
When body growth gain was determined, it became evident that in D2R−/− male and female mice maximal growth retardation, compared with that in wild-type mice, occurred during the first half of the second month of life, and thereafter animals grew normally (Fig. 1, lower panels).
Body length measured from nose to anus in a cohort of 15-wk-old mice recapitulated the sexually dimorphic pattern demonstrated for body weight. Similarly, the rate of skeletal maturation (as indexed by femur length) was decreased significantly only in male D2R−/− compared with male wild-type mice (Table 1). There were no differences in 24-h food intake in male mice between genotypes. In fact, when normalized to the body weights there was actually a highly significant increase in food intake per g BW in male D2R−/− mice. Weights of liver and inguinal/gonadal fat pads were significantly reduced only in male D2R−/− compared with male wild-type mice, whereas spleen weights were reduced in both sexes of D2R−/− mice. In contrast, kidney weights were significantly smaller in females compared with males, but were not affected by genotype (Table 1).
Development of serum levels of PRL, GH, and IGF-I
From 1–7 months of age serum PRL did not vary significantly in female and male wild-type mice. In both sexes interaction between genotype and age was significant [for females: F(6,127) = 8.48; P = 0.00001; for males: F(6,118) = 6.65; P = 0.00001], and post hoc tests revealed a significant PRL increase in knockout mice from 3 months of age onward in females and from 2 months onward in males (Fig. 2). Beginning in the third month, PRL levels were higher in female than in male knockout mice.
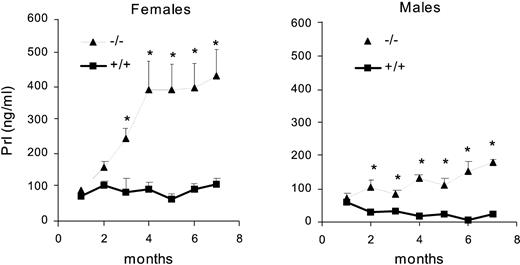
Serum PRL concentration (nanograms per milliliter) in female and male wild-type (+/+) and knockout (−/−) mice from 1–7 months of age (n = 14–20 animals/group). *, P < 0.05 vs. wild-type sex- and age-matched mice.
In wild-type male and female mice, the average GH concentration was high in the first month of age and decreased during the second month to remain at low levels thereafter (Fig. 3). Highest levels were encountered during the first week of life (data not shown). In both sexes interaction between genotype and age was significant [for females: F(6,124) = 2.22; P = 0.046; for males: F(6,97) = 2.21; P = 0.049], and post hoc tests revealed that GH was significantly higher in wild-type mice in both sexes at 1 and 2 months of age.
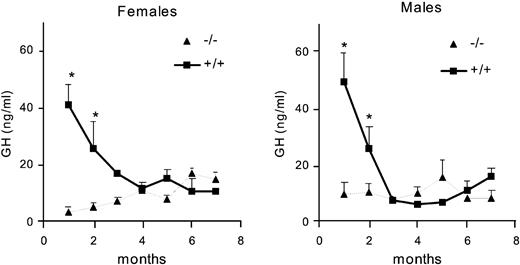
Serum GH concentration (nanograms per milliliter) in female and male wild-type (+/+) and knockout (−/−) mice from 1–7 months of age (n = 18–36 animals/group). *, P < 0.05 vs. knockout sex- and age-matched mice.
To assess GH variability as a result of the pulsatility of GH secretion we performed z transformations of our GH datasets. The z transformation approximates a normal distribution for a dataset and then calculates a z-score for each data point that is equivalent to the number of normalized sds relative to the group mean. The z-score histograms for 1-month-old wild-type mice of both sexes were skewed to the left (median < mean), and there was a tail to the right between +2 and +3 sds representing the peak values of pulses (Fig. 4). These wild-type graphs are similar to those we previously published from other populations of adult wild-type mice (20). In contrast, the z-score histograms of the 1-month-old D2R knockout mice more closely approximated the calculated normal distribution (median = mean), suggesting that GH secretion is more random in these mice. Similar results were observed in 2-month-old mice (not shown).
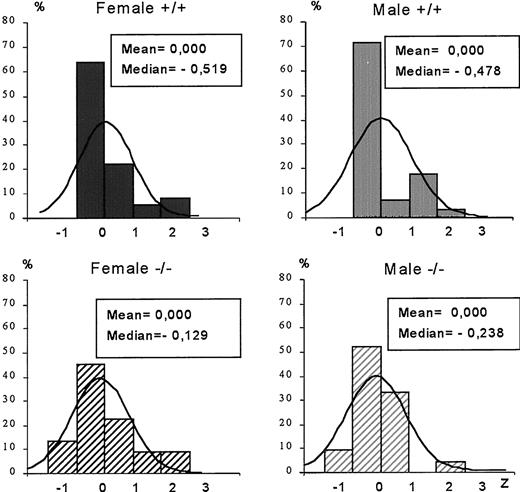
The z-score histograms of GH values of 1-month-old female and male mice of both genotypes in datasets obtained from randomly timed blood sampling. The z-scores are grouped into bin sizes equal to 1 sd of the normalized mean for each group. The bell curve in each panel illustrates the probability of the standard normal distribution in comparison to the z-scores calculated from the experimental data. n = 36, 22, 28, and 21 for +/+ and −/− females, and +/+ and −/− males, respectively.
Serum IGF-I increased gradually from birth to 4 months of age in wild-type and knockout female and male mice. A two-factor ANOVA indicated that IGF-I levels were significantly lower in D2R−/− compared with wild-type female [F(1,201) = 8.51; P = 0.039] and male [F(1,156) = 7.18; P = 0.0082] mice. There was no significant interaction between genotype and age [females: F(1,201) = 0.41; P = 0.80; males: F(1,156) = 0.16; P = 0.95; Fig. 5].
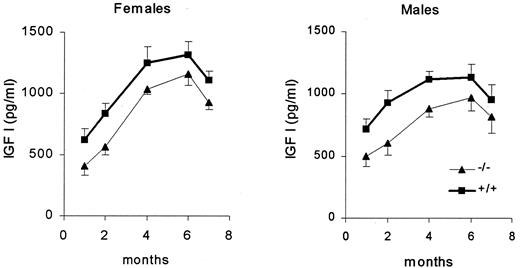
Serum IGF-I concentration (picograms per milliliter) were higher in female and male wild-type (+/+) than in knockout (−/−) gender-matched mice at 1, 2, 4, 6, and 7 months of age (n = 14–20 animals/group).
IGFBP-3
Serum IGFBP-3 was measured in a cohort of 6-wk-old wild-type and knockout mice (Table 1). A two-factor ANOVA indicated that IGFBP-3 levels were significantly lower in D2R−/− compared with wild-type mice [F(1,22) = 7.2; P = 0.01], and levels in female mice were significantly lower than those in male mice at this age [F(1,22) = 4.2; P = 0.05]. There was no significant interaction between genotype and sex [F(1,22) = 0.5; P = 0.51].
Effect of ether stress on serum GH and PRL
Because the developmental profiles of GH and PRL were obtained from samples taken under ether anesthesia, we determined the effect of ether on hormone levels in adult mice. To this end, samples were obtained by decapitation (stress free) or by orbital puncture under ether anesthesia (1-min exposure to ether fumes). In female mice, ether significantly decreased serum GH [F(1,87) = 16.35; P = 0.00011], and no differences were observed between genotypes [there was no significant interaction between genotype and treatment: F(1,87) = 0.43; P = 0.51]. In male mice ether did not modify GH levels [F(1,72) = 0.23; P = 0.63], and once again no differences were found between genotypes [interaction between genotype and treatment: F(1,72) = 0.042; P = 0.84; Fig. 6].
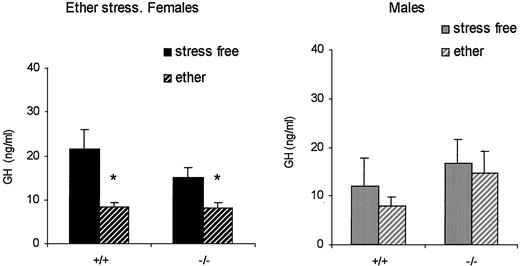
Effect of ether stress on the serum GH concentration in female (left panel) and male (right panel) wild-type (+/+) and knockout (−/−) mice (4–6 months old; n = 21, 23, 25, and 22 for females, and 20, 17, 19, and 20 for males). *, P < 0.05 vs. stress-free, sex- and genotype-matched animals.
In contrast, ether exposure significantly increased PRL levels in female and male mice of both genotypes (Fig. 7). These results emphasize the importance of PRL-releasing factors on the impact of ether-induced stress on PRL levels.
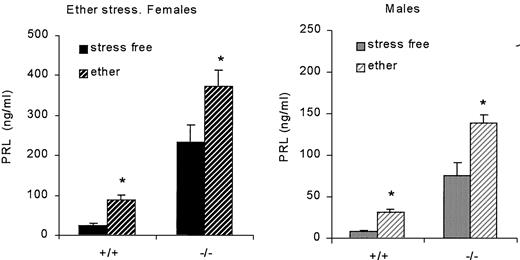
Effect of ether stress on serum PRL concentration in female (left panel) and male (right panel) wild-type (+/+) and knockout (−/−) mice (4–6 months old; n = 21, 27, 28, and 23 for females, and 18, 19, 17, and 16 for males). *, P < 0.05 vs. stress-free, sex- and genotype-matched animals.
GH release from pituitary cells cultured in vitro
When anterior pituitary cells from 20-d-old mice were cultured in vitro, we found no differences in basal GH release (expressed as nanograms per well containing 50,000 cells or micrograms per pituitary; Table 2). In 8-month-old mice basal GH release (nanograms per well) was lower in cells from female and male knockout mice than in cells obtained from gender-matched wild-type animals (Table 2). When we calculated total GH output (micrograms per pituitary), therefore considering pituitary hypertrophy in female knockouts, we found that total GH release was still lower in both female and male knockout mice compared with sex-matched wild-type animals. Different basal GH release in vitro was somehow compensated in vivo, as no differences in circulating GH levels were encountered in female or male wild-type and knockout mice after 2 months of age (see Fig. 3).
Basal GH release from pituitary cells incubated in vitro
| N cells/pituitarya | Nanograms GH/well | Micrograms GH/pituitary | ||
|---|---|---|---|---|
| Female 20 d | +/+ | 354,667 | 713 ± 70 | 6.70 ± 0.55 |
| −/− | 359,333 | 699 ± 44 | 6.99 ± 0.63 | |
| Male 20 d | +/+ | 342,000 | 834 ± 61 | 7.61 ± 0.55 |
| −/− | 301,339 | 1,046 ± 73 | 8.33 ± 0.31 | |
| Female 8 months | +/+ | 785,595 | 503 ± 33cd | 7.86 ± 0.72 |
| −/− | 1,747,583b | 156 ± 7cd | 5.37 ± 0.29e | |
| Male 8 months | +/+ | 601,774 | 746 ± 45cd | 8.96 ± 0.50 |
| −/− | 652,580 | 418 ± 4cd | 5.76 ± 0.60e |
N = three experiments in 20-d-old mice. N = four experiments in 8-month-old mice. In 20-d-old mice, no differences were found.
In 8-month-old mice:
Two-factor ANOVA, interaction sex × genotype, P = 0.0016.
P < 0.0005 vs. all age-matched groups.
Two-factor ANOVA (sex × genotype), main effect of sex, P = 0.000046.
Two-factor ANOVA, main effect of genotype, P = 0.00002.
Two-factor ANOVA, main effect of genotype, P = 0.00096.
In cells from 8-month-old mice GHRH released GH in all groups at concentrations of 1 × 10⁻⁷ and 1 × 10⁻⁹m (Fig. 8). However, absolute GH release induced by GHRH was significantly lower in knockout mice compared with wild-type sex-matched mice. At the concentration of 1 × 10⁻¹⁰m, a significant response was observed only in wild-type males.
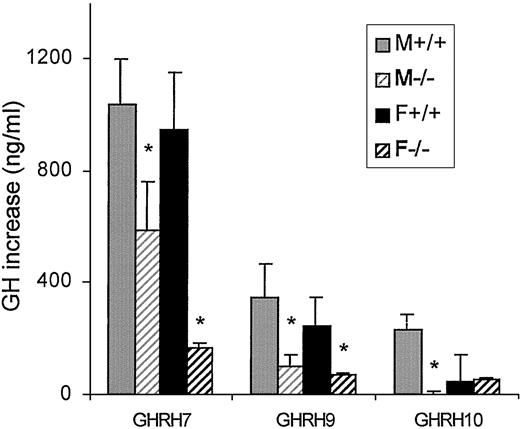
Effect of GHRH on GH increase (nanograms per milliliter release over basal levels in cultured pituitary cells from male and female adult mice of both genotypes). GHRH7, 1 × 10⁻⁷m GHRH. *, P < 0.05 vs. sex-, genotype-, and concentration-matched cells.
Effects of D1 and D2 antagonists on serum GH
Because differences in circulating GH were observed during the first 2 months of age, we tested the effect of dopamine antagonists during this period. To evaluate whether D2Rs were involved in high GH levels in wild-type mice, we administered a D2R antagonist, sulpiride (5 mg/kg BW). In the first 6 d of life, serum GH levels were very high and were not modified by the antagonist in either sex (not shown). In 2- to 4-wk-old female and male mice, sulpiride significantly decreased serum GH [F(2,47) = 9.35; P = 0.0038; Fig. 9, left panel]. This effect was no longer evident in mice during the second month of life (data not shown).
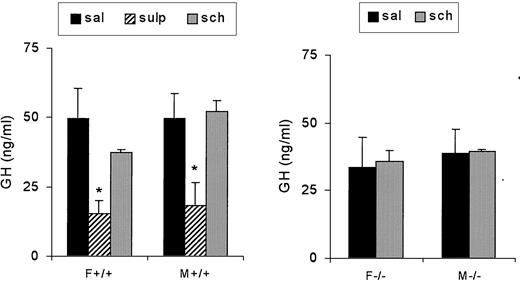
Effect of 5 mg/kg sulpiride (sulp) or 0,1 mg/kg SCH 23390-HCl (sch) on serum GH (nanograms per milliliter) in female (F) and male (M) wild-type (left panel) or knockout (right panel) 1-month-old mice (n = 10, 10, and 7 for wild-type females; 10, 9, and 7 for wild-type males; 7 and 7 for knockout females; and 7 and 6 for knockout males). *, P < 0.05 vs. saline (sal)-injected sex- and genotype-matched mice.
We next tested the effect of a D1 antagonist, SCH 23390 (0.1 mg/kg), in female and male knockout mice. The drug did not modify GH in either wild-type or knockout mice (Fig. 9).
Discussion
In the present experiments we show that lack of D2Rs during the neonatal period impairs body growth and alters the GH-IGF-I axis. We describe that body weight at birth was similar in wild-type and knockout mice, but during the first 2 months of age male and female knockout mice had lower body weights than their sex-matched littermates. In male mice differences in body weight were maintained for at least 8 months (last age point measured) and were accompanied by a significant decrease in the rate of skeletal maturation, as indexed by femur length. The weight of the liver and white adipose tissue was also decreased in male knockout mice. On the other hand, food intake was not lower in knockout male mice, suggesting that knockout mice were not starving due to an effect of D2R mutations on appetite or food consumption. These results suggest that the D2R is involved, albeit indirectly, in body growth. Supporting the possible clinical importance of the D2R in the hypothalamus-pituitary IGF-I axis, it has been shown that polymorphism of the D2R gene may be one genetic factor that affects body height in childhood (21).
On the other hand, in female knockout mice there was a catch-up in body weight from the third month of life onward. This event coincided with the increase in serum PRL to very high levels (significantly higher than those in male knockout mice). It has been shown that PRL stimulates food intake and fat deposition in female rats (22, 23), and that PRL receptor-deficient mice have a progressive reduction in body weight, with females affected to a greater degree than males (24). It is therefore plausible that the increasing PRL concentration in females is mechanistically related to the catch-up in body weight observed in these D2R−/− mice, although it may not be the only factor.
Mean serum GH levels in wild-type male and female mice were high during the first month of life and decreased to adult levels by 3 months of age. The distribution profile of these random GH measurements between 1 and 2 months of age revealed a high variability, probably reflecting an exaggerated pulsatility compared with adult values (1). Numerous randomly obtained GH levels ranged as high as 150 ng/ml in both male and female wild-type mice, whereas none of the levels in age-matched D2R−/− mice were greater than 40 ng/ml. Ontogenic levels were in accordance with data from the literature (25–27). Differences in pituitary responsiveness to GHRH may contribute to the elevated serum GH titers characteristic of the perinatal period and the subsequent decline in circulating GH. It has been reported that the stimulatory effects of GHRH on GH secretion in vitro are inversely related to age (28). On the other hand, maturational changes in the somatotrope responsiveness to somatostatin and somatostatin gene expression may also be related to the developmental pattern of serum GH. A variety of experimental approaches suggests that the developmental increase in somatostatin secretion (29) plays a role in reducing GH secretion over the neonatal period, and a clear inverse correlation exists between hypothalamic somatostatin content and GH concentration. Furthermore, pituitaries from newborn rats are relatively resistant to the GH-suppressive effect of somatostatin, whereas sensitivity increases with age (28, 30).
In knockout female and male mice GH levels were not increased during the first and second months of age. Only low levels of GH were found, indicating that the maximum amplitude of GH pulses was altered. Analysis of z-scores of GH datasets of 1-month-old knockout mice also pointed to an altered pulsatility, even though the z-transformed datasets do not have sufficient statistical power to conclude whether the frequency of GH pulses is altered in D2R−/− mice. These results indicate that the D2R is necessary for GH release, at least during the first month of life. It has been reported that dopamine can stimulate the release of both GHRH and somatostatin (2), but dopamine preferentially increases GHRH and GH when the influence of endogenous somatostatin is attenuated, either by continuous perifusion with a somatostatin antiserum (2) or by anterolateral deafferentation of the mediobasal hypothalamus (8). As noted above, during the neonatal period there is an attenuated somatostatin system, which probably unmasks a net stimulatory effect of the D2R on GH secretion. As the hypothalamic-pituitary axis matures, the increasing somatostatin activity probably overrides the effect of the D2R. This is the first evidence indicating that the D2R is involved in GH release in the first month of life. This assertion is further supported by the acute GH-lowering effect of a dopamine antagonist (sulpiride, specific for the D2R) in wild-type mice. The effect of sulpiride was lost as the animal matured, emphasizing the importance of a low somatostatin tone to permit the unfettered stimulatory effect of dopamine on GH.
It is well documented that GH exerts many of its actions by incrementing gene expression of hepatic IGF-I. IGF-I has a long half-life because it is largely bound to a variety of binding proteins, which modulate its activity by limiting its access to specific tissues and receptors. IGFBP-3 binds more than 95% of circulating IGF-I and IGF-II (1). In male and female wild-type and knockout mice the IGF-I concentration increased with age, but levels were significantly lower in knockout sex-matched mice. IGFBP-3 levels were also lower in both sexes of knockout mice at the 6-wk point, corresponding to decreased GH and IGF-I levels. This pattern is reminiscent of results described in normal and Snell dwarf mice (31), in which IGF-I increased with age in both genotypes, and lower body weight in the mutant mice was accompanied by lower serum IGF-I and IGFBP-3 levels.
Acute ether stress increases serum PRL and decreases GH secretion (32). This last effect is proposed to occur via stress-induced hypothalamic CRH stimulation of somatostatin release into portal blood (33, 34). In our experiments ether stress produced GH suppression only in female mice, with no differences apparent between genotypes. The greater effect observed in females may be related to circulating estrogen levels, as E2 induces GH sensitivity to somatostatin by up-regulation of discrete somatostatin receptor subtypes (35, 36). Our results indicate that the D2R is not required for ether stress-induced GH suppression, and furthermore, that ether-induced PRL release is partially independent of the dopamine tone.
Altered GH regulation during the neonatal period in D2R-deficient mice also had a long-lasting effect on the somatotrope population in adult mice. Even though basal GH secretion from pituitary cells was similar in wild-type and knockout mice at 20 d of age, in 8-month-old male and female knockout mice basal and GHRH-induced GH release were decreased, indicating either a lower pool of releasable GH, a decreased sensitivity to GHRH, and/or a lower percentage of somatotropes. In support of the latter possibility, a 25% decrease in the number of GH-expressing cells was described in another model of D2R-deficient mice (37). Nevertheless, we did not find any difference in serum GH at this age, although more intensive monitoring of GH levels from cannulated animals would be necessary to detect subtle differences in pulse frequency or amplitude. Similar results were found in a model of neonatal GHRH deficiency induced by fetal treatment with GHRH antibody; in the treated rats the absolute pituitary GH content and GH mRNA levels were lower, although the serum GH concentration was similar to that in control rats (38). The fact that IGF-I concentrations remained lower in D2R−/− compared with wild-type mice, even at times when GH secretion and growth rate were not obviously impaired, suggests the existence of chronic changes in feedback sensitivity and end-organ responses to IGF-I.
The requirement of neonatal GHRH for the normal development of the somatotrope lineage is further evident from studies examining the etiology of growth retardation in the spontaneous mutant mouse lit/lit with an inactivating point mutation in the GHRH receptor (38). Reduced levels of GHRH within the hypothalamus or GHRH action in the pituitary at a critical developmental time point have a long-lasting impact on body weight (38–40) and induce an inadequate clonal expansion of the somatotrope population. In this respect, it has been shown that GHRH plays a major stimulatory role in the regulation of the Pit-1 mRNA concentration (1), a pituitary-specific transcription factor that is involved in the developmental generation of somatotropes (also thyrotropes and lactotropes) and in the direct regulation of GHRH receptor mRNA and the GH gene. Altered GHRH release might lead to the reduction of functional Pit-1, particularly in somatotropes and not in other cell types (41, 42), and subsequently to a decreased proportion of somatotropes in adults, as observed in D2R knockout mice. Therefore, a low GH content in adult D2R knockout mice could be explained by inadequate GHRH release during the perinatal period.
Our results indicate that the lack of D2R alters the GHRH-GH-IGF-I axis, and impairs body growth and the somatotrope population in the adult mice. An anatomical basis for an interaction of the dopaminergic and GHRH system has been provided by colocalization studies in the rat, which indicate that a subset of GHRH neurons in the ventrolateral part of the arcuate nucleus contains tyrosine hydroxylase, the key enzyme of catecholamine biosynthesis (43, 44). Furthermore, it has been shown that catecholamine-containing neurons innervate GHRH neurons in the rat arcuate nucleus (45).
In children, idiopathic short stature has been associated with high frequencies of the A1 allele of the D2R, indicating a polymorphism of the receptor. In idiopathic short stature there is mild GH deficiency, decreased nocturnal GH secretion, lower GH response to the l-DOPA test, slightly retarded bone maturation, and low blood levels of IGF-I (21). The alterations in the dopaminergic system encountered are a low binding capacity for dopamine and reduced dopaminergic function. The results presented herein using the D2R-deficient mouse also support involvement of the D2R in growth regulation.
Acknowledgments
We thank NIDDK’s National Hormone and Pituitary Program and Dr. A. F. Parlow for GH and PRL RIA kits, IGF-I antiserum, and human GHRH-(1–29) amide, and V. Hwa for assistance with the IGFBP-3 Western ligand blots.
This work was supported by grants from Consejo Nacional de Investigaciones Científicas y Técnicas and Agencia Nacional de Promoción Científica y Técnica, Buenos Aires, Argentina (to D.B.V., C.L., and M.R.); the International Program of the Howard Hughes Medical Institute (to M.R.); CEDIQUIFA, Buenos Aires (to C.F.); and National Science Foundation Grant INT-9901278 and NIH Grant DK-55819 (to M.J.L.).
Abbreviations:
References
van
