


Abstract
Benign adrenocortical tumours are diagnosed in ∼5% of adults and are associated with cortisol excess in 30%-50% of cases. Adrenal Cushing's syndrome (CS) is rare and leads to multiple haematological alterations. However, little is known about the effects of the much more frequent mild autonomous cortisol secretion (MACS) on immune function. The aim of this study was to evaluate the haematological alterations in benign adrenocortical tumours with different degrees of cortisol excess.
We investigated 375 patients: 215 with non-functioning adrenal tumours (NFAT), 138 with MACS, and 22 with CS. We evaluated the relationship between the degree of cortisol excess and full blood count as well as multiple inflammation-based scores, including the neutrophil-to-lymphocyte ratio (NLR), the lymphocyte-to-monocyte ratio (LMR), and the systemic immune-inflammation index (SII).
We observed a gradual and significant increase of leucocytes, neutrophils, and monocytes across the spectrum of cortisol excess, from NFAT over MACS to CS. Neutrophil-to-lymphocyte ratio and SII were significantly higher in both MACS and CS when compared to NFAT (P < .001 and P = .002 for NLR and P = .006 and P = .021 for SII, respectively). Conversely, LMR was lower in MACS and CS than in NFAT (P = .01 and <.001, respectively) but also significantly lower in CS compared to MACS (P = .007).
Neutrophil-to-lymphocyte ratio, SII, and LMR correlated with the degree of cortisol excess in benign adrenocortical tumours and were altered in patients with CS and MACS. These findings suggest that, similar to clinically overt CS, MACS also affects the immune function, potentially contributing to the MACS-associated comorbidities.
Our study showed that patients with overt cortisol-producing adenomas and mild autonomous cortisol secretion (MACS) present with more alterations in multiple serum inflammation-based scores than patients with non-functioning adrenal tumours. In particular, the levels of leucocytes, neutrophils, and monocytes as well as the derived inflammation-based scores showed a correlation with the degree of cortisol excess, regardless of the presence of clinical signs of Cushing's syndrome. Our findings suggest that a mild excess of cortisol can adversely affect the levels and relationship of circulating immune cells. Similarly to overt hypercortisolism, MACS disrupts the immune system function, potentially contributing to the comorbidities observed even in the absence of overt Cushing's syndrome. Our findings may offer valuable insights for informed decision-making in patients with MACS, but further longitudinal studies are required.
Introduction
Adrenal masses are incidentally discovered in ∼5% of cross-sectional imaging studies.1,2 Benign adrenocortical adenomas are the most represented entity, accounting for up to 90% of cases.3 Non–aldosterone-secreting adrenocortical adenomas can be either non-functioning adrenal tumours (NFAT) or associated with autonomous cortisol excess.4 Clinically overt cortisol excess (Cushing's syndrome [CS]) represents <5% of adrenocortical adenomas and is characterised by typical signs and symptoms (eg, easy bruising, purple striae, proximal myopathy, and facial plethora) and significant cardiovascular and metabolic morbidity.4 In contrast, cortisol-producing adenomas (CPAs) with mild autonomous cortisol secretion (MACS)—defined by the failure to suppress cortisol sufficiently during the 1 mg overnight dexamethasone suppression test (1 mg DST) in the absence of classical features of CS5—account for up to 45% of adrenocortical adenomas cases.4 Recent large-scale studies have shown that patients with CPA-MACS carry a high cardiometabolic burden including hypertension, type 2 diabetes, dyslipidaemia, and osteoporosis and are at increased risk of cardiovascular events and mortality.4,6,7
Inflammation and immune system function are modulated by cortisol. In CS, there is a combination of low-grade inflammation and a selectively impaired immune response that are postulated to play a role in the pathogenesis of CS-related comorbidities, including diabetes, visceral adiposity, atherosclerosis, osteoporosis, and cognitive impairment.8 Moreover, multiple alterations of haematological parameters, such as leucocytosis, lymphopaenia, and eosinopaenia, are observed in CS, which contribute to increased susceptibility to infections in these patients.8 It has also been shown that changes induced by cortisol excess in the full blood count (FBC) correlate with the severity of CS and improve after the resolution of hypercortisolaemia.9–11
Serum inflammation-based scores reflect systemic inflammation and predict outcomes in several diseases, like myocardial infarction, ischaemic stroke, and various solid tumours.12–14 In particular, the neutrophil-to-lymphocyte ratio (NLR) is a surrogate marker of cellular immune activation and is widely used as a consistent and readily available marker of immune response to various infectious and non-infectious stimuli.15 Previous studies have demonstrated higher levels of NLR in CS compared to controls.11,16 Higher NLR values have been reported in 185 patients with CPA-CS compared to 185 patients with NFAT.17 Neutrophil-to-lymphocyte ratio and other inflammation-based scores, eg, platelet-to-lymphocyte ratio (PLR), systemic immune-inflammation index (SII, a composite indicator integrating platelet, neutrophil, and lymphocyte counts), and lymphocyte-to-monocyte ratio (LMR) have been found to be different in malignant CS (adrenocortical carcinoma or ectopic secretion of adrenocorticotropin hormone [ACTH]) compared to CS caused by a benign pituitary or adrenal tumour, reflecting a higher grade of inflammation.10,18
Little is known about the impact of different degrees of cortisol excess on haematological alterations and inflammation-based scores, used as surrogates of systemic inflammation. The aim of this study was to evaluate multiple inflammation-based scores in patients with non-aldosterone-producing adrenocortical adenomas and their relationship with the degree of cortisol excess, with a particular focus on CPA-MACS.
Methods
Patient cohort
This was a retrospective study on patients with newly diagnosed adrenal masses referred and followed up in the Adrenal Tumour Service at the Queen Elizabeth Hospital Birmingham (Birmingham, United Kingdom). We screened 1080 patients referred to our centre between January 2005 and September 2022. Inclusion criteria were diagnosis of non–aldosterone-secreting adrenocortical adenomas, age ≥ 18 years, available FBC results at the time of adrenal tumour diagnosis and before any active intervention (either adrenalectomy or cortisol-lowering medications), available 1 mg DST results and clinical assessment for CS signs and symptoms at the time of diagnosis, and radiological characteristics of the adrenal mass. Adrenocortical adenomas were diagnosed based on benign radiological characteristics according to current guidelines.5 When bilateral adenomas were found, the diameter of the largest adenoma was reported. Patients with adrenal masses other than non–aldosterone-secreting adrenocortical adenomas, ie, phaeochromocytoma, aldosterone-producing adenomas, other non-cortical adrenal masses, and adrenocortical carcinoma were excluded. Patients with conditions that could significantly affect FBC values at the time of blood testing, such as known infections, haematological diseases, severe cardiomyopathy, active malignancy, active autoimmune diseases, or treatment with oral glucocorticoids or other immunomodulatory drugs, were also excluded. A flowchart for patient inclusion is shown in Figure S1.
The definition of adrenal hormone excess was in accordance with the European guidelines on the management of patients with newly diagnosed adrenal masses.5 The CPA-CS was defined by the presence of clinical features of CS, suppressed plasma ACTH levels, and more than one positive screening test for hypercortisolism (late-night salivary cortisol, 1 mg DST, and 24-h urine-free cortisol). The CPA-MACS was defined by the failure to suppress cortisol after the 1 mg DST in the absence of overt clinical features of CS. Moreover, patients were further sub-classified as possible MACS (CPA-MACS-1), if cortisol level after the 1 mg DST was between 50 and 138 nmol/L, and as definitive MACS (CPA-MACS-2), if cortisol level was above 138 nmol/L. Adrenocortical adenomas with normal 1 mg DST results were classified as NFAT.
This study has been conducted in accordance with the Declaration of Helsinki. Institutional review board approval for retrospective data review from patients undergoing routine clinical care was obtained from the University Hospital Birmingham NHS Foundation Trust (reference CARMS-18109).
Data collection
We collected clinical, radiological, and laboratory data by reviewing the electronic medical records. All patients underwent an assessment at the time of referral, which included the following: demographics; past medical history, including the presence of comorbidities potentially related to cortisol excess such as hypertension and type 2 diabetes (clinical outcomes defined as per Prete et al.4); comprehensive laboratory workup (including FBC, albumin, plasma metanephrines, plasma renin and aldosterone, cortisol after the 1 mg DST, plasma ACTH, and serum dehydroepiandrosterone sulphate [DHEAS] levels); and radiological characteristics of the adrenal mass (side, maximum diameter, and tumour density expressed as Hounsfield units during non–contrast-enhanced computed tomography).
Inflammation-based scores
Inflammation-based scores were calculated starting from FBC and serum albumin as follows (Table S1): NLR by dividing the absolute neutrophil count by the absolute lymphocyte count; PLR by dividing the absolute platelet count by the absolute lymphocyte count; SII by multiplying the absolute platelet count and NLR; LMR by dividing the absolute lymphocyte count by the absolute monocyte count; prognostic nutrition index (PNI) by the formula [albumin level (g/L) + (5 × total lymphocyte count)]; neutrophil-to-platelet score (NPS) giving a score of 0 if neutrophils ≤7.5 × 10⁹/L and platelets ≤ 400 × 109/L, a score of 1 if neutrophils > 7.5 × 10⁹/L or platelets > 400 × 109/L, or a score of 2 if neutrophils > 7.5 × 10⁹/L and platelets > 400 × 109/L.12,19,20
Statistical analysis
Continuous data are shown as median and interquartile range. Categorical variables are expressed as numbers and percentages. The comparison of non-parametric continuous data was performed by using the Mann–Whitney test or Kruskal–Wallis test followed by Dunn's post hoc test. The categorical variables were compared by χ2 test or Fisher’s test, as appropriate. The relationship between continuous variables was determined by linear regression (Pearson's correlation coefficient if the 2 variables were normally distributed or Spearman's correlation coefficient for not normally distributed variables). For the FBC parameters and inflammation-based scores that were found to be different between MACS and NFAT, the receiver operating characteristic (ROC) curves were performed to establish optimal cut-off values and their associated sensitivities, specificities, and areas under the curve (AUC) for distinguishing MACS from NFAT. The Youden index (J = sensitivity + specificity − 1) was used to identify the most appropriate cut-off. P values of less than .05 were considered statistically significant. Quade’s non-parametric analysis of covariance has been used to adjust for variables (age and body mass index [BMI]) that could influence the relationship between FBC values, inflammation-based scores, and cortisol secretion parameters. General linear modelling has been used to adjust for potential confounders (ie, diabetes) in assessing the differences in NLR values between patients with NFAT, CPA-MACS, and CPA-CS.
Statistical analysis was performed by SPSS version 28.0 statistical package (IBM Corporation), JMP (JMP® Pro, Version 16. SAS Institute Inc., Cary, NC, 1989-2021), and GraphPad Prism version 9 (GraphPad Software).
Results
Characteristics of the study cohort
A total of 375 patients were included: 215 with NFAT (59.1%), 138 with CPA-MACS (35.3%), and 22 with CPA-CS (5.6%).
The demographic, hormonal, and radiological data are detailed in Table 1. The 3 groups differed in terms of age, BMI, and adrenal tumour maximum diameter and laterality. Most patients were women with a higher predominance in CPA-CS. As expected, we observed significant differences in 1 mg DST, ACTH, and DHEAS results, which correlated with the degree of cortisol excess. Patients with CPA had a higher prevalence of hypertension whilst the prevalence of type 2 diabetes was similar across the groups.
Demographic parameters, hormonal, and radiological data of patients with non–aldosterone-producing adrenocortical adenomas.
| Total (n = 375) | NFAT (n = 215) | CPA-MACS (n = 138) | CPA-CS (n = 22) | P value (Kruskal–Wallis) | P value (group comparison) | |
|---|---|---|---|---|---|---|
| Demographics | ||||||
| Age, years (IQR) | 61 (52-70) | 59 (51-68) | 66 (57.75-74) | 46 (30.75-59.25) | <.001 | <.001a .001b <.001c |
| Women, n (%) | 223 (59.5) | 128 (59.5) | 78 (56.5) | 17 (77.3) | .183 | |
| BMI, kg/m2 (IQR) | 29.2 (25.1-33.4) | 29.6 (25.5-34.4) | 28.3 (23.8-32.5) | 30.2 (27.1-37.4) | .020 | .039a 1.000b .141c |
| NAPACA-related comorbidities | ||||||
| Hypertension, n (%) Unknown | 193 (54.2) n = 19 | 91 (44.2) n = 9 | 89 (68.5) n = 8 | 13 (65.0) n = 2 | <.001 | |
| Diabetes, n (%) Unknown | 91 (25.7) n = 17 | 47 (22.8) n = 9 | 39 (29.6) n = 6 | 6 (30.0) n = 2 | .349 | |
| Hormone results | ||||||
| Cortisol after 1 mg DST, nmol/L (IQR) | 45 (30-84) | 32 (28-39) | 86 (65.5-127) | 408 (285-578) | <.001 | <.001a <.001b .009c |
| ACTH, ng/L (IQR) Unknown | 12.1 (6.3-20) n = 41 | 15.7 (10.1-23.6) n = 22 | 7.5 (5.0-14.1) n = 19 | 5.0 (5.0-5.4) | <.001 | <.001a <.001b .010c |
| DHEAS, μmol/L (IQR) Unknown | 1.81 (0.8-3.2) n = 11 | 2.43 (1.13-4.16) n = 10 | 1.14 (0.59-2.36) n = 1 | 0.65 (0.35-0.95) | <.001 | <.001a <.001b .049c |
| Tumour characteristics | ||||||
| Maximum diameter, cm (IQR)d Unknown | 2.3 (1.6-3.0) n = 6 | 1.8 (1.4-2.5) n = 4 | 2.8 (2.1-3.7) n = 2 | 3.2 (2.75-3.85) | <.001 | <.001a <.001b .339c |
| Unilateral, n (%) | 310 (82.6) | 191 (88.8) | 101 (73.2) | 18 (81.8) | <.001 | |
| Hounsfield units (IQR) Unknown | 7 (−1.5 to 16) n = 86 | 5 (−2 to 16.5) n = 42 | 8 (1.5-15) n = 39 | 12 (3.6-23) n = 5 | .154 | |
Categorical variables are reported as n (%); statistical comparison was performed by χ2 test. Continuous variables are reported as median (IQR), and statistical analyses were performed by the Kruskal–Wallis test followed by Dunn's post hoc test.
Abbreviations: 1 mg DST, 1 mg overnight dexamethasone suppression test; ACTH, adrenocorticotropin hormone; BMI, body mass index; CPA-CS, cortisol-producing adenoma with overt Cushing's syndrome; CPA-MACS, cortisol-producing adenoma with mild autonomous cortisol secretion; DHEAS, dehydroepiandrosterone sulphate; NFAT, non-functioning adrenal tumour.
aNFAT vs CPA-MACS.
bNFAT vs CPA-CS.
cMACS vs CPA-CS.
dFor bilateral tumours, the maximum diameter of the larger adrenal mass was considered.
Patients with CPA-MACS were further sub-classified as CPA-MACS-1 (possible MACS, 122 patients) and CPA-MACS-2 (definitive MACS, 26 patients), according to cortisol levels after 1 mg DST.5 Data are shown in Table S2. Patients with CPA-MACS-1 had smaller tumours than CPA-MACS-2, whilst the other clinical characteristics were similar between the 2 groups.
Relationship between haematological parameters and hormone levels
We observed a positive correlation between the cortisol levels after the 1 mg DST and the absolute number of leucocytes (r = 0.249, P < .001), neutrophils (r = 0.297, P < .001), and monocytes (r = 0.273, P < .001; Figure S2). At the same time, a negative correlation was found between ACTH and leucocytes (r = −0.288, P < .001), neutrophils (r = −0.272, P < .001), and monocytes (r = −0.208, P < .001). Furthermore, total leucocytes and neutrophils, but not monocytes, negatively correlated with DHEAS levels (r = −0.111, r = −0.147, P = .03, and P = .005, respectively; Figure S3).
Concerning the inflammation-based scores, a significant positive correlation with cortisol levels after the 1 mg DST was found for both NLR (r = 0.280, P < .001) and SII (r = 0.224, P < .001), whilst they negatively correlated with LMR (r = −0.239, P < .001; Figure 1A). Systemic immune-inflammation index negatively correlated with both ACTH (r = −0.137, P = .01) and DHEAS (r = −0.162, P = .002), whilst NLR negatively correlated only with DHEAS (r = −0.157, P = .0026; Figure 1B).

Correlation between cortisol after 1 mg DST, DHEAS, and ACTH with inflammation-based scores in patients with adrenocortical adenomas. (A) Correlation between cortisol after 1 mg DST and NLR, LMR, and SII in patients with adrenocortical adenomas. (B) Correlation between DHEAS and NLR, DHEAS and SII, and ACTH and SII in patients with adrenocortical adenomas. P values were determined with Spearman's correlation coefficient. 1 mg DST, 1 mg overnight dexamethasone suppression test; DHEAS, dehydroepiandrosterone sulphate; ACTH, adrenocorticotropin hormone; NLR, neutrophil-to-lymphocyte ratio; SII, systemic immune-inflammation index; LMR, lymphocyte-to-monocyte ratio.
Relationship between haematological parameters and adrenocortical tumour groups
We observed a gradual and significant increase of leucocyte, neutrophil, and monocyte counts across the spectrum of cortisol excess, from NFAT over CPA-MACS to CPA-CS, whilst platelets, lymphocytes, eosinophils, and basophils were similar (Table 2; Figure S4A).
Full blood count and inflammation-based scores of patients with non–aldosterone-producing adrenocortical adenomas.
| NFAT (n = 215) | CPA-MACS (n = 138) | CPA-CS (n = 22) | P value (Kruskal–Wallis) | P value (group comparison) | P value (Quade test) | P value (group comparison) | |
|---|---|---|---|---|---|---|---|
| FBC values | |||||||
| Leucocytes (×109/L) | 7.4 (5.9-8.6) | 7.6 (6.69-9.5) | 8.65 (7.17-10.32) | <.001 | .023a .002b .128c | <.001 | .005a .001b .058c |
| Platelets (×109/L) | 261 (208-303) | 271 (211-315.25) | 241 (223.75-288.75) | .678 | .306 | ||
| Neutrophils (×109/L) | 4.45 (3.4-5.6) | 5.1 (4-6.22) | 5.85 (4.7-7.54) | <.001 | .003a <.001b .120c | <.001 | .001a <.001b .014c |
| Lymphocytes (×109/L) | 1.9 (1.5-2.4) | 1.8 (1.4-2.6) | 2.1 (1.52-3.12) | .850 | .392 | ||
| Monocytes (×109/L) | 0.5 (0.4-0.6) | 0.6 (0.47-0.8) | 0.77 (0.6-0.92) | <.001 | .002a <.001b .005c | <.001 | .003a <.001b <.001c |
| Eosinophils (×109/L) | 0.14 (0.1-0.2) | 0.14 (0.1-0.2) | 0.1 (0.04-0.27) | .077 | .076 | ||
| Basophils (×109/L) | 0.2 (0.1-0.3) | 0.2 (0.1-0.3) | 0.11 (0.1-0.22) | .062 | .102 | ||
| Inflammation-based scores | |||||||
| NLR | 2.2 (1.71-2.93) | 2.69 (2.02-3.61) | 3.80 (1.92-4.37) | <.001 | <.001a .002b .363c | <.001 | .005a <.001b .001c |
| PLR | 133.5 (100.71–178.33) | 151.42 (104.95-183.01) | 124.96 (112.68-172.38) | .508 | .874 | ||
| SII | 558.26 (413.4-803.71) | 727 (465.98-953.32) | 859.55 (459.71-1355.20) | <.001 | .006a .021b .747c | <.001 | .009a .001b .046c |
| LMR | 3.66 (2.98-4.6) | 3.12 (2.42-4.5) | 2.23 (1.82-3.47) | <.001 | .010a <.001b .007c | <.001 | .096a <.001b <.001c |
| PNI Unknown | 52 (48-56.5) n = 68 | 51.25 (47-56) n = 56 | 53 (51.5-55.25) n = 5 | .325 | .921 | ||
| NPS 0/1/2 (%) | 197/17/1 (91.6%/7.9%/0.5%) | 126/11/1 (91.3%/8%/0.7%) | 16/5/1 (72.7%/22.7%/4.5%) | .044 | |||
Categorical variables are reported as n (%), and statistical comparison was performed by χ2 test. Continuous variables are reported as median (IQR), and statistical analyses were performed by the Kruskal–Wallis test followed by Dunn's post hoc test. Dunn’s post hoc test P values are shown in the table only if the Kruskal–Wallis was significant. For continuous variables, the Quade non-parametric analysis of covariance has been used to adjust for age and BMI, and P values of ANCOVA pairwise comparison are shown in the table only if the Quade test was significant. Bold: significant P values.
Abbreviations: CPA-CS, cortisol-producing adenoma with overt Cushing's syndrome; CPA-MACS, cortisol-producing adenoma with mild autonomous cortisol secretion; FBC, full blood count; LMR, lymphocyte-to-monocyte ratio; NFAT, non-functioning adrenal tumour; NLR, neutrophil-to-lymphocyte ratio; NPS, neutrophil-to-platelet score; PLR, platelet-to-lymphocyte ratio; PNI, prognostic nutrition index; SII, systemic immune-inflammation index.
aNFAT vs MACS.
bNFAT vs CS.
cMACS vs CS.
In particular, NLR and SII were significantly higher in both CPA-MACS (median 2.69 [2.02-3.61] and 727 [465.98-953.32], respectively) and CPA-CS (median 3.80 [1.92-4.37] and 859.55 [459.71-1355.20], respectively) compared to NFAT (median 2.2 [1.71-2.93] and 558.26 [413.4-803.71], respectively; Table 2 and Figure 2A). Conversely, LMR was lower in CPA-MACS (median 3.12 [2.42-4.5]) and CPA-CS (median 2.23 [1.82-3.47]) than in NFAT (median 3.66 [2.98-4.6]) but also significantly lower in CPA-CS compared to CPA-MACS (Table 2 and Figure 2A). These results were substantially confirmed even after adjustment for age, BMI (Table 2), and the presence of diabetes mellitus (data not shown).
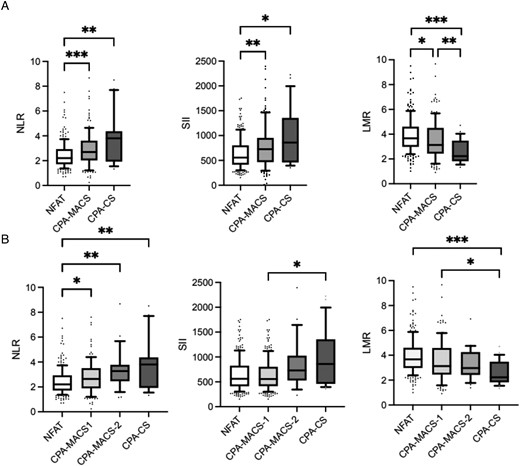
Inflammation-based scores in patients with adrenocortical adenomas. (A) Inflammation-based scores in patients with NFAT, CPA-MACS, and CPA-CS. (B) Inflammation-based scores in patients with NFAT, CPA-MACS-1, CPA-MACS-2, and CPA-CS. Data are shown as median and interquartile range, and the upper and the lower whiskers represent, respectively, the 90 and the 10 percentiles. *P < .05, **P < .01, and ***P < .001 (statistical analysis were performed by the Kruskal–Wallis test followed by Dunn's post hoc test). NFAT, non-functioning adrenal tumours; CPA-MACS, cortisol-producing adenomas with mild autonomous cortisol secretion; CPA-CS, cortisol-producing adenomas with overt Cushing's syndrome; CPA-MACS-1, possible mild autonomous cortisol secretion; CPA-MACS-2, definitive mild autonomous cortisol secretion; NLR, neutrophil-to-lymphocyte ratio; SII, systemic immune-inflammation index; LMR, lymphocyte-to-monocyte ratio.
We further stratified the patients with MACS according to cortisol levels after 1 mg DST into CPA-MACS-1 (cortisol levels between 50 and 138 nmol/L) and CPA-MACS-2 (cortisol levels above 138 nmol/L). We observed that leucocytes, neutrophils, and monocytes gradually increased from NFAT to CPA-MACS-1, CPA-MACS-2, and CPA-CS.
In particular, patients with CPA-MACS-2 had significantly higher values of leucocytes and neutrophils when compared to NFAT (P = .029 and P = .002, respectively), whilst only monocytes were significantly different between CPA-MACS-1 and NFAT (P = .009; Table S2 and Figure S4B). The increasing trend was observed also for NLR and SII scores, whilst LMR showed a decreasing trend across the 4 groups. Of note, NLR was significantly different when comparing CPA-MACS-1, CPA-MACS-2, and CPA-CS with NFAT (P = .026, P = .003, and P = .004, respectively), whilst LMR was higher in CPA-CS compared to both CPA-MACS-1 and NFAT (P = .01 and P < .001, respectively; Table S2; Figure 2B). No differences in FBC values and inflammation-based scores were observed in the comparison between CPA-MACS-2 and CPA-MACS-1.
Sexual dimorphism of haematological parameters
Full blood count and inflammation score results for men and women are reported in Table S3, Figure 3, and Figure S5. We observed a gradual reduction of eosinophils across the spectrum of cortisol excess (NFAT/CPA-MACS/CPA-CS) in men but not in women; similarly, leucocytes were significantly increased in women only, yet with less marked sex differences. We also found that platelets were significantly higher in women in all groups, and monocytes were lower in women (except for CS, which may not have reached statistical significance due to the small number of men with CS), as expected due to physiological differences. Both men and women showed similar increases in NLR and SII from NFAT over CPA-MACS to CPA-CS, but the trend was significant in men only. Interestingly, LMR decreased with increasing cortisol excess in both sexes (both P < .001), but women had persistently higher values than men (P < .001).
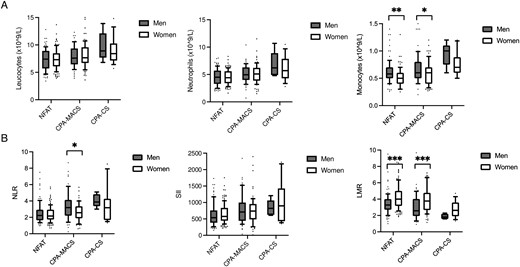
Full blood count values and inflammation-based scores in patients with adrenocortical adenomas divided by sex. (A) Full blood count values in men and women with NFAT, CPA-MACS, and CPA-CS. (B) Inflammation-based scores in men and women with NFAT, CPA-MACS, and CPA-CS. Data are shown as median and interquartile range, and the upper and the lower whiskers represent, respectively, the 90 and the 10 percentiles. *P < .05, **P < .01, and ***P < .001 (statistical analysis were performed by the Kruskal–Wallis test followed by Dunn's post hoc test). NFAT, non-functioning adrenal tumours; CPA-MACS, cortisol-producing adenomas with mild autonomous cortisol secretion; CPA-CS, cortisol-producing adenomas with overt Cushing’s syndrome; NLR, neutrophil-to-lymphocyte ratio; SII, systemic immune-inflammation index; LMR, lymphocyte-to-monocyte ratio.
The discriminatory power of haematological parameters to identify MACS
After excluding patients with CPA-CS, we assessed the performance of different FBC parameters and inflammation-based scores in distinguishing patients with NFAT (n = 215) from CPA-MACS (n = 138). Neutrophil-to-lymphocyte ratio showed the highest discriminatory power with an AUC of 0.620 (95% CI 0.558-0.682); the cut-off value with the best compromise between sensitivity (59.1%) and specificity (64.5%) was 2.38 (Table S4). The discriminatory power of NLR was slightly better in men (AUC 0.656, 95% CI 0.563-0.749).
Discussion
In the present study, by dissecting the results of blood tests routinely obtained in clinical practice, we showed for the first time that patients with CPA-MACS may have a higher degree of inflammation compared to patients with NFAT. This was suggested by differences in multiple serum inflammation-based scores, such as NLR, SII, and LMR, which are used as surrogates of systemic inflammatory response. In particular, these scores correlated with the degree of cortisol excess and were altered not only in patients with CPA-MACS but also in those with CPA-CS, compared to NFAT.
Cortisol excess in overt CS can remarkably influence haematopoiesis and circulating immune cells, as well as the degree of systemic inflammation. Different studies have reported FBC changes in patients with CS, eg, an increased number of leucocytes and neutrophils and a decreased number of lymphocytes,9,16,21 which correlate with the severity of the disease and improve after the resolution of CS.9–11,16,21 In our study, we showed that the degree of cortisol excess—measured by cortisol levels after 1 mg DST—correlated with leucocyte, neutrophil, and monocyte levels in patients with non–aldosterone-secreting adrenocortical adenomas regardless of the presence of clinical signs of CS, suggesting that even mild cortisol excess can adversely affect the levels of circulating immune cells. This hypothesis is in keeping with the negative correlation between the same FBC parameters and both ACTH and DHEAS levels, in line with the ACTH-independent nature of cortisol excess in CPA-MACS and CPA-CS.4 However, due to the weakness of these associations, the results should be interpreted with caution.
Moreover, we showed that patients with CPA-MACS have higher leucocyte and neutrophil counts as well as higher NLR and SII scores compared to NFAT, potentially reflecting a higher degree of systemic inflammation. These trends persisted also when we analysed separately patients with possible (CPA-MACS-1) or definitive MACS (CPA-MACS-2), suggesting that even milder degrees of cortisol excess can affect immune function. Our findings suggest that patients with CPA-MACS, similarly to CPA-CS, have compromised immunity, which may increase their risk of infections. This is in accordance with a recent study showing that patients with CPA-MACS have a self-reported increased rate of urinary tract infections and flu compared with healthy subjects,22 but data from systematic studies are lacking. This is of major clinical relevance considering the high prevalence of CPA-MACS in adults, and because impaired immunity in CPA-MACS may not only affect the risk of infection but also contribute to other adverse health outcomes, including tumourigenesis; indeed, CPA-MACS have remarkably high mortality from cancer.7
To our knowledge, only 1 previous study proposed NLR to differentiate NFAT from CPA (including both CS and MACS) and reported that a cut-off for NLR of 2.2 had a sensitivity of 80% and a specificity of 54%.17 Our study confirmed that NLR had the best discriminatory power among all the inflammation-based scores. We performed this analysis to compare our findings with previous data17 and determine their potential ability to differentiate NFAT from CPA-MACS. Our results demonstrate that NLR, SII, and LMR effectively distinguish NFAT from CPA-MACS. Nevertheless, due to the low AUC levels, this association should be interpreted with caution, and we do not recommend using these scores as a standalone diagnostic tool. However, inflammation-based scores at baseline and during follow-up may provide insights for the management of MACS when opting for conservative treatment vs targeted interventions. However, further larger studies, including longitudinal monitoring, are required before the use of inflammation-based scores can be implemented in clinical practice.
In relation to sexual dimorphism, we observed that women exhibited higher values than men in the LMR for the NFAT, CPA-MACS, and CPA-CS groups. Additionally, men with CPA-MACS had higher NLR compared to women with CPA-MACS and demonstrated slightly superior performance in distinguishing between these 2 groups.
These findings suggest that there may be intrinsic differences in immune response between men and women, particularly in response to cortisol excess. It is possible that cortisol excess induces a distinct inflammatory response and immune system activation based on sex.23 The significance of sex as a determinant of the outcome of glucocorticoid receptor signalling has been demonstrated by Duma et al.24 who reported sexually dimorphic glucocorticoid receptor signalling in rat livers. In particular, they observed that dexamethasone displayed stronger anti-inflammatory activity in males compared to females, inhibiting pro-inflammatory cytokines like IL-6 and tumour necrosis factor (TNF)-α. This divergent glucocorticoid receptor signalling in male compared to female rats can alter function and impact the progression of diseases with gender difference in prevalence. In conclusion, these results suggest that there may be a disparity in inflammation levels between men and women with CPA-MACS. To establish a deeper understanding of the sexual dimorphic action of cortisol and its potential relationship with inflammation levels and consequently potential differences in complications or treatment approaches, further research is needed.
Finally, we observed significant changes in monocyte levels and monocyte-based score (LMR) in patients with CPAs. Monocytes are circulating precursors of macrophages and play a fundamental role in inflammatory activation, innate and adaptive immunity, and tissue repair.
However, studies in humans showed that monocytes are increased in patients with CS and MACS, in line with our results.10,11,19 In our study, monocytes were also higher in men than in women, but this was in accordance to known physiological gender differences.25 Aside from total numbers, how myeloid precursor populations are influenced by elevated circulating cortisol in MACS and the impact this has on their function and immune-regulatory properties has yet to be ascertained. However, meta-inflammation, with altered macrophage polarization states, has been linked to insulin insensitivity, atherosclerosis, inflammatory bowel disease, cancer, and autoimmunity.26
This study has some limitations. Firstly, the retrospective design prevents us from drawing clear conclusions on the causal effects of cortisol secretion on the FBC values and the inflammation-based scores. Furthermore, data on the post-operative FBC levels that could help to explore a causal role were frequently not available (mostly because patients with NFAT and the majority of CPA-MACS patients do not usually undergo surgery). Another limitation due to the retrospective nature of the study is the limited availability of data on ethnicity, smoking status, and metabolic control of diabetes mellitus—factors that have been shown to be related to inflammation and, specifically, to potentially increase NLR.27–29 Furthermore, data on other inflammation markers, such as levels of C-reactive protein and pro-inflammatory cytokines, were either missing or only available for a small subset of patients. Finally, we did not measure the lymphocyte and monocyte sub-populations, which could help to better understand cortisol-induced changes.
In conclusion, this study provides evidence that, similarly to overt CS, mild degrees of cortisol autonomy influence the immune system function and inflammatory response, which may contribute to MACS-related comorbidities. We also speculate that inflammation levels and immune response may differ between men and women, highlighting the need for further research to understand the potential impact of sex on cortisol-induced inflammation and its implications for disease progression and management. Our data inform the connection between cortisol excess and inflammation and offer insights for potential interventions and surveillance strategies in patients with CPA-MACS.
Acknowledgments
The authors thank the core members of the Queen Elizabeth Hospital Birmingham Adrenal Tumour Multidisciplinary Team for their support in the management of patients with adrenal masses.
Supplementary material
Supplementary material is available at European Journal of Endocrinology online.
Funding
A.P. receives support from the National Institute for Health and Care Research (NIHR) Birmingham Biomedical Research Centre at the University Hospitals Birmingham NHS Foundation Trust and the University of Birmingham (grant reference number NIHR203326). R.H. receives support from the National Institute for Health and Care Research (NIHR) Birmingham Biomedical Research Centre (grant number BRC-1215-20009). The views expressed are those of the authors and not necessarily those of the NIHR or the Department of Health & Social Care.
Author contributions
Vittoria Favero (Data curation [equal], Formal analysis [equal], Validation [equal], Writing—original draft [equal], Writing—review & editing [equal]), Alessandro Prete (Supervision [equal], Validation [equal], Visualization [equal], Writing—original draft [equal], Writing—review & editing [equal]), Alessandra Mangone (Data curation [equal], Validation [equal], Visualization [equal]), Yasir S. Elhassan (Supervision [equal], Validation [equal], Visualization [equal], Writing—review & editing [equal]), Valentina Pucino (Conceptualization [equal], Methodology [equal], Validation [equal], Writing—review & editing [equal]), Miriam Asia (Data curation [equal], Validation [equal], Visualization [equal], Writing—review & editing [equal]), Rowan Hardy (Supervision [equal], Validation [equal], Visualization [equal], Writing—review & editing [equal]), Iacopo Chiodini (Supervision [equal], Validation [equal], Visualization [equal], Writing—review & editing [equal]), and Cristina L. Ronchi (Conceptualization [equal], Supervision [equal], Validation [equal], Visualization [equal], Writing—original draft [equal], Writing—review & editing [equal]).
Data availability
All the relevant data underlying this article are available in the article and in its online supplementary material. Additional data will be shared on reasonable request to the corresponding author.
References
Author notes
Conflict of interest: I.C. has served on the advisory boards of HRA Pharma and Corcept Therapeutics. C.L.R. has received a research grant from HRA Pharma Rare Disease. All other authors have nothing to disclose.
