


Abstract
The presence of bacterial colonization that causes chronic pulmonary infections in cystic fibrosis (CF) patients remains a key issue before lung transplantation. We sought to assess the impact of intraoperative taurolidine lavage on bacterial colonization and long-term outcomes following lung transplantation in CF patients.
Between 2007 and 2013, 114 CF patients underwent lung transplantation at our institute, and taurolidine 2% bronchial lavage was applied in a substantial proportion of patients (n = 42). A detailed analysis of donor and recipient bacterial colonization status in treatment and control groups and their impact on outcome was performed.
The proportion of recipients colonized with Pseudomonas aeruginosa was lower in the taurolidine group at 3 months (P < 0.001) and at 1 year (P = 0.053) postoperatively, despite no differences before transplant (P = 1.000). Moreover, a complete eradication of Burkholderia cepacia and Stenotrophomonas maltophilias colonizations could be achieved in the taurolidine group, whereas in the non-taurolidine group, persistent B. cepacia and S. maltophilias colonizations were observed. Early outcome in the taurolidine group was superior regarding fraction of expired volume in 1 s at 3 and 6 months after surgery with 74.5 ± 14.6 vs 60.4 ± 17.5 (P < 0.001) and 80.6 ± 16.9 vs 67.2 ± 19.4 (P = 0.005) percent of predicted values, respectively. In terms of long-term overall survival (P = 0.277) and freedom from bronchiolitis obliterans syndrome (P = 0.979), both groups were comparable.
Taurolidine might be associated with a reduced proportion of CF patients colonized with multiresistant pathogens, particularly with P. aeruginosa. Long-term results should be further assessed in larger multicentre trials.
INTRODUCTION
Cystic fibrosis (CF) is caused by dysfunction of the CF transmembrane conductance regulator protein, an ion transport disorder leading to pulmonary hypertension and cor pulmonale with poor prognosis in the young adulthood [1, 2]. After implementation of neonatal screening programmes, an excellent quality of life and an even greater life expectancy can be achieved in CF patients [3]. In early stages, the disease is usually treated conservatively using pharmacological and physical therapy as well as non-invasive ventilation support [4, 5]. Newer drugs, such as the CF transmembrane conductance regulator potentiator ivacaftor (Kalydeco®, Vertex Pharmaceuticals Incorporated, Boston, MA, USA), can correct the protein defect in CF patients with G551D or other certain gating mutations and may also positively influence Pseudomonas aeruginosa (PA) colonization; however, there are still several CF gene mutations that elude redressal [6] with progressive loss in pulmonary function due to recurrent and chronic pulmonary infections that represent the main cause of death [7].
Lung transplantation (LTx) is an established treatment for CF patients with end-stage lung disease and has been associated with steadily improving outcomes over the last 20 years [8, 9]. The most frequently obtained respiratory pathogen in CF patients is PA, present in more than 80% bronchial lavage samples of patients over the age of 26 years [10]. Post-transplant recolonizations with PA have been shown to be independent predictors of bronchiolitis obliterans syndrome (BOS) [11]. Chronic infection in early stages can also be caused by Staphylococcus aureus and Stenotrophomonas maltophilias (SM), whereas PA is usually found in later stages of the disease [12]; viruses may also play a role in chronic infection in CF patients.
Taurolidine, bis(1,1-dioxoperhydro-1,2,4-thiadiazinyl-4)-methane, is a chemotherapeutic agent with antimicrobial and antilipopolysaccharide properties with immunomodulation mediated by priming and activation of macrophages and polymorphonuclear leucocytes [13]. Intravenous or nebulized taurolidine has been successfully used in CF patients with Burkholderia cepacia (BCC) [14], with in vitro activity against multiple micro-organisms isolated from CF patients [15].
In this study, we performed a detailed analysis of taurolidine and its impact on post-transplant bacterial colonization and outcome in CF patients.
METHODS
We included data of 114 consecutive LTx patients with CF performed at Harefield Hospital between January 2007 and November 2013. Organ procurement was performed by 6 designated lung transplant centres in the UK, including ours, within a specified geographical region of each centre. Recipients with various risk profiles were included in the study. Patients were divided in 2 groups as per the use of intraoperative taurolidine lavage applied through recipient bronchi to both pleural cavities: 42 patients received taurolidine, whereas 72 were assigned to the control group. Common pathogens, the impact of taurolidine on pathogen colonization, long-term overall cumulative survival and long-term freedom from BOS were presented and compared between the 2 groups.
Definitions
All definitions have already been described in our previous research. Total ischaemic time was defined as the time between cardiac arrest in donation after cardiac death donors or aortic cross-clamp in donation after brain death donors and reperfusion of the second implanted lung. The grade of primary graft dysfunction was defined based on the International Society of Heart and Lung Transplantation (ISHLT) Working Group on Primary Dysfunction Report: the pO2/FiO2 ratio <200 was considered as primary graft dysfunction Grade 3, independent of findings on the chest X-ray. Lung function tests were performed on each hospital admission and transplant outpatient visits, and BOS was diagnosed when post-transplant fraction of expired volume in 1 s (FEV1) measured regularly after LTx permanently dropped >20% of the best FEV1 achieved after LTx, as per the ISHLT recommendations [16]. Extended donor criteria were defined as pO2/FiO2 ratio <300 (pO2 measured in mmHg) and/or age >55 years and/or history of smoking >20 pack-years. Smoking history was defined as temporary or permanent smoking habit at the time of organ donation or in the past. One pack-year was defined as 20 cigarettes (1 pack) smoked per day for 1 year.
Taurolidine flush
Since March 2010, taurolidine flush was performed in a substantial proportion of CF patients undergoing LTx, whereas there was no clear evidence in terms of benefit/complication ratio of using this solution in the setting of LTx. Therefore, a number of implanting surgeons were careful about this strategy, and the decision to use taurolidine flush was made by each consultant who performed surgery. At the same time, another group of patients was transplanted without the use of taurolidine. Although taurolidine was not used from 2007 to 2009, these patients were not excluded in order to increase the statistical power by increasing the number of patients in the cohort analysed. In the taurolidine group, each main bronchus of the recipients was flushed directly after pneumonectomy through the double-lumen endotracheal tube with 1000 ml of taurolidine solution comprising 250 ml of 2% Taurolin® (taurolidine) diluted in 750 ml of 0.9% saline. Taurolidine lavage was always performed sequentially after each pneumonectomy. After each bronchial flush, a complete washout of both pleural cavities was done with further 1000 ml of this solution (combined application time of 20–30 s) and minimum exposure time for bronchi and pleural cavities of 5 min before implantation of donor lungs. As taurolidine had demonstrated a very low rate of toxicity and side effects and there had been no evidence of systemic absorption, there was no need for taurolidine level measurement. In this study, no side effects were observed that could be attributed to taurolidine flush.
Statistical analysis
All data were analysed using IBM SPSS Statistics for Mac, version 21 (IBM Corp., Released 2012. IBM Corp., Armonk, NY, USA) and were presented as continuous or categorical variables. Continuous data were evaluated for normality using 1 sample Kolmogorov–Smirnov test and confirmed by histograms. Continuous variables were expressed as the mean ± standard deviation in cases of normally distributed variables or median (interquartile range) in cases of non-normally distributed variables. Categorical variables were presented as total numbers of patients and percentages. Continuous data were analysed with unpaired t-test for normally distributed variables and the Mann–Whitney U-test for non-normally distributed variables. The Pearson’s χ2 test or the Fisher’s exact test was used for categorical data dependent on the minimum expected count in each cross-tab. The Kaplan–Meier survival estimation was applied for survival analysis and freedom from BOS. Patients who survived (cumulative survival curve) or did not develop BOS (freedom from BOS curve) at the cut-off of the study were censored. The log-rank (Mantel–Cox) and generalized Wilcoxon tests were applied for comparison of cumulative survival estimates and estimated freedom from BOS between both groups (the taurolidine and non-taurolidine groups). Propensity score matching function of SPSS software was conducted to reduce confounding bias between the groups. Matching was based on one-to-one nearest neighbour matching method with a tolerance level on the maximum propensity score distance (calipers of width 0.2 SDs of the logit of the PS). This propensity score-based matching procedure resulted in a total number of 50 patients matched. The same statistical tests were used before and after propensity score matching.
RESULTS
The median donor age of the entire CF cohort was 42 (27–52) years, mean height 168.9 ± 10.4 cm and 70 (61.4%) patient donors were female. After splitting all patients in the taurolidine and non-taurolidine groups, baseline donor characteristics were comparable in terms of age (P = 0.972), height (P = 0.188), weight (P = 0.155) and gender (P = 0.475). Additional donor parameters that were usually assessed considering organs offered were also well distributed between the 2 groups without statistically significant differences: cigarette smoking history (P = 0.464), percentage of abnormal chest X-ray (P = 0.783) and the need for ex vivo lung perfusion (EVLP) (P = 0.356). However, there was a trend towards poorer mean last preretrieval pO2/FiO2 ratio (P = 0.079) and bronchoscopy results (P = 0.090) in the taurolidine group (Table 1).
Donor baseline and organ procurement data
| Taurolidine (n = 42) | Non-taurolidine (n = 72) | P-value | |
|---|---|---|---|
| Age (years), median (IQR) | 42 (25–51) | 42 (31–51) | 0.972 |
| Female, n (%) | 24 (57.1) | 46 (63.9) | 0.475 |
| Height (cm), mean ± SD | 170.6 ± 9.6 | 167.9 ± 10.8 | 0.188 |
| Weight (kg), median (IQR) | 71 (65–81) | 70 (60–80) | 0.155 |
| Blood group, n (%) | 0.795 | ||
| O | 21 (50) | 31 (43.1) | |
| A | 17 (40.5) | 32 (44.4) | |
| B | 4 (9.5) | 8 (11.1) | |
| AB | 0 (0) | 1 (1.4) | |
| Pre-retrieval pO2/FiO2 ratio, mean ± SD | 54.6 ± 16.5 | 59.5 ± 12.5 | 0.079 |
| Use of EVLP, n (%) | 3 (7.1) | 2 (2.8) | 0.356 |
| History of cardiac arrest, n (%) | 11 (26.8) | 16 (22.2) | 0.581 |
| Cardiac arrest duration (min), mean ± SD | 21.9 ± 15.0 | 24.2 ± 16.4 | 0.719 |
| Smoking history, n (%) | 17 (41.5) | 35 (48.6) | 0.464 |
| Cannabis smoker, n (%) | 4 (9.5) | 3 (4.2) | 0.420 |
| Extended donor criteria,an (%) | 13 (31) | 17 (23.6) | 0.391 |
| Abnormal CXR, n (%) | 10 (24.4) | 19 (26.8) | 0.783 |
| Abnormal bronchoscopy, n (%) | 16 (38.1) | 16 (22.9) | 0.090 |
| DCD, n (%) | 9 (21.4) | 15 (20.8) | 0.940 |
| Cause of death, n (%) | |||
| ICH | 25 (59.5) | 50 (69.4) | 0.281 |
| HBI | 4 (9.5) | 5 (6.9) | 0.723 |
| Trauma | 8 (19) | 5 (6.9) | 0.068 |
| CVA | 4 (9.5) | 5 (6.9) | 0.723 |
| Meningitis | 1 (2.4) | 4 (5.6) | 0.650 |
| Other | 0 (0) | 2 (2.8) | 0.397 |
Donors outside standard criteria: PaO2/FiO2 ratio <300, age >55 years and history of smoking >20 pack-years according to the ISHLT definition.
CVA: cerebrovascular accident; CXR: chest X-ray; DCD: donors after cardiac death; EVLP: ex vivo lung perfusion; HBI: hypoxic brain injury; ICH: intracranial haemorrhage; IQR: interquartile range; SD: standard deviation.
Table 2 lists preoperative recipient demographics and distribution of recipient’s diagnosis. The mean recipient’s age was 28 (24–34) years, and 55 (48.2%) patients were female. All consecutive patients requiring the use of extracorporeal life support as a bridge to transplantation (n = 6, 5.3%) were also included without significant differences between both groups. There were no single-lung transplants performed in either of the groups.
Recipient baseline characteristics
| Taurolidine (n = 42) | Non-taurolidine (n = 72) | P-value | |
|---|---|---|---|
| Age (years), median (IQR) | 29 (24–34) | 28 (24–35) | 0.846 |
| Female, n (%) | 22 (52.4) | 33 (45.8) | 0.500 |
| Height (cm), median (IQR) | 166 (162–174) | 167 (160–174) | 0.620 |
| Weight (kg), median (IQR) | 55 (50–62) | 54 (50–60) | 0.677 |
| Diabetes, n (%) | 20 (80) | 19 (76) | 0.733 |
| Blood group, n (%) | 0.095 | ||
| O | 26 (61.9) | 29 (40.3) | |
| A | 11 (26.2) | 34 (47.2) | |
| B | 4 (9.5) | 5 (6.9) | |
| AB | 1 (2.4) | 4 (5.6) | |
| ECLS | 2 (4.8) | 4 (5.6) | 1.000 |
| CPB requirement | 21 (50) | 49 (68.1) | 0.073 |
CPB: cardiopulmonary bypass; ECLS: extracorporeal life support; IQR: interquartile range.
Intraoperative variables and parameters of early postoperative outcome are presented in Table 3. Early outcome in the taurolidine group was superior regarding FEV1 at 3 and 6 months after surgery with 74.5 ± 14.6 vs 60.4 ± 17.5 (P < 0.001) and 80.6 ± 16.9 vs 67.2 ± 19.4 (P = 0.005) percent of predicted values, respectively. A subgroup analysis comparing FEV1 in patients with and without PA colonization at the time of FEV1 measurement showed that there were no statistically significant differences in terms of FEV1 between PA colonized and PA non-colonized patients both at 3 (P = 0.997) and at 6 (P = 0.935) months. The postoperative pO2/FiO2 ratios within the first 72 h after transplant ranged between 305.4 ± 118.4 and 373.9 ± 116.2 mmHg in the entire cohort, with no statistically significant differences between the 2 groups. Incidences of primary graft dysfunction Grade 3 after transplant were 9 (8.1%) after 24 h, 6 (5.8%) after 48 h and 6 (5.8%) after 72 h, with no statistical significant differences between both groups. Postoperative extracorporeal membrane oxygenation due to respiratory failure was needed in 7 (6.2%) patients [5 (12.2%) in taurolidine group versus 2 (2.8%) in non-taurolidine group, P = 0.097]. The median length of mechanical ventilation was 30 (20–96) h, the median duration of intensive care unit was 5 (3–11) days and the total hospital stay was 30 (21–44) days, with no statistically significant differences between the 2 groups. Similar outcome results were also obtained after propensity score matching (Table 4).
Intraoperative data and postoperative outcome
| Taurolidine (n = 42) | Non-taurolidine (n = 72) | P-value | |
|---|---|---|---|
| PaO2/FiO2 ratio, mean ± SD | |||
| 24 h | 356.1 ± 153.7 | 355.7 ± 99.9 | 0.987 |
| 48 h | 358.2 ± 152.6 | 375.9 ± 112.8 | 0.557 |
| 72 h | 355.4 ± 119.4 | 382.1 ± 114.8 | 0.322 |
| Ventilation (h), median (IQR) | 29 (19–73) | 30 (20–150) | 0.620 |
| ICU stay (days), median (IQR) | 5 (3–8) | 6 (3–20) | 0.232 |
| Hospital stay (days), median (IQR) | 27 (20–40) | 31 (22–48) | 0.089 |
| ECMO, n (%) | 5 (12.2) | 2 (2.8) | 0.097 |
| PGD, n (%) | |||
| 24 h | 4 (9.8) | 5 (7.1) | 0.723 |
| 48 h | 4 (10.5) | 2 (3.0) | 0.188 |
| 72 h | 2 (5.4) | 4 (6.5) | 1.000 |
| Rejection, n (%) | |||
| A0 | 37 (88.1) | 53 (73.6) | 0.067 |
| A1 | 2 (4.8) | 9 (12.5) | 0.210 |
| A2 | 2 (4.8) | 9 (12.5) | 0.210 |
| A3 | 1 (2.4) | 1 (1.4) | 1.000 |
| FEV1, mean ± SD | |||
| 3 months | 74.5 ± 14.6 | 60.4 ± 17.5 | <0.001 |
| 6 months | 80.6 ± 16.9 | 67.2 ± 19.4 | 0.005 |
| 1 year | 80.8 ± 21.6 | 74.6 ± 20.6 | 0.307 |
| 2 years | 81.5 ± 35.8 | 74.1 ± 23.4 | 0.462 |
ECMO: extracorporeal membrane oxygenation; FEV1: forced expiratory volume in 1 s; ICU: intensive care unit; PGD: primary graft dysfunction; SD: standard deviation.
Statistically significant (P < 0.05) values are in bold.
Postoperative outcome after propensity score matching
| Taurolidine (n = 25) | Non-taurolidine (n = 25) | P-value | |
|---|---|---|---|
| PaO2/FiO2 ratio, mean ± SD | |||
| 24 h | 359.1 ± 145.2 | 359.0 ± 107.9 | 0.999 |
| 48 h | 345.2 ± 125.3 | 397.7 ± 136.8 | 0.193 |
| 72 h | 374.4 ± 115.5 | 386.0 ± 110.5 | 0.741 |
| Ventilation (h), median (IQR) | 31 (17.5–52) | 35.5 (19–139) | 0.535 |
| ICU stay (days), median (IQR) | 5 (3–7) | 7 (3–21) | 0.226 |
| Hospital stay (days), median (IQR) | 30 (22.5–41) | 27 (21–44.5) | 0.969 |
| ECMO, n (%) | 1 (4.2) | 1 (4) | 1.000 |
| PGD, n (%) | |||
| 24 h | 1 (4.2) | 2 (8.3) | 1.000 |
| 48 h | 1 (4.8) | 1 (4.3) | 1.000 |
| 72 h | 0 (0) | 1 (4.3) | 1.000 |
| Rejection, n (%) | |||
| A0 | 21 (84) | 18 (72) | 0.306 |
| A1 | 2 (8) | 2 (8) | 1.000 |
| A2 | 1 (4) | 5 (20) | 0.189 |
| A3 | 1 (4) | 0 (0) | 1.000 |
| FEV1, mean ± SD | |||
| 3 months | 74.0 ± 14.9 | 60.8 ± 17.6 | 0.010 |
| 6 months | 80.2 ± 17.4 | 67.3 ± 17.2 | 0.022 |
| 1 year | 80.8 ± 21.6 | 68.8 ± 24.2 | 0.129 |
| 2 years | 81.5 ± 35.8 | 65.0 ± 25.1 | 0.195 |
BOS: bronchiolitis obliterans; ECMO: extracorporeal membrane oxygenation; FEV1: forced expiratory volume in 1 s: ICU: intensive care unit; PGD: primary graft dysfunction; SD: standard deviation.
Statistically significant (P < 0.05) values are in bold.
Overall cumulative and bronchiolitis obliterans free survival in the taurolidine group versus the non-taurolidine group
The cumulative incidence of postoperative BOS over the follow-up was 12.5% vs 18.2% (P = 0.694), and the cumulative free survival was 80% vs 68%, (P = 0.333) in the taurolidine group versus non-taurolidine group. Overall cumulative survival estimated using the Kaplan–Meier analysis (Fig. 1) was 85.2% vs 88.5% at 1 year, 76.7% vs 82.1% at 2 years and 62.0% vs 71.9% at 3 years, respectively [log rank (Mantel–Cox) P = 0.277; generalized Wilcoxon P = 0.271]. Figure 2 depicts the estimated BOS free survival in both groups with follow-up up to 3 years in the taurolidine group and up to 6 years in the non-taurolidine group: 96.6% vs 91.3% at 1 year, 86.3% vs 84.5% at 2 years and 86.3% vs 84.5% at 3 years, respectively [log rank (Mantel–Cox) P = 0.979; generalized Wilcoxon P = 0.985].
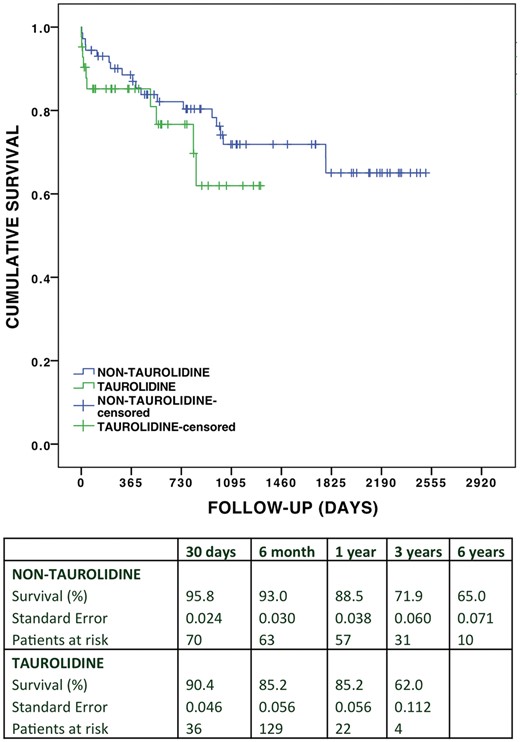
Overall cumulative survival in the taurolidine group versus non-taurolidine group.
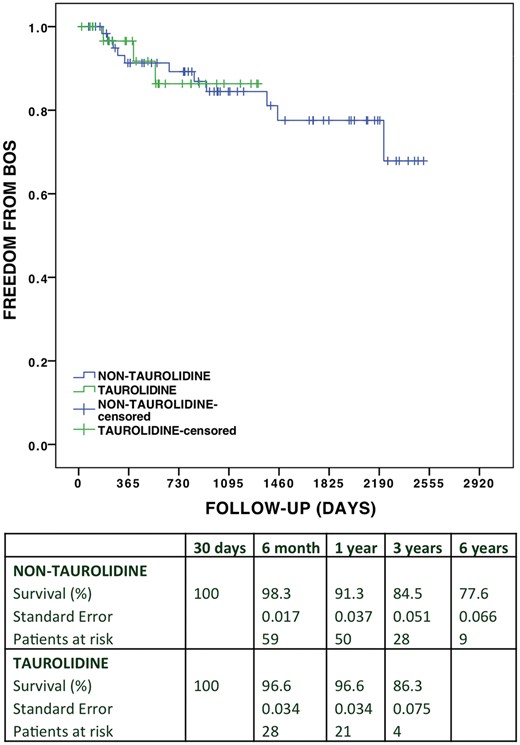
Survival free of BOS comparing the taurolidine group versus non-taurolidine group. BOS: bronchiolitis obliterans syndrome.
Common pathogens and the impact of taurolidine on pathogen colonization
Information on bacterial colonization in donors and recipients before and after transplant is presented in Tables 5 and 6. Recipients were investigated for the presence of various pathogens in bronchoalveolar lavage (BAL) for a year after the transplant in the entire cohort. There was a reduction in PA colonization observed in the taurolidine group from 83.3% at baseline to 31.3% at 3 months and 20% at 1 year. In contrast, non-taurolidine group was only associated with less significant decrease in PA colonization from 83.3% at baseline to 68.8% at 3 months (P < 0.001) and 40.3% at 1 year (P = 0.053). Estimated freedom from BOS (generalized Wilcoxon P = 0.032) and overall cumulative survival (generalized Wilcoxon P = 0.0042) significantly worsened in a subgroup of patients with persistent PA colonization in the BAL culture 3 months after LTx. A total of 7.1% of patients from the taurolidine group and 4.2% from the non-taurolidine group had intraoperative evidence of BCC colonization. Postoperatively, BCC colonization decreased to 3.1% at 3 months, with complete eradication at 1 year in the taurolidine group. In the non-taurolidine group, BCC colonization persisted with 1.6% at 1 year. Similarly, in the taurolidine group, the proportion of patients with SM colonization decreased over the follow-up to 0% at 1 year, whereas SM in the non-taurolidine group could not be fully eradicated.
Bacterial colonization in donors (n = 114) and recipients (n = 114) with/without the use of taurolidine
| Taurolidine donor, n (%) | Non-taurolidine donor, n (%) | P-value | Taurolidine recipient, n (%) | Non-taurolidine recipient, n (%) | P-value | |
|---|---|---|---|---|---|---|
| Pseudomonas aeruginosa | 2 (4.8) | 6 (8.5) | 0.708 | 35 (83.3) | 60 (83.3) | 1.000 |
| Staphylococcus aureus | 1 (2.4) | 5 (7) | 0.409 | 0 (0) | 1 (1.4) | 1.000 |
| Candida species | 8 (19) | 10 (14) | 0.486 | 11 (26.2) | 29 (40.3) | 0.128 |
| Enterococcus faecalis | 0 (0) | 1 (1.4) | 1.000 | 0 (0) | 0 (0) | |
| Burkholderia cepacia | 0 (0) | 0 (0) | 3 (7.1) | 3 (4.2) | 0.668 | |
| Burkholderia pseudomallei | 0 (0) | 0 (0) | 1 (2.4) | 0 (0) | 0.368 | |
| Staph sens | 17 (40.5) | 18 (25.4) | 0.093 | 10 (23.8) | 14 (19.4) | 0.581 |
| Stenotrophomonas maltophilias | 1 (2.4) | 0 (0) | 0.372 | 6 (14.3) | 6 (8.3) | 0.354 |
| Proteus | 1 (2.4) | 1 (1.4) | 1.000 | 0 (0) | 0 (0) | |
| VRE | 0 (0) | 0 (0) | 0 (0) | 0 (0) | ||
| Achromobacter xylosoxidans | 0 (0) | 0 (0) | 1 (2.4) | 9 (12.5) | 0.089 | |
| Hemophilus influenzae | 0 (0) | 6 (8.5) | 0.083 | 2 (4.8) | 1 (1.4) | 0.554 |
| Moraxella catarrhalis | 0 (0) | 0 (0) | 1 (2.4) | 0 (0) | 0.368 | |
| Escherichia coli | 5 (11.9) | 3 (4.2) | 0.145 | 0 (0) | 0 (0) | |
| Aspergillus fumigatus | 0 (0) | 0 (0) | 17 (40.5) | 11 (15.3) | 0.003 | |
| Enteroccocus aerogenes | 0 (0) | 0 (0) | 0 (0) | 0 (0) | ||
| Mycobacterium atypical | 0 (0) | 0 (0) | 1 (2.4) | 4 (5.6) | 0.654 | |
| MRSA | 0 (0) | 1 (1.4) | 1.000 | 0 (0) | 4 (5.6) | 0.295 |
| Fusarium | 0 (0) | 0 (0) | 0 (0) | 0 (0) | ||
| Streptococcus pneumoniae | 1 (2.4) | 4 (5.6) | 0.649 | 0 (0) | 1 (1.4) | 1.000 |
| Pantoea species | 0 (0) | 1 (1.4) | 1.000 | 0 (0) | 0 (0) | |
| Ralstonia picketti | 0 (0) | 0 (0) | 0 (0) | 0 (0) | ||
| Serratia | 0 (0) | 0 (0) | 0 (0) | 0 (0) | ||
| Scedosporium | 0 (0) | 0 (0) | 2 (4.8) | 0 (0) | 0.134 | |
| Paecilomyces | 0 (0) | 0 (0) | 0 (0) | 0 (0) | ||
| Morganella morganii | 0 (0) | 1 (1.4) | 1.000 | 0 (0) | 0 (0) | |
| Mycobacterium abscessus | 0 (0) | 0 (0) | 1 (2.4) | 4 (5.6) | 0.650 | |
| Klebsiella | 1 (2.4) | 0 (0) | 0.372 | 0 (0) | 0 (0) | |
| Hafnia alvei | 1 (2.4) | 0 (0) | 0.372 | 0 (0) | 0 (0) | |
| Scedosporium | 0 (0) | 0 (0) | 0 (0) | 1 (1.4) | 1.000 | |
| Hemophilus parainfluenzae | 0 (0) | 0 (0) | 0 (0) | 0 (0) |
MRSA: methicillin resistant Staphylococcus aureus; MSSA: methicillin sensitive Staphylococcus aureus; VRE: vancomycin resistant enterococci.
Statistically significant (P < 0.05) values are in bold.
Bacterial colonization with/without use of taurolidine at 3-month and one-year follow-up
| Taurolidine 3 months, n (%) | Non-taurolidine 3 months, n (%) | P-value | Taurolidine 1 year, n (%) | Non-taurolidine 1 year, n (%) | P-value | |
|---|---|---|---|---|---|---|
| Pseudomonas aeruginosa | 10 (31.3) | 44 (68.8) | <0.001 | 6 (20) | 25 (40.3) | 0.053 |
| Staphylococcus aureus | 0 (0) | 0 (0) | 0 (0) | 1 (1.6) | 1.000 | |
| Candida species | 3 (9.4) | 1 (1.6) | 0.106 | 1 (3.3) | 2 (3.2) | 1.000 |
| Enterococcus faecalis | 0 (0) | 0 (0) | 1 (1.1) | 0 (0) | 0.326 | |
| Burkholderia cepacia | 1 (3.1) | 1 (1.6) | 1.000 | 0 (0) | 1 (1.6) | 1.000 |
| Burkholderia pseudomallei | 1 (3.1) | 0 (0) | 0.333 | 1 (3.3) | 0 (0) | 0.326 |
| Staph sens. | 1 (3.1) | 2 (3.1) | 1.000 | 0 (0) | 2 (3.2) | 1.000 |
| Stenotrophomonas maltophilias | 0 (0) | 2 (3.1) | 0.551 | 0 (0) | 1 (1.6) | 1.000 |
| Proteus | 0 (0) | 0 (0) | 0 (0) | 0 (0) | ||
| VRE | 0 (0) | 0 (0) | 0 (0) | 0 (0) | ||
| Achromobacter xylosoxidans | 0 (0) | 2 (3.1) | 0.551 | 0 (0) | 3 (4.8) | 0.548 |
| Hemophilus influenzae | 1 (3.1) | 0 (0) | 0.333 | 0 (0) | 0 (0) | |
| Moraxella catarrhalis | 0 (0) | 0 (0) | 0 (0) | 0 (0) | ||
| Escherichia coli | 0 (0) | 0 (0) | 0 (0) | 0 (0) | ||
| Aspergillus fumigatus | 2 (1.6) | 2 (6.3) | 0.257 | 6 (20) | 3 (4.8) | 0.054 |
| Enteroccocus aerogenes | 0 (0) | 1 (1.6) | 1.000 | 0 (0) | 2 (3.2) | 1.000 |
| Mycobacterium atypical | 0 (0) | 0 (0) | 0 (0) | 0 (0) | ||
| MRSA | 0 (0) | 0 (0) | 0 (0) | 0 (0) | ||
| Fusarium | 0 (0) | 0 (0) | 0 (0) | 1 (1.6) | 1.000 | |
| Streptococcus pneumoniae | 0 (0) | 0 (0) | 0 (0) | 1 (1.4) | 1.000 | |
| Pantoea species | 0 (0) | 0 (0) | 0 (0) | 0 (0) | ||
| Ralstonia picketti | 0 (0) | 1 (1.6) | 1.000 | 0 (0) | 0 (0) | |
| Serratia | 0 (0) | 0 (0) | 0 (0) | 0 (0) | ||
| Scedosporium | 0 (0) | 0 (0) | 0 (0) | 0 (0) | ||
| Paecilomyces | 0 (0) | 0 (0) | 1 (3.3) | 1 (1.6) | 0.548 | |
| Morganella morganii | 0 (0) | 0 (0) | 0 (0) | 0 (0) | ||
| Mycobacterium abscessus | 0 (0) | 0 (0) | 0 (0) | 0 (0) | ||
| Klebsiella | 0 (0) | 0 (0) | 1 (3.3) | 0 (0) | 0.326 | |
| Hafnia alvei | 0 (0) | 0 (0) | 0 (0) | 0 (0) | ||
| Scedosporium | 1 (3.1) | 0 (0) | 0.333 | 1 (3.3) | 0 (0) | 0.326 |
| Hemophilus influenzae | 0 (0) | 0 (0) | 0 (0) | 0 (0) |
MRSA: methicillin resistant Staphylococcus aureus; MSSA: methicillin sensitive Staphylococcus aureus; VRE: vancomycin resistant enterococci.
Statistically significant (P < 0.05) values are in bold.
DISCUSSION
The success of taurolidine as a barrier to line infections had been well published. However, its efficacy in management of airway pathogen colonization in transplantation has not been proved. This study attempts to critically examine both overall long-term survival and freedom from BOS in CF patients and the impact of intraoperative use of taurolidine on bacterial colonization and overall outcome after LTx in this group of patients.
To minimize side effects such as pleural thickening and pleural adhesions, the taurolidine 2% flush has been diluted according to our protocol [17]. A large proportion of the donor lungs in this study were obtained from marginal donors that were partially assessed using EVLP [18–21]. Nonetheless, 5-year survival was 62.2% in the entire CF group being still comparable to the ISHLT registry with 5-year survival rate of 60.96%. Interestingly, the use of taurolidine, which was associated with better postoperative lung function test results, did not affect overall survival: 3- and 5-year survival was comparable between the 2 groups. Also, better FEV1 in the taurolidine group in this study did not translate to a decreased risk of BOS.
In keeping with previous findings [10], this study found PA to be the most common bacterial pathogen colonizing CF patients, with baseline frequency of 83.3% in both the taurolidine and non-taurolidine groups. A statistically significant reduction in PA colonization over 1-year follow-up in the taurolidine group compared with the non-taurolidine group documented in this study may potentially translate into improved long-term outcomes in studies of larger/multicentre cohorts. Several studies have suggested that colonization of airways with Gram-negative bacteria, such as PA, represents a significant risk factor for BOS and for late mortality [22]. Nonetheless, according to our analysis, there were no statistical differences in terms of BOS and overall cumulative survival when comparing patients initially colonized with PA and those negative for this pathogen. However, our findings also showed that incidence of BOS and overall cumulative survival significantly worsened when PA colonization persisted in the BAL culture 3 months after LTx, which was of practical significance from a clinical point of view, with emphasis on reducing bacterial load in an effort to prevent BOS and improve overall survival.
BCC is also an important opportunistic pathogen that may cause lung infections in CF patients and is associated with higher mortality after LTx [23, 24]. Hence, CF patients with BCC colonization are usually suspended from the waiting list due to increased mortality risk [25]. Nevertheless, in our institution, we transplanted 3 (7.1%) patients from the taurolidine and other 3 (4.2%) patients from the non-taurolidine group colonized with BCC. Over the follow-up, we observed a reduction in BCC colonization to 3.1% at 3 months and complete eradication at 1 year after LTx in the taurolidine group. In the non-taurolidine group, BCC colonization persisted with 1.6% at 1 year. Thus, taurolidine may possibly have a beneficial effect on eradication of BCC, although a larger population may need to be studied to achieve statistical significance.
SM is an opportunistic, pan-resistant pathogen, which can also be involved in the development of chronic pulmonary infections in CF patients. Similar to BCC colonization, the proportion of patients with SM colonization in the taurolidine group decreased over the follow-up from 7.1% at baseline to 3.1% at 3 months and 0% at 1 year, whereas SM in the non-taurolidine group could not be fully eradicated. Evidence demonstrating the impact of SM on survival after LTx in CF patients is sparse. Hadjiliadis et al. [26] identified several pan-resistant bacteria in 103 CF patients undergoing LTx with only 1 patient colonized with SM. Even though the results showed a slightly decreased survival in CF patients colonized with multiresistant bacteria, it is difficult to draw any conclusion regarding SM.
It remains unclear whether taurolidine use should be aimed at preventing airway colonization or pleural space sterilization. This is a potential topic for future studies on using taurolidine in LTx for patients with CF. As long as this remains debatable, taurolidine in our centre has been used for the treatment of both bronchi and pleural cavities to achieve higher efficiency. However, the left main bronchus could not be completely flashed with taurolidine due to the use of double-lumen tube.
Limitations
This study is a retrospective analysis of a single institution. Data collection may suffer from variability in data entry. Also, selection bias and other potential confounders may influence our results. The attempt to control for bias using propensity score matching resulted in further dropouts of patients and a therefore relatively low statistical power. As no ideal matching is possible in such a small patient cohort, the correlation structure of matched pairs is also limited. Therefore, standard statistical tests, which do not address the correlation structure in paired sample data, were used. Since 2010, a new clinical director of transplantation introduced the use of taurolidine that was used in a proportion of CF patients by several consultants. For this reason, a shorter follow-up is available for the taurolidine group. Technical aspects of taurolidine administration need improvement, as application of the agent via the endotracheal tube might not be optimal, particularly for the exposure of the left main bronchus that could not be completely flushed due to the use of a double-lumen tube.
CONCLUSION
Our preliminary results show that the use of taurolidine might lead to improved FEV1 at 3 and 6 months after LTx. Moreover, taurolidine flush might be associated with a reduced proportion of patients colonized with multiresistant pathogens, particularly with PA. However, this study did not find any improvement in freedom from BOS and cumulative survival associated with taurolidine use, possibly due to the limited patient population studied. Therefore, larger/multicentre studies are warranted to clarify this issue. No potential complications or disadvantages related to taurolidine use were found in this study. The authors recommend the routine use of taurolidine for flushing the bronchus and washout the chest cavity after pneumonectomy for CF patients undergoing LTx.
Conflict of interest: none declared.
REFERENCES
Author notes
Presented to the 96th Annual Meeting of the American Association for Thoracic Surgery, Baltimore, MD, USA, 14–18 May 2016.
Mohamed Zeriouh and Anton Sabashnikov share the first authorship and contributed equally to this work.
