


Performance status [Eastern Cooperative Oncology Group (ECOG)] is a physician-assigned score indicating a patient's fitness for treatment. Functional assessment of cancer therapy-esophagus (FACT-E) is a patient-reported, health-related quality-of-life (HRQOL) instrument containing an oesophageal cancer subscale (ECS). Our objective was to assess the discriminative ability of pretreatment FACT-E and ECS when compared with performance status in predicting survival in patients with Stage II–III oesophageal cancer.
Patient data from four prospective studies were pooled together. These four studies included oesophageal patients who received chemoradiation either as neoadjuvant therapy or as definitive therapy. Three separate Cox regressions were performed considering FACT-E, ECS and ECOG as the main predictors, respectively. Receiver-operating characteristics analyses were performed.
Of the 120 curative intent patients, 39.8% (n = 51), 58.6% (n = 75) and 1.6% (n = 2) had ECOG 0, 1 and 2, respectively. On Cox regression analysis, pretreatment FACT-E (P = 0.04) and ECS (P = 0.004) but not ECOG (P = 0.27) were independently associated with overall survival. ECOG could not discriminate between survivors and non-survivors (P = 0.28) with an area under the curve (AUC) of 0.56 [95% confidence interval (CI): 0.45–0.66], whereas FACT-E (P = 0.02) and ECS (P < 0.001) were discriminative with AUC = 0.63 (95% CI: 0.52–0.73) and AUC = 0.69 (95% CI: 0.60–0.79), respectively.
In patients with Stage II–III oesophageal cancer being considered for curative therapy, pretreatment FACT-E and ECS have better discrimination for survival than does ECOG. The majority of patients were ECOG 0/1. Thus, these patient-derived scores were able to discriminate survivors from non-survivors even within this constrained range of clinician-assigned performance status. This highlights the potential utility of FACT-E and ECS as prognostic tools.
INTRODUCTION
Oesophageal cancer has a significant effect on health-related quality of life (HRQOL) [1]. Poor HRQOL has been shown to be associated with poorer long-term survival in different cancers [2–7]. Since oesophageal cancer may initially present with significant HRQOL issues, it seems likely that pretreatment HRQOL may be an important prognostic tool. We have previously shown that higher pretreatment HRQOL measures were independently associated with better overall survival [8]. In our previous study, we focused on the functional assessment of cancer therapy-esophagus (FACT-E), which is an HRQOL instrument validated in oesophageal cancer patients [8]. It is comprised of a general component (FACT-G) and an oesophageal cancer subscale (ECS) [8].
Performance status, which is a clinician-assigned score, is extensively used in oncology research and practice. The two most commonly used measures are the Karnofsky score and Eastern Cooperative Oncology Group (ECOG) (also known as Zubrod or World Health Organization score). Compared with HRQOL, there is more literature on the relationship between performance status and outcomes. Performance status has been shown to be associated with short-term as well as long-term survival outcomes after cancer treatment [9–13].
HRQOL measures are not necessarily an improvement on current performance status measures but rather may serve as important adjuncts providing complementary and potentially novel information to both clinician and patient. Although the ECOG score and the Karnofsky score are easier to determine than FACT-E, they are general status indicators and may not be as sensitive to important disease-specific elements conveyed by FACT-E in oesophageal cancer patients. More importantly, however, FACT-E is a patient-reported measure rather than a clinician-assigned one. We hypothesize that because FACT-E is patient reported, it likely represents a more accurate and dynamic description of the patient's disease-specific and general status than a measure assigned by a clinician based on one assessment at a static time point. Furthermore, we believe that decision-making that is based on ‘performance status’ is likely to be more acceptable to patients if it incorporates their reported experience (i.e. FACT-E) rather than entirely based on the clinician's estimate.
Thus, our objective was to assess the discriminative ability of pretreatment HRQOL measures (FACT-E and ECS) and performance status (ECOG) in predicting overall survival in patients with locally advanced cancer of the gastro-oesophageal junction (GEJ) or thoracic oesophagus.
METHODS
Patient population
Data from four prospective, non-randomized studies in three large Canadian academic hospitals (Toronto General Hospital, Princess Margaret Cancer Centre, The Ottawa Hospital) were combined. Details about these studies can be found in our previous paper [8]. All studies were approved by institutional ethics boards [14, 15]. These studies included consecutive eligible patients with clinical Stage II–IV cancer of the gastro-oesophageal junction or with the thoracic oesophagus who received chemotherapy and concomitant radiation either as neoadjuvant therapy or as part of bimodality therapy without surgery. In this study, our interest was in patients with locally advanced (non-metastatic) disease treated with curative intent. Further details about our patient population as well the surgical techniques used can be found in our previous paper [8].
Clinical follow-up after therapy occurred every 3 months until 2 years post-therapy followed by every 6 months until 5 years post-therapy. Radiological follow-up occurred with at least yearly computed tomography or chest X-ray for 5 years. Staging was defined according to seventh edition of the AJCC TNM Staging system. Pathological stage was used to describe those who underwent surgery, whereas clinical stage was used to describe those who did not have surgery (Table 1).
Description of population
| Variable | Number (n = 128) |
|---|---|
| Mean age (standard deviation) | 60.1 (10.3) |
| Adenocarcinoma, n (%) | 92 (71.9) |
| Stage (%) | |
| II | 56 (43.8) |
| III | 64 (50.0) |
| IV | 8 (6.2) |
| Received chemotherapy, n (%) | 101 (78.9) |
| Received radiation therapy, n (%) | 87 (68.0) |
| Surgery, n (%) | 109 (85.2) |
| Received adjuvant sunitinib, n (%) | 14 (10.9) |
| Received chemoradiation + surgery, n (%) | 71 (55.5) |
| Received chemotherapy + surgery, n (%) | 15 (11.7) |
| Received surgery only, n (%) | 24 (18.8) |
| Curative intent therapy, n (%) | 120 (93.8) |
| Survivors at last follow-up, n (%) | 53 (41.4) |
| ECOG performance status, n (%) | |
| 0 | 51 (39.8) |
| 1 | 75 (58.6) |
| 2 | 2 (1.6) |
| Mean FACT-E (standard deviation) | 126.26 (26.8) |
| Mean ECS (standard deviation) | 47.1 (12.7) |
HRQOL instrument
The FACT general (FACT-G) is a general HRQOL instrument validated for use in any cancer; it consists of 28 questions covering multiple domains of well-being using a 5-point Likert scale [14]. A disease-specific module, the ECS was validated and added to the FACT-G to result in the FACT-E for oesophageal cancer [14]. The ECS consists of 17 items described in our previous paper [8]. Higher scores denote better quality of life. All patients completed FACT-E at baseline; surveys were self-administered at the time of the first consultation with the thoracic surgeon or medical or radiation oncologist prior to the initiation of any therapies.
Statistical analysis
Descriptive statistics were provided with mean and standard deviation for continuous factors and frequencies and percentages for categorical factors. Continuous data were assessed for distributional normality by the inspection of histograms and quantile–quantile plots and were wound to be normally distributed; thus, they were analysed using t-test t. Fisher's exact tests were used for categorical factors. Multivariable Cox regression analysis was conducted on time-to-event end-points such as overall survival.
FACT-E, ECS and ECOG were the main predictors of interest. We performed separate Cox regression analyses including only one of those three predictors for each single model (either ECS, FACT-E or ECOG). A forced-entry method was used to control for the following clinical variables: age, stage, histology (adenocarcinoma versus non-adenocarcinoma) and whether the patient received surgery, chemotherapy, radiation or adjuvant sunitinib therapy. The FACT-E and ECS scores were dichotomized to high- and low-HRQOL groups based on the median value of FACT-E and ECS scores. Since our interest was in patients with locally advanced (non-metastatic) disease, the primary analyses excluded Stage IV patients. Thus, we subsequently performed sensitivity analyses including Stage IV patients as well. As further sensitivity analyses, we also performed the univariable and Cox regression analyses using clinical stage uniformly for all patients. Additional sensitivity analyses were conducted with FACT-E and ECS as continuous variables and as quartiles. Survival probabilities were estimated using the Kaplan–Meier method. Hazard ratios and 95% confidence interval (CI) were provided.
To test for prognostic ability, three multivariable logistic regression models were constructed with the outcome being ‘survival for more than 2 years’. This outcome was chosen as it was a clinically relevant period of survival that would warrant aggressive therapy. All patients had follow-up for 2 years. Those who had follow-up of <2 years were those who died before the 2-year mark and thus their follow-up time ended at the time of death. The main predictor of interest in the first model was pretreatment FACT-E; this model did not include ECS or ECOG. Pretreatment stand-alone ECS was the main predictor of interest in the second model; this model did not include the overall FACT-E or ECOG. Pretreatment ECOG was the main predictor of interest in the third model; this model did not include the overall FACT-E or ECS. The purpose of these models was to assess whether they could predict 2-year survivors using only data available at presentation (prior to any treatments). Thus, the other covariates in the models were age, clinical stage and histology. These models were then used to calculate predicted group membership (i.e. ‘2-year survivor’ or ‘not 2-year survivor’) and receiver-operating characteristics (ROC) analyses were performed to assess the ability of each model to accurately discriminate between those who actually survived to 2 years and those who did not. The ROC analyses result in area under the curve (AUC), which is a composite measure of the sensitivity and specificity of the given model. An AUC of 1.0 represents perfect discrimination by the model between two states (i.e. survivor versus non-survivor), whereas an AUC of 0.5 represents no ability to discriminate.
Two-sided test was used for all tests of significance with significance level at 0.05. Model significance was tested by the omnibus test of model coefficients. This test assesses whether the model (with all coefficients of included predictors) results in more explained than unexplained variance in the data and thus is a measure of the model's statistical significance. Statistical analyses were performed using the SAS statistical package (version 9.3; SAS, Institute, Inc., Cary, NC, USA, 2011).
RESULTS
In this dataset, there were 207 patients treated between 1996 and 2014. Of these, 128 had available FACT-E and ECOG scores. Of these 128, 115 (89.8%) patients were treated at University Health Network (Toronto General Hospital and Princess Margaret Cancer Centre). Completion rate of baseline FACT-E survey was 100%. The mean age was 60.1 ± 10.3 years and 92 patients (71.9%) had adenocarcinoma.
The majority of patients (67.2%, n = 86) had either neoadjuvant chemoradiation or perioperative chemotherapy (preoperative and postoperative). An additional 24 (18.8%) had surgery only and the majority of the remaining patients received either definitive or palliative chemoradiation therapy. Fourteen patients (10.9%) completed 6–12 months of therapy with adjuvant sunitinib.
Univariable analysis for overall survival (excluding Stage IV patients)
| Predictor | Survivors (n = 48) | Non-survivors (n = 72) | P-value |
|---|---|---|---|
| Mean age (standard deviation) | 59.0 (11.4) | 61.3 (9.4) | 0.24 |
| Adenocarcinoma, n (%) | 34 (70.8) | 54 (75.0) | 0.68 |
| Stage (%) | |||
| II | 25 (52.1) | 23 (47.9) | 0.36 |
| III | 31 (43.0) | 41 (57.0) | |
| Received chemotherapy, n (%) | 40 (83.3) | 55 (76.4) | 0.49 |
| Received radiation therapy, n (%) | 36 (75.0) | 47 (65.3) | 0.32 |
| Surgery, n (%) | 45 (93.8) | 62 (86.1) | 0.24 |
| Received adjuvant sunitinib, n (%) | 9 (18.8) | 5 (6.9) | 0.08 |
| ECOG performance status, n (%) | |||
| 0 | 20 (42.6) | 27 (57.4) | 0.38 |
| 1 | 26 (36.1) | 46 (63.9) | |
| 2 | 1 (100) | 0 | |
| Mean FACT-E (standard deviation) | 133.5 (25.3) | 122.3 (25.8) | 0.02 |
| Mean ECS (standard deviation) | 52.4 (11.2) | 43.5 (12.4) | <0.001 |
P-values in bold are statistically significant.
Multivariable Cox regression analysis for overall survival using FACT-E as the main predictor (excluding Stage IV patients) (n = 120)
| Predictor | Hazard ratio (95% CI) | P-value |
|---|---|---|
| Age (Hazard ratio for 1 year increase in age) | 1.01 (0.99–1.03) | 0.39 |
| Adenocarcinoma histology | 1.60 (0.90–2.84) | 0.11 |
| Stage (II versus III) | 1.08 (0.65–1.80) | 0.76 |
| Received chemotherapy | 0.34 (0.14–0.82) | 0.02 |
| Received radiation therapy | 1.34 (0.65–2.76) | 0.43 |
| Received adjuvant sunitinib | 0.44 (0.16–1.19) | 0.11 |
| Surgery | 0.52 (0.24–1.15) | 0.11 |
| Year of treatment | ||
| 2000–04 | Reference | 0.006 |
| 2005–09 | 2.41 (1.38–4.20) | |
| 2010–14 | 1.13 (0.41–3.15) | |
| FACT-E (low versus high) | 0.56 (0.32–0.97) | 0.04 |
P-values in bold are statistically significant.
Multivariable Cox regression analysis for overall survival using ECS as the main predictor (excluding Stage IV patients)
| Predictor | Hazard ratio (95% CI) | P-value |
|---|---|---|
| Age (Hazard ratio for 1 year increase in age) | 1.01 (0.99–1.03) | 0.42 |
| Adenocarcinoma histology | 1.60 (0.90–2.84) | 0.11 |
| Stage (II versus III) | 1.07 (0.65–1.78) | 0.79 |
| Received chemotherapy | 0.39 (0.17–0.90) | 0.03 |
| Received radiation therapy | 1.40 (0.68–2.92) | 0.36 |
| Received adjuvant sunitinib | 0.38 (0.14–1.03) | 0.06 |
| Surgery | 0.47 (0.21–1.02) | 0.06 |
| Year of treatment | ||
| 2000–04 | Reference | 0.02 |
| 2005–09 | 2.17 (1.24–3.79) | |
| 2010–14 | 1.39 (0.49–3.91) | |
| ECS (low versus high) | 0.46 (0.28–0.78) | 0.004 |
P-values in bold are statistically significant.
Multivariable Cox regression analysis for overall survival using ECOG as main predictor (excluding Stage IV patients)
| Predictor | Hazard ratio (95% CI) | P-value |
|---|---|---|
| Age (Hazard ratio for 1 year increase in age) | 1.01 (0.99–1.03) | 0.34 |
| Adenocarcinoma histology | 1.65 (0.92–2.96) | 0.10 |
| Stage (II versus III) | 1.14 (0.69–1.90) | 0.60 |
| Received chemotherapy | 0.27 (0.12–0.63) | 0.002 |
| Received radiation therapy | 1.11 (0.54–2.27) | 0.78 |
| Received adjuvant sunitinib | 0.41 (0.15–1.14) | 0.09 |
| Surgery | 0.45 (0.19–1.03) | 0.06 |
| Year of treatment | ||
| 2000–04 | Reference | 0.03 |
| 2005–09 | 2.09 (1.20–3.66) | |
| 2010–14 | 1.21 (0.43–3.40) | |
| ECOG performance status | 1.35 (0.79–2.29) | 0.27 |
P-values in bold are statistically significant.
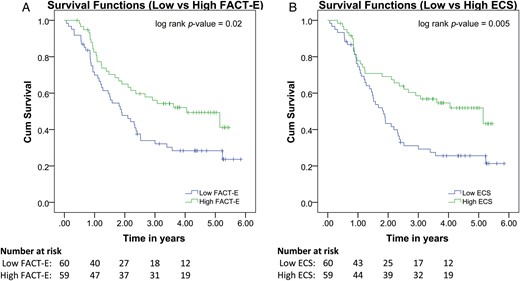
Pretreatment FACT-E and ECS are associated with overall survival. Kaplan–Meier curve showing results of Cox regression with pretreatment FACT-E and ECS stratified into low and high groups. Low pretreatment FACT-E and ECS are associated with worse overall survival.
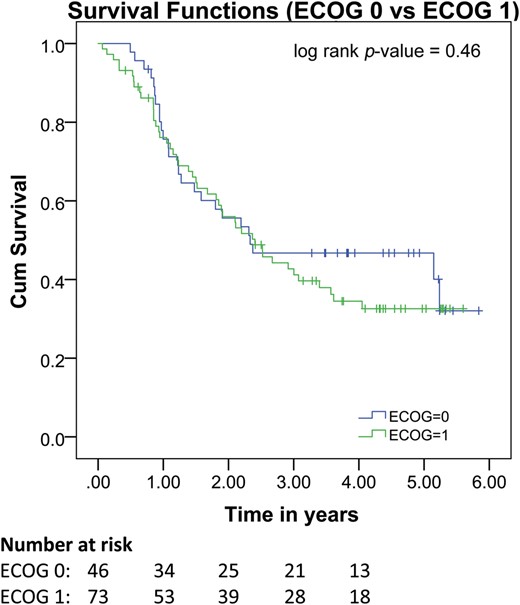
Pretreatment ECOG is not associated with overall survival. Kaplan–Meier curve showing results of Cox regression analysis stratified by pretreatment ECOG status. Pretreatment ECOG is not associated with overall survival.
The multivariable logistic regression for predictors of 2-year survival (using only variables known prior to any treatment) showed that either FACT-E or ECS, when added to routine clinical data, improves the ability of the model to predict 2-year overall survival; this replicated our previous findings that were in a larger group of patients [8]. The model including FACT-E, age, histology and clinical stage significantly predicted 2-year (omnibus test of model coefficients: P = 0.04) and also showed that FACT-E was independently associated with 2-year survival (P = 0.007). The model including ECS, age, histology and clinical stage significantly predicted 2-year survival (omnibus test of model coefficients: P = 0.001) and also showed that ECS was independently associated with 2-year survival (P < 0.001). However, the model including ECOG, age, histology and clinical stage did not significantly predict 2-year survival (omnibus test of model coefficients: P = 0.67) and also showed that ECOG was not independently associated with 2-year survival (P = 0.86).
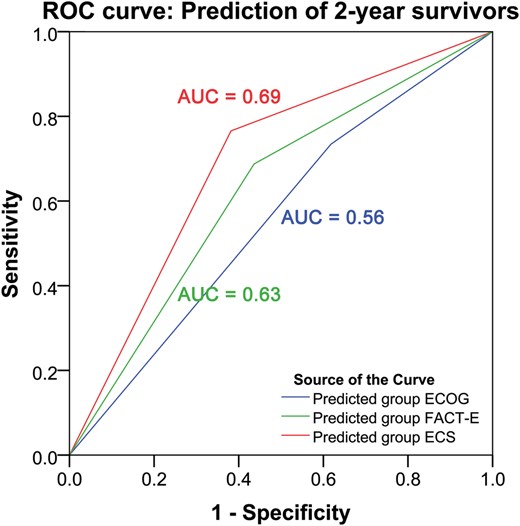
Pretreatment FACT-E and ECS but not ECOG discriminate 2-year survivors. ROC curve analysis showed that ECOG could not significantly discriminate between those who actually survived to 2 years and those who did not (P = 0.28). ROC curve analysis showed that both FACT-E and ECS were able to significantly discriminate between those who actually survived for 2 years and those who did not (P = 0.02 and P < 0.001, respectively).
DISCUSSION
In patients with Stages II and III oesophageal cancer being considered for curative intent therapy, higher pretreatment FACT-E and ECS (both patient-reported) were independently associated with better overall survival, whereas pretreatment performance status as measured by ECOG score was not associated with overall survival. ROC analysis confirmed our previous findings that addition of either FACT-E alone or ECS alone to statistical models will enhance the ability to predict 2-year survival in analyses that consider only variables available prior to treatment [8]. These current analyses also support our previous finding that these HRQOL measures are the predictors that drive the ability of these particular models (including age, stage and histology) to predict 2-year survival. These current analyses also support our previous finding that ECS appears to be a stronger discriminator of 2-year overall survival than FACT-E; in this study, ECS yielded an AUC of 0.69 and FACT-E yielded an AUC of 0.63. This range of AUC would be considered to provide moderate to good level of discrimination. Furthermore, ROC analysis showed that those same models including ECOG score (rather than FACT-E or ECS) could not significantly discriminate between those who survived to 2 years and those who did not. Chemotherapy and year of treatment were also associated with survival. Use of chemotherapy is known to be associated with improved survival [16]. It seemed that survival was lower in the middle time period (2005–09) compared with that of the other two time periods in the study. It is unclear why this would be the case and warrants further investigation. In any case, for the purposes of this study, our analyses have controlled for the effect of year of treatment.
Performance status is a clinician-assigned score extensively used in oncology research and practice. ECOG score is typically used at our institutions. Performance status has been shown to be associated with survival outcomes after the treatment of cancer [9–13, 17–21]. The majority of studies have been in advanced, metastatic cancer patients in palliative care [17–21]. Furthermore, oesophageal cancer patients were either not included in these studies or comprised very small proportions of the sample populations included [9–13, 17–21]. Studies that have included earlier stage and operable cancers also showed that better pretreatment performance status is associated with better survival [22–24].
There are few studies exploring pretreatment performance status in the prognostication of oesophageal cancer survival outcomes. Furthermore, studies that investigate both pretreatment HRQOL and performance status measures do not report consistent associations of either measure with survival. Bergquist et al. performed survival analyses in inoperable oesophageal cancer patients and found that two components of HRQOL measures and evidence of metastatic disease but not performance status were independent predictors of overall survival [25]. The two components of HRQOL measures were the fatigue and reflux components of the European Organization for Research and Treatment of Cancer QLQ-30 (EORTC QLQ-30) and the oesophageal cancer disease-specific module QLQ OE18 [1, 26]. Performance status was measured by the Karnofsky score [25]. McKernan et al. investigated HQROL and ECOG score in 152 patients with either advanced or potentially curable GEJ tumours; they found that only stage, treatment type and the appetite component of the EORTC QLQ-30 but not ECOG score were independent predictors of survival [27]. Chau et al. pooled data on 1080 patients from 3 multicentred randomized controlled trials (RCTs) in locally advanced and metastatic GEJ tumours and found that performance status but not HRQOL measures independently predicted overall survival [23]. In that study, performance status was measured by ECOG score and was dichotomized as ‘0 and 1’ vs ‘2 or 3’. ECOG score distribution was 169, 639, 246, 6 for ECOG scores 0, 1, 2 and 3, respectively [23]. This distribution highlights the common occurrence that most study populations are heavily weighted towards ECOG 0 and 1 patients and rarely towards patients above ECOG 2. This distribution is even more skewed in studies including definitive chemotherapy or surgical therapy [23, 27]. The largest study is a pooled analysis of 30 European RCTs that found that pretreatment performance status was associated with long-term survival; of the 11 cancer sites included in this analysis, they used data from 1 RCT on 65 oesophageal cancer patients, all of whom had metastatic disease [24]. Although performance status was found to be independently associated with survival in the global analysis (including all cancer sites), it was not found to be an independent predictor of survival in oesophageal cancer patients when HRQOL measures were also included in the prediction models [24]. This suggests that HRQOL measures may have been stronger predictors of survival than performance status or that there may have been some degree of collinearity between HRQOL and performance status measures.
Thus, the existing literature in this area does not consistently support either pretreatment performance status or HRQOL measures as predicting survival. In our study, the AUC of the model including pretreatment ECOG (AUC = 0.56) was lower than those reported in the studies which have reported that ECOG was a predictor of survival (e.g. AUC = 0.63–0.73) [17, 18, 20]. However, these studies were conducted in populations with advanced/non-operable cancers with mixed primaries, of which oesophageal cancer tended to be a minority. There do not appear to be any studies with similar populations (i.e. operable oesophageal cancer) investigating the discriminatory ability of performance status that can be directly compared with our study. However, there are two key issues regarding the nature and use of ECOG score in this study that warrant discussion. In our study, we used ECOG score rather than Karnofsky performance status. It could be argued that perhaps a wider range of measurement (i.e. 100-point scale like Karnofsky) rather than a 3-category measure (i.e. ECOG 0–2) might have been able to discriminate better between survivors and non-survivors. However, studies using the Karnofsky score rather than ECOG score have not discriminated more frequently between survivors and non-survivors in oesophageal cancer [23–25]. In our study, the majority of patients had ECOG 0 and 1. The preponderance of ECOG 0/1 patients is a reflection of the preselected patients that were recruited into our studies and who are often recruited into most studies of definitive therapy. It could be argued that we failed to identify an association between pretreatment ECOG and survival because our range of ECOG scores was too constrained in the ‘high-functioning’ ECOG 0 and 1 groups; in other words, it could be because there may not be much difference in the expected survival of ECOG 0 versus ECOG 1 patients. Although this may be a true limitation of this study, several studies have shown that patients with ECOG 0 do indeed have significantly different overall survival when compared with those with ECOG 1 [18, 22]. Furthermore, FACT-E and ECS were able to discriminate survivors from non-survivors even within this constrained range of performance statuses. Thus, our findings are more likely to reflect improvement in discrimination by the patient-derived HRQOL measures.
A strength of our study is that we controlled for many important confounding variables, including stage and treatment received. Furthermore, we did so using a forced-entry method which simultaneously controls for all included predictors and confounders, rather than a step-wise elimination method that only controls for those included in the final model. Another strength of our study is that we have performed multiple sensitivity analyses which have all replicated the findings of our primary analyses. A limitation is that these data were derived from patients enrolled in prospective studies and thus may not be generalizable to patients that are not actively being monitored in a prospective manner.
In patients with Stages II and III oesophageal cancer being considered for curative therapy, pretreatment FACT-E and ECS but not ECOG were independently associated with overall survival. Pretreatment FACT-E and ECS have significantly better discrimination for survival than pretreatment ECOG. This study further supports our previous findings that ECS appears to be a stronger predictor/discriminator of survival than FACT-E [8]. The majority of patients were ECOG 0 and 1. Thus, these patient-reported HRQOL scores were able to discriminate survivors from non-survivors even within this constrained range of clinician-assigned performance status. This highlights the potential utility of FACT-E and especially ECS as prognostic tools in practice and trials.
Funding
This work was supported by the Kress Family Chair in Esophageal Cancer.
Conflict of interest: none declared.
ACKNOWLEDGEMENT
We acknowledge the support of the Kress Family Chair in Esophageal Cancer.
REFERENCES
APPENDIX. CONFERENCE DISCUSSION
Dr B. Louie (Seattle, WA, USA): Do you know whether you can alter the ECS score? If I come in as a patient and I don't have a very good ECS score, can you improve my ECS score in the way that we can improve performance status, and do patients get the benefit of having a higher ECS score? Do you have that data?
Dr Kidane: We have not looked at modifying the ECS score. This is data that is on baseline alone prior to any treatment. We do have data on tracking the changes in ECS or any of the overall FACT-E as treatment happens, and there is actually a difference depending on what time point you look at.
As to your question about whether we can, with some sort of rehabilitation or some other factors, enhance the ECS and what impact that has on overall outcome, we don't have that data.
Dr Louie: Well, I think you are sort of getting at it by tracking over time. But you see patients who come into the clinic. They are malnourished, you can put a feeding tube in them, you can get them to some rehab and then they look a whole lot different; then they go through chemo and they look a whole lot different. So the question is, the baseline is one thing, but can I make an intervention and improve patients to get them through surgery and still have that benefit? I would encourage you to continue the research.
Dr Kidane: Thank you.
Dr T. Lerut (Leuven, Belgium): Again, to make it clear, your baseline, was it at the time of diagnosis or was it after the induction therapy before the surgery?
Dr Kidane: That is a very good question. It's at the time of the first visit with the thoracic surgeon. So they have not had any therapy whatsoever.
Dr Lerut: So there might be some interference, because during the therapy there might be a change in the situation to begin with. Secondly, why did you take ECOG and not, for instance, the EORTC questionnaire, the OE-18? These are things that are more often used over here. I think we rarely use ECOG score.
Dr Kidane: Those are very good questions. In terms of your first question, we have seen that it does change over the course of therapy. It is difficult to tease out some of the things, because, as Dr Louie mentioned, patients may get better nutrition and feel better initially but then they get chemo-radiation therapy and then they feel really lousy. So that is something we have to look at.
Regarding your second point, this actually came out partially as a result of a discussion of our initial findings, that FACT-E or ECS predict overall survival, and then the question came out, well, that's great, but what does it matter? It is a complicated questionnaire that takes 17 or more questions at least and patients have to fill this out. Don't we already know that things like ECOG status or Karnofsky status already predict overall survival? So why do we need this? And that's a fundamentally different question than the one you asked. There has been data to show that things like the OE-18 and EORTC tools can predict overall survival. This is a different question, meaning what additional benefit do they have compared to something simple like the ECOG status? And I think our data is starting to show that there is actually richer information in the patient experience that is not captured by those things.
But you can see part of the issue is that the range of ECOG status in these groups (because they were part of trials) was already constrained; they were 0 and 1. So potentially if we allowed all patients to come in 0 to 4, there may be more separation, but within this narrow range the patient experience itself can define and separate out survivors from non-survivors.
Author notes
Presented at the 23rd European Conference on General Thoracic Surgery, Lisbon, Portugal, 31 May to 3 June 2015.
