


Few data are currently available on the factors associated with survival in oesophageal cancer patients who achieve pathological complete response (pCR) after chemoradiotherapy (CRT). Using a nationwide database, we investigated the predictors of survival in this patient group.
Data were retrieved from the Taiwan Cancer Registry to identify patients with oesophageal squamous cell carcinoma (OSCC) who achieved pCR after CRT followed by oesophagectomy between 2008 and 2013. The median number of dissected nodes (20) was used as the cut-off to classify the extent of lymph node dissection (LND). Tumour location was defined according to the seventh edition of the American Joint Committee on Cancer staging system. Cox proportional hazard regression analyses were used to identify factors associated with survival.
Of the 1103 patients who underwent CRT followed by surgery, 319 (28.9%) achieved pCR. Thirty- and 90-day mortality rates were 3.5 and 4.7%, respectively. The 3-year overall survival rate was 55.9%. Multivariate Cox survival analysis identified age ≥55 years [hazard ratio (HR): 1.72, 95% confidence interval (CI): 1.07 to 2.78, P = 0.025], an LND number of <20 (HR: 1.62, 95% CI: 1.01 to 2.61, P = 0.047) and lesions located in the upper third (HR: 2.35, 95% CI: 1.18 to 4.65, P = 0.015) as adverse prognostic factors for survival in pCR patients.
Patient age ≥55 years, upper third lesions and an LND number of <20 are adverse prognostic factors in OSCC patients who achieve pCR following CRT. High-risk patients should be strictly followed.
INTRODUCTION
Chemoradiotherapy (CRT) followed by surgery is currently considered the mainstay of treatment with curative intent in patients with locally advanced oesophageal cancer [1, 2]. The achievement of a pathological complete response (pCR)—defined as complete tumour regression in both the resected oesophagus and sampled lymph nodes (LNs) (ypT0N0)—represents the hallmark of successful CRT and portends a favourable prognosis [3–5]. Previous studies have shown that 17−51% of oesophageal cancer patients can achieve pCR following CRT [3–9]. Although no adjuvant treatment is recommended for individuals who show pCR, ∼30% of these patients will ultimately develop disease recurrence [4, 6, 8–10]. In this context, the identification of reliable prognostic factors in patients who achieve pCR is of paramount importance for selecting the most appropriate therapeutic options according to the individual risk profile.
Few studies to date have specifically focused on the prognostic factors for patients with oesophageal carcinoma who achieve pCR [4, 6]. Moreover, the available reports are limited either by small sample sizes or the inclusion of different histological subtypes into a unique study cohort [3, 4, 8, 9]. Starting from these premises, we designed the current retrospective research to identify the predictors of survival in patients with oesophageal squamous cell carcinoma (OSCC) who achieved pCR after CRT. To this aim, data from a nationwide cancer registry database were retrieved.
MATERIALS AND METHODS
Study population and data collection
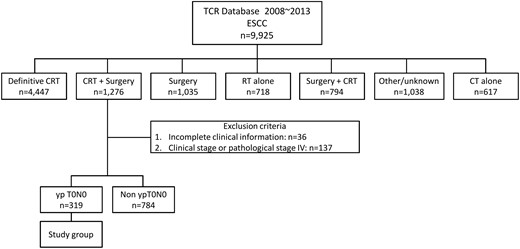
Flow of patients through the study. CRT: chemoradiotherapy; OSCC: oesophageal squamous cell carcinoma; RT: radiotherapy; CT: chemotherapy.
Definitions
pCR was diagnosed when malignant cells were absent in all of the resected pathological specimens, including both the primary tumour site and sampled LN. We defined overall survival as the time elapsed from the date of oesophagectomy to the date of death from any cause or censored on 31 December 2013. The date of death was cross-checked using death certificates available from the Taiwanese Ministry of Health and Welfare (http://www.mohw.gov.tw/).
Statistical analysis
The significant predictors of survival were initially investigated with univariate Cox regression analyses. Independent variables significantly associated with survival were identified through risk-adjusted analyses based on multivariable Cox regression models. All calculations were performed using SAS version 9.3 (SAS Institute Inc., Cary, NC, USA) and SPSS version 20.0 (SPSS Inc., Chicago, IL, USA). Two-tailed P-values <0.05 were considered statistically significant.
RESULTS
General characteristics of the study patients
The sample consisted of 297 males and 22 females (mean age: 54.4 years, range: 23–75 years). The majority of tumours occurred in the middle third of the oesophagus (42.6%). The mean tumour length was 5.5 cm (range: 1–20 cm; Table 1). Pretreatment clinical stage was I−II in 66 patients and III in 253 patients. A total of 272 patients had clinical evidence of LN metastases. Staging was performed according to the seventh edition of the AJCC staging manual.
General characteristics of the study participants (n = 319)
| Variables | Value | Percentage |
|---|---|---|
| Age, years | ||
| Mean | 54.4 (SD: 8.6) | |
| Median | 54 | |
| Range | 23–75 | |
| Age class | ||
| <55 years | 163 | 51.1 |
| ≥55 years | 156 | 48.9 |
| Sex | ||
| Male | 297 | 93.1 |
| Female | 22 | 6.9 |
| Clinical stage | ||
| I/II | 66 | 20.7 |
| III | 253 | 79.3 |
| Clinical T stage | ||
| 1/2 | 48 | |
| 3 | 236 | |
| 4 | 35 | |
| Clinical N stage | ||
| N0 | 47 | 14.7 |
| Non-N0 | 272 | 85.3 |
| Tumour length, cm | ||
| Mean | 5.5 (SD: 2.7) | |
| Range | 1–20 | |
| Tumour location | ||
| U | 41 | 12.7 |
| M | 136 | 42.6 |
| L | 63 | 19.6 |
| Unknown | 79 | 25.1 |
| Radiation dose, Gy | ||
| <40 | 29 | 9.1 |
| 40−50 | 181 | 56.7 |
| >50 | 109 | 34.2 |
| Time from RT to surgery (days) | ||
| Mean | 55.5 (SD: 30.3) | |
| Median | 50 | |
| Time from RT to OP | ||
| <7 weeks | 147 | 46.2 |
| ≥7 weeks | 171 | 53.8 |
| LND, number | ||
| Mean | 24.9 (SD: 16.0) | |
| Median | 20 | |
| LND class | ||
| <20 nodes | 143 | 44.8 |
| ≥20 nodes | 176 | 55.2 |
Data are given as counts and percentages, means ± standard deviations, or ranges (as appropriate).
LND: lymph node dissection; U: upper third of the oesophagus; M: middle third of the oesophagus; L: lower third of the oesophagus; RT: radiotherapy; OP: operation.
The mean and median RT doses were 46 and 50 Gy, respectively. The mean and median number of dissected LN in the entire study cohort were 24.9 and 20, respectively (range: 0–90; interquartile range: 13–35). Postoperative 30- and 90-day mortality rates were 3.5% (38 patients) and 4.7% (52 patients), respectively.
Survival data
Univariate and multivariate survival analyses of factors affecting survival
| Variables | Univariate analysis | Multivariate analysis | ||||
|---|---|---|---|---|---|---|
| cHR | 95% CI | P-value | aHR | 95% CI | P-value | |
| Age, years | ||||||
| <55 | 1 | 1 | ||||
| ≥55 | 1.67 | 1.14–2.46 | 0.01 | 1.72 | 1.07–2.78 | 0.03 |
| Clinical stage | ||||||
| I/II | 1 | 1 | ||||
| III | 0.95 | 0.59–1.52 | 0.83 | 0.65 | 0.20–2.10 | 0.47 |
| Clinical N stage | ||||||
| N0 | 1 | 1 | ||||
| Non to N0 | 0.99 | 0.58–1.68 | 0.96 | 1.56 | 0.48–5.14 | 0.46 |
| Clinical T stage | ||||||
| 1/2 | 1 | 1 | ||||
| 3 | 1.25 | 0.68–2.30 | 0.47 | 1.35 | 0.51–3.56 | 0.55 |
| 4 | 1.93 | 0.91–4.07 | 0.09 | 1.92 | 0.62–5.98 | 0.26 |
| Tumour location | ||||||
| L | 1 | 1 | ||||
| M | 1.09 | 0.61–1.95 | 0.76 | 1.05 | 0.57–1.93 | 0.88 |
| U | 2.16 | 1.13–4.16 | 0.02 | 2.35 | 1.18–4.65 | 0.01 |
| Radiation dose, Gy | ||||||
| <40 | 1 | 1 | ||||
| 40−50 | 1.23 | 0.62–2.41 | 0.56 | 1.22 | 0.57–2.61 | 0.60 |
| >50 | 1.66 | 0.82–3.35 | 0.16 | 1.99 | 0.91–4.34 | 0.09 |
| Extent of LND | ||||||
| High (≥20 nodes) | 1 | 1 | ||||
| Low (<20 nodes) | 1.39 | 0.95–2.04 | 0.09 | 1.62 | 1.01–2.61 | 0.05 |
| Time from RT to OP | ||||||
| <7 weeks | 1 | 1 | ||||
| ≥7 weeks | 0.85 | 0.58–1.24 | 0.39 | 0.82 | 0.51–1.32 | 0.41 |
LND: lymph node dissection; RT: radiotherapy; OP: operation; cHR: crude hazard ratio; aHR: adjusted hazard ratio; CI: confidence interval.
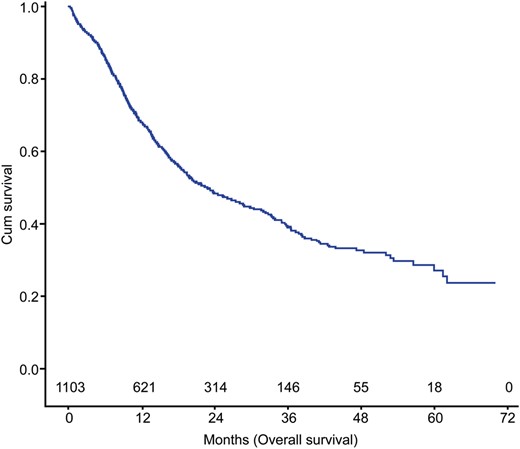
Overall survival in the entire study cohort (n = 1103).
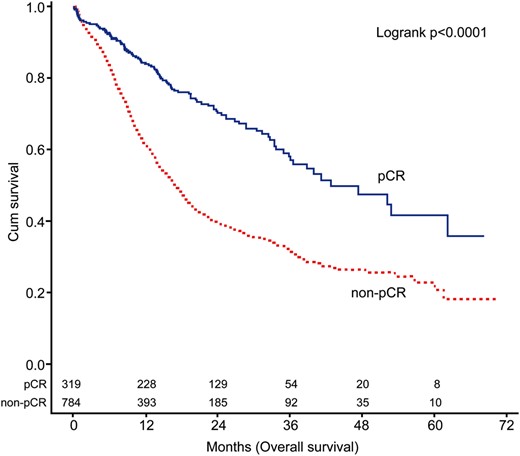
Overall survival of patients with and without pathological complete response. pCR: pathological complete response.
DISCUSSION
To our knowledge, we report the largest study to date focusing on the survival outcomes of oesophageal cancer patients who achieved pCR following CRT. Notably, our cohort was homogenously composed of patients with squamous cell carcinoma (Table 3). There are two principal findings from this nationwide study. First, we demonstrate that the absence of residual cancer in resected specimens (i.e. the achievement of pCR) should by no means be considered as an indicator of complete tumour eradication. Accordingly, the 3-year survival rate was as low as 55%. This finding is broadly in line with previous investigations [4, 6, 8–10]. Second, patient age ≥55 years, tumours located in the upper third of the oesophagus and an LND number of <20 were identified as independent adverse prognostic factors in this patient group. We believe that our findings may have significant implications for individual risk stratification of ypT0N0 patients following CRT. In particular, we recommend that patients harbouring multiple risk factors should be strictly followed.
Summary of published studies focusing on survival and prognostic factors for pCR patients
| Authors | Total number of patients | Number of pCR patients, n (%) | Study design | Histology, % | OS of pCR patients | Adverse prognostic factors |
|---|---|---|---|---|---|---|
| Meguid et al. [8] | 267 | 82 (37%) | Single centre | SCC: 20.6% ADC: 77.9% Others:1.5% | N/A | N/A |
| Meredith et al. [3] | 347 | 141 (40.6%) | Single centre | SCC: 10.7% ADC: 89.3% | 5-year rate: 52% | N/A |
| Vallbohmer et al. [4] | 1673 | 299 (17.87%) | Multicentre | SCC: 39.5% ADC: 60.5% | 5-year rate: 55% | Age |
| Smith et al. [9] | 204 | 51 (24.87%) | Single centre | SCC: 17.6% ADC: 82.4% | 3-year rate: 79% | N/A |
| Current study | 1103 | 319 (28.9%) | Nationwide | SCC: 100% | 3-year rate: 55.9% | Age ≥55 years LND number <20 Upper third location |
pCR: pathological complete response; OS: overall survival; SCC: squamous cell carcinoma; ADC: adenocarcinoma; RT: radiotherapy; N/A: not available; LND: lymph node dissection.
Of the three prognostic factors identified, the adverse impact of age in pCR patients is widely accepted (Table 3). However, the clinical significance of the number of dissected nodes and tumour location warrants further discussion [4]. Previous reports have shown that a low number of negative nodes in pathological N0 patients can have a detrimental effect on survival because of the ‘stage migration’ effect [13, 14]. In this scenario, the current AJCC staging manual suggests that at least 15 LNs should be removed to provide adequate staging in primarily resected cases [12]. The question as to whether the same protocol should be applied to patients treated with CRT remains open, especially in the presence of a good tumour response [15]. According to the radiation theory, smaller or hypervascularized tumours can be eradicated more easily than larger or hypovascularized tumours when treated with the same amount of radiation. Because of their smaller size, metastatic LNs should be more radiosensitive than the primary tumour. In this setting, the persistence of LN involvement in the presence of complete response at the primary tumour (ypT0N+) is an unexpected finding that further challenged the need for extensive LND. Two previous retrospective studies (one multicentre and one single centre) supported this hypothesis [4, 16]. However, the results of our nationwide study suggest that patients in whom pCR was diagnosed via a less aggressive LND had a 1.62 higher likelihood of death from oesophageal cancer than those who received an extensive LND. We hypothesize that a considerable proportion of positive nodes could be missed by a less aggressive LND, resulting in some ypT0N+ patients being erroneously classified as ypT0N0.
Because of their close proximity to the trachea and their high tendency to show proximal lymphatic spread bilaterally along the recurrent laryngeal nerve (a pattern of invasion that may hamper a radical resection), lesions located in the upper third of the oesophagus are known to portend a poor prognosis in primarily resected cases [17, 18]. Herein, we show that the adverse prognostic impact of upper third tumour lesions is also evident for patients treated with CRT. Specifically, patients who achieved pCR but originally had tumour located in the upper third of the oesophagus had a 2.35-fold increased likelihood of death from oesophageal cancer than those with non-upper third lesions. We believe that this observation was not evident in previous studies mainly because the majority of cases were diagnosed with adenocarcinoma, a malignancy that rarely originates from the upper oesophageal third [3, 4, 8, 9].
Some caveats of this study need to be mentioned. First, our research has a retrospective design and is limited by the relative short follow-up time. Second, we were unable to calculate the exact rate and location of recurrences owing to the limitations of our nationwide cancer registry database. Only OS was used as end-point, because data on cancer-related deaths were not available. Third, the registry contained only data on RT dose and its timing in relation to operation (either before or after surgery); conversely, data on the RT purpose (i.e. neoadjuvant versus definitive CCRT) could not be retrieved. Fourth, the exact CT regimen for each case was unknown, potentially introducing a potential confounder when differences in terms of CRT response were assessed. These limitations notwithstanding, we believe that our findings may have important implications for risk stratification of ypT0N0 patients following CRT.
CONCLUSION
Patient age ≥55 years, upper third lesions and an LND number of <20 are adverse prognostic factors in OSCC patients who achieve pCR following CRT. High-risk patients should be strictly followed.
Funding
This work was supported by grants CMRPG3E0721 from Chang Gung Memorial Hospital, Taiwan, Republic of China.
Conflict of interest: none declared.
