


Abstract
Considering the inconsistencies in the literature on the atorvastatin effect on blood pressure (BP), we performed these meta-analyses.
Through a search of the Excerpta Medica Database (EMBASE), PubMed, and Web of Science databases, 1412 articles were identified, from which 33 randomized clinical trials (RCT) and 44 pre-clinical were selected. Populations from RCT were stratified according to baseline BP and lipid levels. We performed meta-analyses of the effect of atorvastatin on systolic (SBP), diastolic and mean BP; heart rate (HR); HR variability, and baroreflex. Atorvastatin reduced SBP in the overall population (P = 0.05 vs. placebo; P = 0.03 vs. baseline), in normotensive and hyperlipidaemic (P = 0.04 vs. placebo; P = 0.0001 vs. baseline) and in hypertensive and hyperlipidaemic (P = 0.02 vs. placebo; P = 0.008 vs. baseline) individuals in parallel RCT, but it did not affect SBP in normotensive and normolipidaemic individuals (P = 0.51 vs. placebo; P = 0.4 vs. baseline). Although an effect of atorvastatin was detected in hyperlipidaemic individuals, the meta-regression coefficient for the association of low density lipoprotein (LDL)-cholesterol reduction with SBP reduction in the overall population demonstrated that SBP reduction is not dependent on the changes in LDL-cholesterol. A meta-analysis of preclinical reports demonstrated that SBP was reduced in atorvastatin-treated hypertensive and normolipidaemic rats (spontaneously hypertensive rats: P < 0.00001), but not in normotensive and normolipidaemic rats (control rats: P = 0.97). Atorvastatin also reduced the HR in spontaneously hypertensive rat.
Atorvastatin lowers BP independent of LDL-cholesterol levels. Additional studies are needed to estimate the involvement of the autonomic nervous system in the BP-lowering effect of atorvastatin.
Introduction
Hypertension is one of the most common modifiable risk factors for cardiovascular disease, chronic kidney disease, and cognitive impairment, being the leading single contributor to all-cause death and disability worldwide.1 The maintenance of physiological blood pressure (BP) levels involves a complex interplay of various elements of an integrated neurohumoral system that includes the sympathetic nervous system (SNS), the renin-angiotensin-aldosterone system, the natriuretic peptides, the endothelial function, and the immune system.2 In addition, there is growing evidence that the involvement of the renin-angiotensin system can be considered as the common link between hypertension and hypercholesterolaemia.3
Atorvastatin is a drug commonly used to reduce cholesterol in the treatment of hypercholesterolaemia, which acts by inhibiting 3-hydroxy-3-methylglutaryl-coenzyme A (HMG-CoA) reductase.4 Previous studies have shown that statins potentially affect the autonomic nervous system5 and also prevent or improve cardiac dysfunction by inhibiting oxidative stress,6–8 inflammation,9 and endothelial dysfunction.10 These pleiotropic effects suggest a potential hypotensive effect of atorvastatin. However, some studies show that treatment with statins is associated with significant reductions in BP levels,11–13 while others do not confirm this effect.5,14–17 Studies performed on rodents also produced inconsistent results.18–20
The effects of atorvastatin on heart rate (HR) are also controversial. Several studies demonstrate that atorvastatin does not alter HR,5,13,15–17,21 but there is one study showing a slight but significant reduction in the HR of hypertensive patients.11 In hypertensive rats, oral administration of atorvastatin had no effects on HR,22–24 but central administration significantly reduced HR.25
There is evidence that atorvastatin also alters the autonomic nervous system, evaluated by heart rate variability (HRV). It has been demonstrated that patients treated with atorvastatin showed an increase in standard deviation between normal intervals (SDNN) and parasympathetic nervous system activity.15,26,27 In addition, patients treated with atorvastatin showed a reduction in sympathetic activity.14,26 The only rodent study that investigated the effect of central administration of atorvastatin on SBP variability in hypertensive rats also suggests a reduction in SNS activity.25 Studies in humans17,27,28 and rodents22,25 have shown that atorvastatin increases baroreflex sensitivity.
Considering the evidence and inconsistencies in the effects of atorvastatin on BP and HR in humans and rodents, we performed a systematic review with meta-analyses on these issues. The correlation between the changes in BP and cholesterol levels was also investigated, as well as the effect of atorvastatin on HRV and baroreflex.
Materials and methods
This study followed the guidelines described in the Preferred Reporting Items for Systematic Reviews and Meta-Analyses (PRISMA).29 Thus, a systematic review was performed by searching the Excerpta Medica Database (EMBASE), PubMed, and Web of Science databases (17, September 2021) using the following search Medical Subject Headings (MeSH) terms: (‘atorvastatin’ OR ‘Lipitor’ OR ‘Liptonorm’ OR ‘CI 981’) AND (‘baroreflex’ OR ‘autonomic nervous system’ OR ‘BP ’ OR ‘pulse pressure’ OR ‘heart rate’ OR ‘heart rate variability’). Details of the search strategy are presented in the Supplementary material (Supplementary material online, Table S1). Two reviewers conducted independent searches and included all relevant articles published in English, Spanish, and Portuguese, with no restriction on the publication date. If there was a lack of consensus between the reviewers, regardless of the stage of the study, a third reviewer was consulted.
For study selection, we used the PICOS acronym (Population, Intervention, Comparison, Outcome, Study design)30 to determine the general eligibility of studies as follows: Population: mammals; Intervention: atorvastatin therapy; Comparison: values after atorvastatin treatment were compared with baseline or placebo/control; Outcomes: BP, HR, baroreflex, HRV; Study design: randomized clinical trials (RCT) or preclinical studies. There were no restrictions regarding the sample size. The titles and abstracts of all articles identified in the searches were initially evaluated, and the full texts of those considered relevant by at least one of the researchers were then analysed thoroughly. Papers that were inaccessible even after attempts to contact the corresponding author or purchase them were excluded (Supplementary material online, Table S2).
Populations from RCT were stratified according to the baseline values of BP and lipid levels.31–33 The population was considered hypertensive if the baseline SBP values were ≥140 mmHg and/or the baseline diastolic BP (DBP) was ≥90 mmHg.32 For classification of hyperlipidaemia, the parameters were low-density lipoprotein (LDL)-cholesterol ≥160 mg/dL and/or triacylglycerol ≥150 mg/dL.31,33 To enable the stratification of populations, the International System Units (mmol/L) were converted to conventional units (milligrams per decilitre) using the conversion factors 38.67 for total, LDL- and high-density lipoprotein (HDL)-cholesterol, and 88.57 for triacylglycerol.34 Populations from preclinical studies were stratified according to the animal model or treatment.
Data related to the number of patients; age; body mass index; dose, time, and route of administration of atorvastatin; SBP, DBP, and mean BP (MBP); HR; spontaneous baroreflex, and HRV in the time and frequency domains were extracted from the included RCT (Table 1). Data related to the lineage; age; body weight; experimental model; dose, time, and route of administration of atorvastatin; SBP, DBP and MBP; HR; spontaneous baroreflex, and HRV were extracted from the preclinical studies included (Table 2). When necessary,35,36 mean and standard deviation were estimated from sample size, median, and interquartile range.37
Summary of studies included in the meta-analysis of blood pressure, heart rate, HRV, and baroreflex in randomized clinical trials. Included studies were stratified according to population characteristics.
| Article1 | RCT2 1. Parallel 2. Cross-over | Age3; n (men/women)4; BMI5 (atorvastatin and placeboor total population) | Use of antihypertensive | Dose/weeks6 | Group 1. Basal 2. Placebo | Jadad Scale |
|---|---|---|---|---|---|---|
| NORMOTENSIVE AND NORMOLIPIDAEMIC | ||||||
| BLESKE 200655 | 2 | 56.00 ± 11.00; 9/6; 29.39 ± 4.53b | Yes | 80/12 | 1; 2 | 5 |
| JOYEUX-FAURE 201456 | 1 | 51.00 ± 12.00; 21/4; 28.58 ± 5.12b;56.00 ± 9.00; 18/8; 28.70 ± 3.94b | No | 40/12 | 1; 2 | 5 |
| MUKHERJEE 200857 | 1 | 47.92 ± 11.42; 40/31; 22.46 ± 3.76b | No | 10/24 | 2 | 3 |
| ORR 200958 | 1 | 53.00 ± 2.00; 6/10; 31.90 ± 0.90a;55.00 ± 3.00; 5/5; 31.10 ± 0.90a | No | 80/12 | 1; 2 | 3 |
| PAULSEN 200835 | 2 | 33.66 ± 13.56; 13/7; 25.50 ± 3.19b | No | 80/4 | 2 | 4 |
| PAULSEN 201036 | 2 | 51.00 ± 5.56; 15/6; 28.66 ± 4.77b | No | 80/2 days | 2 | 4 |
| RAJA-KHAN 201159 | 1 | 38.80 ± 4.30; 0/20; 40.10 ± 11.80b;29.40 ± 5.80; 0/11; 36.00 ± 10.40b | No | 40/6 | 1; 2 | 3 |
| RIAHI 200660 | 2 | 64.30 ± 8.90; 71/18; 28.40 ± 4.40b | Yes | 80/6 | 2 | 5 |
| SZRAMKA 200721 | 2 | 63.40 ± 7.17; 8/2; 29.39 ± 4.53b | No | 80/4 | 2 | 5 |
| TERAMOTO 201461 | 1 | 49.00 ± 8.80; 8/19; 24.00 ± 3.30b;50.00 ± 9.60; 18/10; 25.00 ± 3.70b | No | 10/12 | 1; 2 | 5 |
| ZALESKI 201462 | 1 | 44.10 ± 0.80; 203/216; 26.40 ± 0.20a;44.60 ± 1.50; 104/113; 26.50 ± 0.45a | No (n:400);Yes (n:19) | 80/24 | 1; 2 | 5 |
| ZOU 201863 | 1 | 59.30 ± 7.28; 45/30; 23.80 ± 3.15b;61.21 ± 7.59; 37/38; 25.21 ± 4.72b | Yes | 20/48 | 1; 2 | 5 |
| NORMOTENSIVE | ||||||
| RENKE 201064 | 2 | 34.20 ± 6.94; 7/7; ND | Yes | 40/12 | 2 | 3 |
| VRTOVEC 200515 | 1 | 67.00 ± 13.00; 41/35; ND67.00 ± 13.00; 41/35, ND | Yes | 10/12 | 1; 2 | 2 |
| NORMOTENSIVE AND HYPERLIPIDAEMIC | ||||||
| HAMAAD 200514 | 1 | 67.00 ± 10.00; 19/3; NDb;66.00 ± 10.00; 7/2; NDb | Yes | 40/12 | 1; 2 | 3 |
| HORWICH 20115 | 1 | 47.00 ± 14.00; 5/9; 31.00 ± 7.00a;49.00 ± 17.00; 10/2; 31.00 ± 6.00a | Yes | 3/12 | 1; 2 | 5 |
| KADOGLOU1 201065 | 1 | 64.76 ± 7.31; 30/35; NDb | Yes | 10 or 20/48 | 1 | 3 |
| KADOGLOU2 201065 | 1 | 63.24 ± 6.76; 30/36; NDb | Yes | 80/48 | 1 | 3 |
| MELENOVSK 200327 | 2 | 47.00 ± 8.00; 29/0; 27.80 ± 2.00b | No | 10/10 | 1 | 3 |
| TOKUHISA 201866 | 2 | 64.10 ± 11.60; 8/2; 23.00 ± 4.10b | Yes | 10/8 | 1 | 4 |
| HYPERTENSIVE AND NORMOLIPIDAEMIC | ||||||
| MANISTY 200967 | 1 | 79.00; 127/15; 28.50 ± 4.00b | Yes | 10/72 | 2 | 3 |
| MARTIN-VENTURA 200868 | 1 | 70.00 ± 7.00; 21/5; NDa | No | 20/4 | 1 | 3 |
| HYPERTENSIVE AND HYPERLIPIDAEMIC | ||||||
| FASSET 201069 | 1 | 60.20 ± 15.10; 80/43; 28.50 ± 6.00b;60.30 ± 15.20; 44/21; 28.60 ± 6.10b | Yes | 10/144 | 1; 2 | 5 |
| FASSET 201070 | 1 | 63.55 ± 15.60; 16/16; 28.50 ± 5.55b | Yes | 10/90 | 1; 2 | 5 |
| FOGARI 200471 | 2 | 56.30 ± 5.10; 22/23; NDb | Yes | 20/12 | 1 | 3 |
| KANAKI 201372 | 1 | 59.70 ± 8.80; 12/13; 29.40 ± 4.30b;58.80 ± 10.80; 12/13; 29.60 ± 3.80b | Yes | 10/26 | 1; 2 | 3 |
| KANAKI 201273 | 1 | 59.70 ± 8.90; 12/13; 29.40 ± 4.30b;58.80 ± 10.80; 12/13; 29.60 ± 3.80b | Yes | 10/26 | 1; 2 | 3 |
| KOH 201111 | 2 | - | No | 20/8 | 1 | 3 |
| MAGEN 200474 | 1 | 54.10 ± 13.50; 8/7; 27.90 ± 1.80b;51.40 ± 12.80; 7/9; 27.70 ± 2.10b | Yes | 20/8 | 1; 2 | 3 |
| RAISON 200275 | 1 | 56.10 ± 9.50; 7/4; 29.30 ± 3.50b | Yes | 10/12 | 1 | 5 |
| HYPERTENSIVE | ||||||
| FERRIER 200276 | 2 | 60.00 ± 14.00; 18/4: NDb | No | 80/12 | 2 | 5 |
| GOMES 201016 | 2 | 54.00 ± 16.00; 9/4; 26.70 ± 1.00b | Yes | 20/3 | 2 | 5 |
Author, year of publication (reference); 2RCT: Randomized Clinical Trials; 3Age (year, mean ± standard error or deviation); 4n (men/women); 5 BMI: Body Mass Index (kg/m2, mean ± standard error or deviation); 6mg.day−1/weeks. HRV: heart rate variability; ND: not determined. ameans studies that used standard error; bmeans studies that used standard deviation.
Baseline characteristics of the preclinical study population.
| Article1 | Lineage | Age2 and/or body weight3 | Dose/weeks4 | n5 |
|---|---|---|---|---|
| STANDARD DIET-FED RATS | ||||
| CRESPO 201577 | Male Sprague—Dawley rats | 4/120–125 | 10/4 | 10 |
| FIORE 201178 | Male Wistar rats | ND/185 | 30/6 | 10 |
| KISHI 200824 | Male SHR-SP rats | 15/ND | 50/4 | 5 |
| KISHI 200320 | Male Wistar Kyoto rats | 15/ND | 50/4 | 5 |
| MARUMO 200179 | Male Sprague—Dawley rats | 8/ND | 2/4 days | 8 |
| MOHAMMADI 201380 | Male Wistar rats | ND/280–300 | 20/4 | 5 |
| MANICKAVASAGAM 200781 | Male Sprague—Dawley rats | ND/250 | 2/3 days | 8 |
| MONDO1 200682 | Male Sprague—Dawley rats | ND/180–240 | 30/2 | 10 |
| MONDO2 200683 | Male Sprague—Dawley rats | ND/180–240 | 30/2 | 10 |
| MONDO3 200684 | Male Sprague—Dawley rats | ND/180–260 | 30/2 | 10 |
| OKAMURA 201485 | Male Sprague—Dawley rats | 5/ND | 10/8 | 8 |
| QUIDGLEY 201486 | Male Sprague—Dawley rats | 4/ND | 10/4 | 10 |
| SARATH 201487 | Male Wistar rats | ND/100–120 | 10/4 | 15 |
| SUBRAMANI 200988 | Male Wistar rats | ND/ND | 10/48, 24, and 2 hours | 5 |
| TOTOSON 201389 | Male Wistar rats | ND/275–299 | 10/2 | 8 |
| SPONTANEOUSLY HYPERTENSIVE RATS (SHR) | ||||
| CHANG-JIANG 200390 | Male SHR | 118 ± 3 | - | 6 |
| CHEN 201891 | Male SHR | 11/254 ± 5 | 10/6 | 8 |
| DOYON1 201192 | Male SHR | 11/ND | 50/3 | 8 |
| DOYON2 201192 | Male SHR | 11/ND | 50/6 | 12 |
| FANG1 201993 | Male SHR | 16/ND | 10/6 | 8 |
| FANG2 201993 | Male SHR | 16/ND | 25/6 | 8 |
| FANG3 201993 | Male SHR | 16/ND | 50/6 | 8 |
| GENG1 201094 | Male SHR | 16/ND | 10/8 | 6 |
| GENG2 201094 | Male SHR | 16/ND | 25/8 | 6 |
| GENG3 201094 | Male SHR | 16/ND | 50/8 | 6 |
| HUANG 202095 | Male SHR | ND/210–265 | 10/8 | 8 |
| ITO 201096 | Male SHR | 5/ND | 20/8 | 6 |
| KANG1 200797 | Male SHR | 18/115–130 | 50/10 | 6 |
| KANG2 200798 | Male SHR | 8/108–132 | 50/10 | 6 |
| LU1 201699 | Male SHR | 36/ND | 10/12 | 10 |
| LU2 2016100 | Male SHR | 36/ND | 10/12 | 8 |
| WASSMANN 2001101 | Male SHR | 18/ND | 50/4 | 10 |
| YUAN 2020102 | Male SHR | 16/ND | 50/8 | 10 |
| ZHAO 2010103 | Male SHR | 8/ND | 50/12 | 8 |
| SPONTANEOUSLY HYPERTENSIVE RATS STROKE-PRONE (SHR-SP) | ||||
| HAYASHI1 2004104 | Male SHR-SP | 9/120–125 | 3/3 | 33 |
| HAYASHI2 2004104 | Male SHR-SP | 9/120–125 | 30/3 | 33 |
| KISHI 200320 | Male SHR-SP | 15/ND | 50/4 | 5 |
| KISHI 200824 | Male SHR-SP | 15/ND | 50/4 | 5 |
| KISHI 200922 | Male SHR-SP | ND/280–340 | 20/4 | 5 |
| KISHI 2012105 | Male SHR-SP | 12–14/350–425 | 20/4 | 5 |
| MASON 2015106 | Male SHR-SP | 7–9/250–270 | 20/5 | 29–64 |
| HIGH-SALT DIET-FED RATS (8% NaCl) | ||||
| AKAHORI 2014107 | Salt-sensitive male Dahl rats | 7/ND | 20/16 | 10 |
| ZHAO 2019108 | Male SHR | 12/ND | 10/10 | 12 |
| HIGH-SALT DIET-FED RATS (4% NaCl) | ||||
| FIORE 201178 | Male Wistar—Hokkaido rats | ND/185 | 30/6 | 10 |
| ZHOU1 2008109 | Male Sprague—Dawley rats | ND/ND | 30/10 | 8 |
| ZHOU2 2008109 | Male Sprague—Dawley rats | ND/ND | 30/6 | 6 |
| ZHOU1 2004110 | Male Sprague—Dawley rats | 6/ND | 30/10 | 8 |
| ZHOU2 2004110 | Male Sprague—Dawley rats | 6/ND | 30/6 | 8 |
| ZHOU 2014111 | Male Sprague—Dawley rats | 6/ND | 15/6 | 5 |
| SURGICALLY HYPERTENSIVE RATS | ||||
| GUIMARAES 2015112 | Male Wistar Rats | ND/250–300 | 50/8 | 8 |
| GUIMARÃES 2013113 | Male Wistar Rats | ND/180–200 | 50/8 | 7 |
| DIABETIC RATS | ||||
| CRESPO 201577 | Male Sprague—Dawley rats | 4/120–125 | 10/4 | 10 |
| QUIDGLEY 201486 | Male Sprague—Dawley rats | 4/ND | 10/4 | 10 |
| PATEL1 2010114 | Male Sprague—Dawley rats | ND/229 | 20/8 | 6 |
| PATEL2 2010114 | Male Sprague—Dawley rats | ND/230 | 40/8 | 6 |
| HYPERLIPIDAEMIC RATS | ||||
| BEZEK 2017115 | Male hereditary hypertriglyceridemic rats | 12–16/240–260 | 50/4 | 8 |
| PARVIN 2019116 | Male Wistar Rats | ND/180 | 40/4 | 8 |
| SOTNIKOVA1 2012117 | Male Prague hereditary hypertriglyceridemic rats | ND/44 | 3/8 | 8 |
| SOTNIKOVA2 2012117 | Female Prague hereditary hypertriglyceridemic rats | ND/44 | 3/8 | 8 |
| KNEZL 2017118 | Male hereditary hypertriglyceridemic rats | 12–16/373 ± 18 | 50/4 | 8 |
| DEXAMETHASONE-INDUCED HYPERTENSIVE RATS | ||||
| MONDO1 200682 | Male Sprague—Dawley rats | ND/180–240 | 30/2 | 10 |
| MONDO2 200683 | Male Sprague—Dawley rats | ND/180–240 | 30/2 | 10 |
| MONDO3 200684 | Male Sprague—Dawley rats | ND/180–260 | 30/2 | 10 |
Author, year of publication (Reference); 2age (weeks); 3body weight (g); 4mg.day−1/weeks orally; 5sample number per group. ND, not determined.
Quality analysis
The methodological quality of the studies included in this review was evaluated by two authors independently, and divergent opinions were resolved by consensus. The quality of the RCT was evaluated using the Jadad scale.38 The Systematic Review Centre for Laboratory Animal Experimentation (SYRCLE) tool, which assesses the risk of bias for animal studies, was also used.39 This tool contains the following evaluation items: selection bias, performance bias, detection bias, friction bias, reporting bias, and other sources of bias. Ten questions were applied to the articles included in the systematic review, with the possible answers ‘YES’, indicating a low risk of bias; ‘NO’, indicating a high risk of bias, and ‘UNCERTAIN’, indicating an uncertain risk of bias. Calculating the sum score of each individual study using this tool is not recommended.
Meta-analyses
For the meta-analyses, we considered the population characteristics and the study design (parallel RCT or cross-over RCT and preclinical studies). For RCT, we performed a meta-analysis considering all individuals (overall effect) and then stratified the studies according to the population features (normotensive and normolipidaemic; normotensive and hyperlipidaemic; hypertensive and hyperlipidaemic; hypertensive). Independent meta-analyses were performed for SBP, DBP and MBP; HR; spontaneous baroreflex, and HRV. For pre-clinical studies, we performed a meta-analysis of SBP considering the stratified studies [standard diet-fed rats; spontaneously hypertensive rats (SHR); spontaneously hypertensive rats stroke-prone (SHR-SP); high-salt diet-fed rats (8 and 4% NaCl); surgically hypertensive rats; diabetic rats; hyperlipidaemic rats; dexamethasone-induced hypertensive rats]. The results of each primary study were described by subtracting the mean after treatment from the mean before treatment or the mean from the placebo/control group. Estimates of individual studies and their variances were combined using random effects models to estimate the pooled mean difference and its confidence intervals. Heterogeneity in primary results was analysed using Cochran's Q statistical test and the I2 statistic. In all procedures, the significance level was 5%. All analyses were performed using the software Review Manager 5.4. The effect of atorvastatin on the outcome (plotted as a mean difference for the change in SBP [mmHg] upon the y-axis) as a function of a given factor (plotted as a difference in the change in LDL-cholesterol [mg/dl] upon the x-axis) was estimated using meta-regression. Meta-regression coefficients (slopes of the meta-regression line) show the estimated change in the SBP mean difference per unit of the covariate change. This statistical analysis was performed with the Comprehensive Meta-Analysis 3.3.070 (Biostat, Englewood, NJ, USA).
Results
A total of 1412 relevant papers were identified on Embase, PubMed, and Web of Science, of which 1335 were excluded for the reasons described in Figure 1, and 33 RCT and 44 preclinical studies were included in the final analyses.
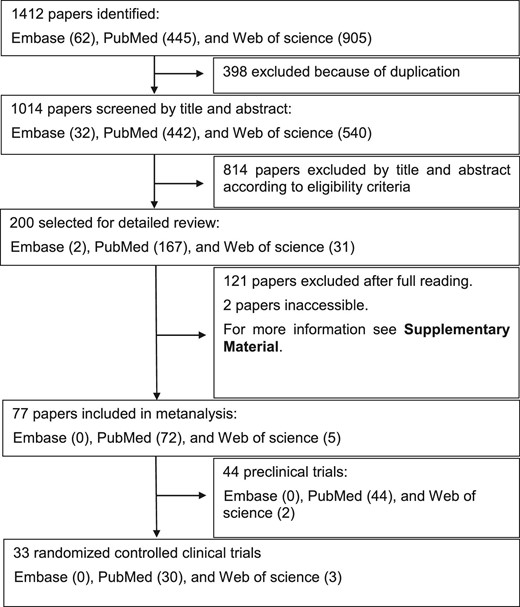
Flow diagram of the study selection process.
The baseline characteristics of the populations from studies included in the meta-analyses are shown in Table 1 and Table 2.
The quality analysis of the RCT showed that most articles were considered of high quality, and only one was of low quality (Table 1). Considering baseline characteristics and other sources of bias from preclinical studies, the quality analysis indicated that this systematic review had a low risk of bias. However, for most of the questions evaluated, the risk of bias in preclinical studies was uncertain, which suggested that it should not be overlooked (Supplementary material online, Table S3).
In general, the heterogeneity analysis of the RCT showed greater homogeneity in the results after stratification of the primary studies, as there was a decrease in I2 and an increase in the P value for Cochran's Q statistical test (Figure 2). In preclinical studies, despite considerable heterogeneity (>75%) in the meta-analysis, most primary studies demonstrated a decrease in SBP (Figure 3).
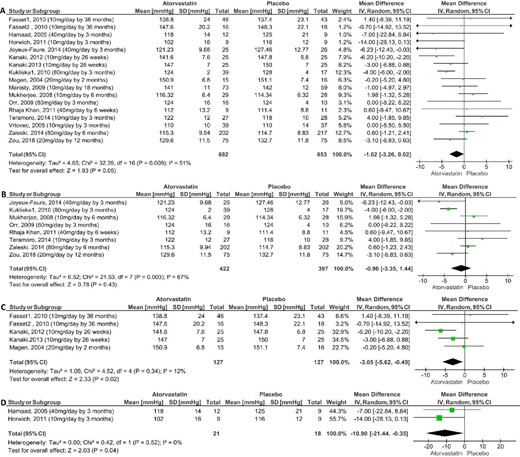
Meta-analysis of the effect of atorvastatin on systolic blood pressure in parallel and randomized clinical trials compared with placebo: overall effect (A); normotensive and normolipidaemic (B); hypertensive and hyperlipidaemic (C) and normotensive and hyperlipidaemic (D).
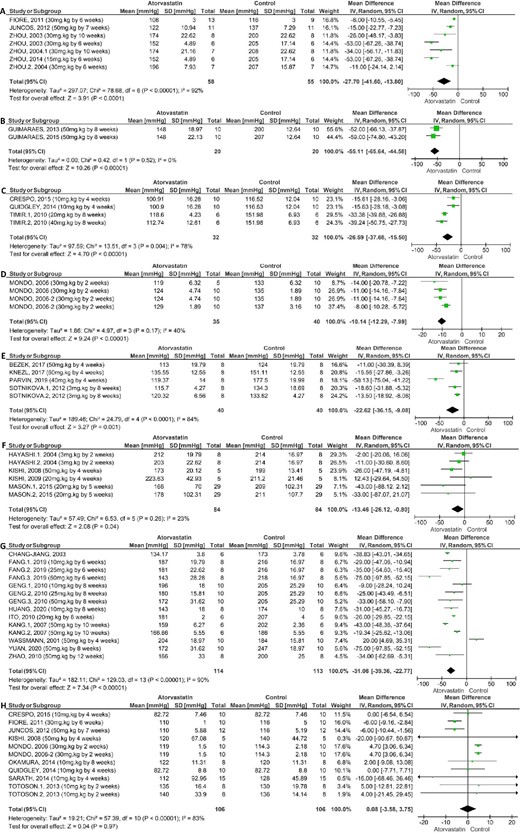
Meta-analysis of the effect of atorvastatin on systolic blood pressure in preclinical studies: high-salt (4% NaCl) diet-fed rats (A); surgically hypertensive rats (B); diabetic rats (C); dexamethasone-induced hypertensive rats (D); hyperlipidaemic rats (E); spontaneously hypertensive rats stroke-prone (SHR-SP) (F); spontaneously hypertensive rats (SHR) (G) and standard diet-fed rats (H).
Considering the whole set of studies (overall effect of atorvastatin), the meta-analysis of parallel RCT showed that atorvastatin induces significant reduction of BP. In fact, atorvastatin reduced the SBP with mean difference (MD) of −1.62 mmHg [95% confidence interval (CI) −3.26 to 0.02] compared with placebo (Figure 2) and with MD of −3.00 mmHg [95% CI −5.71 to −0.29] compared with baseline (Table 3). The atorvastatin effect on SBP compared with placebo was small and on the threshold of statistical significance (P = 0.05). Atorvastatin also reduced the DBP, without changes in the MBP and HR, compared with placebo and baseline (Table 3). The absence of statistical significance in MBP may be related to the small number of trials (n = 4) and, therefore, to the sample size (Table 3). The meta-regression coefficient showed that the correlation between LDL-cholesterol changes vs. SBP changes induced by atorvastatin was not statistically significant compared with baseline and to placebo (Table 4). Similar meta-regression results were found for DBP vs. baseline and vs. placebo (Table 4).
Effect sizes of the overall and subgroup analysis from parallel or cross-over randomized clinical trials and preclinical studies.
| Title | Number of trials | Number of participants: ATV/CTRL | Effect size MD [95% CI] | Overall effect, p value | Heterogeneity I2 value |
|---|---|---|---|---|---|
| Parallel and randomized clinical trials | |||||
| Overall effect | |||||
| Placebo control | |||||
| DBP | 17 | 680/666 | −1.39 [−2.14, −0.64] | P = 0.0003 | I2 = 0% |
| MBP | 4 | 268/286 | −1.44 [−4.33, 1.46] | P = 0.33 | I2 = 37% |
| HR | 4 | 132/128 | 0.99 [−1.67, 3.65] | P = 0.47 | I2 = 25% |
| Basal control | |||||
| SBP | 18 | 749/761 | −3.00 [−5.71, −0.29] | P = 0.03 | I2 = 84% |
| DBP | 18 | 747/761 | −1.82 [−3.08, −0.57] | P = 0.004 | I2 = 52% |
| MBP | 4 | 264/264 | −0.35 [−2.50, 1.80] | P = 0.75 | I2 = 14% |
| HR | 3 | 116/116 | −0.68 [−2.39, 1.04] | P = 0.44 | I2 = 0% |
| Normotensive and Normolipidaemic | |||||
| Placebo control | |||||
| DBP | 8 | 422/412 | −1.36 [−2.44, −0.28] | P = 0.01 | I2 = 22% |
| MBP | 2 | 227/243 | −1.22 [−6.82, 4.38] | P = 0.67 | I2 = 70% |
| Basal control | |||||
| SBP | 8 | 432/432 | −1.38 [−5.02, 2.27] | P = 0.46 | I2 = 86% |
| DBP | 8 | 432/432 | −1.70 [−3.56, 0.17] | P = 0.08 | I2 = 69% |
| MBP | 2 | 227/227 | 0.58 [−1.85, 3.01] | P = 0.64 | I2 = 11% |
| Normotensive and Hyperlipidaemic | |||||
| Placebo control | |||||
| DBP | 2 | 21/21 | −2.37 [−7.80, 3.05] | P = 0.39 | I2 = 0% |
| Basal control | |||||
| SBP | 3 | 143/143 | −7.41 [−11.18, −3.65] | P = 0.0001 | I2 = 0% |
| DBP | 3 | 143/143 | −1.10 [−5,9, 3.76] | P = 0.66 | I2 = 76% |
| Baroreflex | 2 | 20/20 | 0.02 [−3.16, 3.19] | P = 0.99 | I2 = 39% |
| Hypertensive and Hyperlipidaemic | |||||
| Placebo control | |||||
| DBP | 5 | 127/137 | −2.56 [−4.48, −0.63] | P = 0.009 | I2 = 0% |
| MBP | 2 | 41/43 | −2.62 [−6.20, 0.96] | P = 0.15 | I2 = 0% |
| Basal control | |||||
| SBP | 5 | 123/135 | −2.99 [−5.20, −0.79] | P = 0.008 | I2 = 0% |
| DBP | 5 | 123/135 | −2.19 [−4.20, −0.19] | P = 0.03 | I2 = 0% |
| MBP | 2 | 37/37 | −2.78 [−6.54, 0.98] | P = 0.15 | I2 = 0% |
| Cross-over and randomized clinical trials | |||||
| Overall effect | |||||
| Placebo control | |||||
| SBP | 5 | 90/90 | −0.91 [−4.64, 2.82] | P = 0.63 | I2 = 0% |
| LF/HF | 2 | 23/23 | −1.03 [−2.67, 0.61] | P = 0.22 | I2 = 0% |
| HF | 2 | 23/23 | 6.13 [−71.41, 83.67] | P = 0.88 | I2 = 0% |
| Basal control | |||||
| SBP | 3 | 97/97 | −4.31 [−6.68, −1.95] | P = 0.0003 | I2 = 0% |
| DBP | 3 | 97/97 | −3.79 [−5.31, −2.27] | P < 0.00001 | I2 = 0% |
| HR | 2 | 56/52 | −3.46 [−7.33, 0.42] | P = 0.08 | I2 = 0% |
| Normotensive and Normolipidaemic | |||||
| Placebo control | |||||
| SDNN | 4 | 75/75 | 4.39 [−1.20, 9.98] | P = 0.12 | I2 = 0% |
| RMSSD | 4 | 75/75 | 4.47 [−0.01, 8.96] | P = 0.05 | I2 = 0% |
| Basal control | |||||
| SDNN | 2 | 55/55 | 2.66 [−9.68, 15.01] | P = 0.67 | I2 = 0% |
| RMSSD | 2 | 55/55 | −0.80 [−7.49, 5.88] | P = 0.81 | I2 = 0% |
| Hypertensive and Hyperlipidaemic | |||||
| Basal control | |||||
| SBP | 2 | 87/87 | −4.42 [−6.79, −2.04] | P = 0.0003 | I2 = 0% |
| DBP | 2 | 87/87 | −3.86 [−5.39, −2.33] | P < 0.00 001 | I2 = 0% |
| Hypertensive | |||||
| Placebo control | |||||
| SBP | 2 | 35/35 | −3.29 [−14.37, 7.79] | P = 0.56 | I2 = 0% |
| Preclinical Studies | |||||
| Standard diet-fed rats | |||||
| MBP | 6 | 46/46 | 1.72 [−4.61, 8.04] | P = 0.60 | I2 = 38% |
| HR | 5 | 34/34 | 8.15 [−19.47, 35.77] | P = 0.56 | I2 = 68% |
| Hyperlipidaemic rats | |||||
| DBP | 2 | 16/16 | −7.04 [−18.20, 4.13] | P = 0.24 | I2 = 0% |
| SHR-SP rats | |||||
| DBP | 4 | 74/74 | −14.69 [−26.92, −2.46] | P = 0.02 | I2 = 0% |
| MBP | 6 | 84/84 | −25.92 [−40.96, −10.88] | P = 0.0007 | I2 = 82% |
| HR | 6 | 36/36 | −11.79 [−31.50, 7.93] | P = 0.24 | I2 = 15% |
| SHR rats | |||||
| MBP | 4 | 32/32 | −7.22 [−22.68, 8.23] | P = 0.36 | I2 = 86% |
| HR | 9 | 84/84 | −13.36 [−23.96, −2.76] | P = 0.01 | I2 = 62% |
| Rats fed high salt 8% | |||||
| MBP | 2 | 22/22 | −21.32 [−79.03, 36.39] | P = 0.47 | I2 = 85% |
ATV, atorvastatin; CI, confidence interval; CTRL, control; DBP, diastolic blood pressure; HF, high-frequency band; HR, heart rate; LF, low-frequency band; LF/HF, low-frequency and high-frequency band ratio; MBP, mean blood pressure; MD, mean difference; RMSSD, root mean square of successive differences between normal heart beats; SBP, systolic blood pressure; SDNN, standard deviation between normal intervals; SHR, spontaneously hypertensive rats; SHR-SP, spontaneously hypertensive rats stroke prone.
Meta-regression analyses relating serum LDL-cholesterol differences to blood pressure changes induced by atorvastatin.
| Title | Covariate | Coefficient | Standard error | 95% Lower | 95% Upper | Number of trials | P-value |
|---|---|---|---|---|---|---|---|
| Parallel and randomized clinical trials | |||||||
| Overall Effect | |||||||
| Placebo | |||||||
| SBP | Intercept | −1.196 | 1.794 | −4.712 | 2.321 | 11 | 0.51 |
| LDL-cholesterol | 0.016 | 0.043 | −0.068 | 0.100 | 11 | 0.70 | |
| DBP | Intercept | −1.714 | 0.637 | −2.963 | −0.466 | 11 | 0.007 |
| LDL-cholesterol | −0.005 | 0.018 | −0.041 | 0.030 | 11 | 0.77 | |
| Basal | |||||||
| SBP | Intercept | −0.012 | 5.036 | −9.881 | 9.858 | 14 | 0.99 |
| LDL-cholesterol | 0.067 | 0.087 | −0.104 | 0.237 | 14 | 0.44 | |
| DBP | Intercept | −3.576 | 1.964 | −7.426 | 0.274 | 14 | 0.07 |
| LDL-cholesterol | −0.032 | 0.036 | −0.102 | 0.038 | 14 | 0.37 | |
| Normotensive and normolipidaemic individuals | |||||||
| Placebo | |||||||
| SBP | Intercept | −1.376 | 2.625 | −6.521 | 3.768 | 6 | 0.60 |
| LDL-cholesterol | −0.022 | 0.069 | −0.158 | 0.114 | 6 | 0.75 | |
| DBP | Intercept | −1.720 | 0.583 | −2.864 | −0.577 | 6 | 0.003 |
| LDL-cholesterol | −0.032 | 0.027 | −0.085 | 0.021 | 6 | 0.24 | |
| Basal | |||||||
| SBP | Intercept | 1.465 | 8.091 | −14.393 | 17.323 | 7 | 0.86 |
| LDL-cholesterol | 0.072 | 0.148 | −0.219 | 0.363 | 7 | 0.63 | |
| DBP | Intercept | −1.166 | 2.458 | −5.983 | 3.652 | 7 | 0.64 |
| LDL-cholesterol | 0.025 | 0.051 | −0.075 | 0.125 | 7 | 0.63 | |
| Preclinical trials | |||||||
| SHR | |||||||
| SBP | Intercept | −27.475 | 11.653 | −50.313 | −4.636 | 9 | 0.02 |
| LDL-cholesterol | −0.055 | 0.937 | −1.891 | 1.782 | 9 | 0.96 | |
DBP, diastolic blood pressure; LDL-cholesterol, low-density lipoprotein-cholesterol; SBP, systolic blood pressure; SHR, spontaneously hypertensive rats.
The meta-analysis of the global effect of the crossover RCT showed that atorvastatin did not significantly affect SBP when compared with placebo (Table 3). However, when compared with baseline, atorvastatin indeed reduced the SBP with MD of −4.31 mmHg [95% CI −6.68 to −1.95], but it did not reduce the HR (Table 3). In addition, atorvastatin had no effects in low-frequency and high-frequency (LF/HF) band ratio and high-frequency (HF) band when compared with placebo, but there were only two trials for these analyses, and their sample sizes were small (Table 3).
In the normotensive and normolipidaemic groups, the meta-analysis of parallel RCT showed that atorvastatin does not affect SBP and MBP, both compared with placebo and baseline (Figure 2; Table 3). However, atorvastatin reduced DBP with MD of −1.36 mmHg [95% CI −2.44 to −0.28] compared with placebo, but it did not affect DBP compared with baseline (Table 3). The meta-regression coefficient showed that the correlations between LDL-cholesterol changes vs. SBP or DBP changes induced by atorvastatin compared with baseline or to placebo were not statistically significant (Table 4). In addition, the meta-analysis of cross-over RCT showed that, in normotensive and normolipidaemic individuals, atorvastatin did not change the HRV in the time domain in the parameters: SDNN, and root mean square of successive differences between normal heart beats (RMSSD) compared with baseline (Table 3). However, when compared with placebo, atorvastatin increased the RMSSD with MD 4.47 milliseconds [95% CI−0.01 to 8.96], without increasing the SDNN. However, the low number of trials must be pointed (Table 3).
In normotensive and hyperlipidaemic individuals, the meta-analysis of parallel RCT showed that atorvastatin reduced SBP with MD −10.90 mmHg [95% CI −21.44 to −0.35] compared with placebo (Figure 2) and with MD −7.41 mmHg [95% CI −11.18 to −3.65] compared with baseline (Table 3), but it did not decrease DBP when compared with placebo or baseline, nor did it decrease baroreflex sensitivity compared with baseline (Table 3).
In hypertensive and hyperlipidaemic individuals, the meta-analysis of parallel RCT showed that atorvastatin reduced the SBP with MD −3.05 mmHg [95% CI −5.62 to −0.49] compared with placebo (Figure 2) and with MD −2.99 mmHg [95% CI −5.20 to −0.79] compared with baseline (Table 3), and the DBP compared with placebo and baseline (Table 3). Atorvastatin did not induce a significant difference in MBP, however there was a low number of trials (Table 3). In this group of hypertensive and hyperlipidaemic individuals, the meta-analysis of crossover RCT also showed that atorvastatin reduced the SBP with MD −4.42 mmHg [95% CI −6.79 to −2.04] and DBP when compared with baseline (Table 3). In hypertensive individuals, atorvastatin did not induce significant differences in SBP when compared with placebo (Table 3).
The meta-analysis of preclinical studies showed that atorvastatin reduced the SBP in high-salt (4% NaCl) diet-fed rats with MD −27.70 mmHg [95% CI −41.60 to −13.80], surgically hypertensive rats with MD −55.11 mmHg [95% CI −65.64 to −44.58], diabetic rats with MD −26.59 mmHg [95% CI −37.68 to −15.50], dexamethasone-induced hypertensive rats with MD −10.14 mmHg [95% CI −12.29 to −7.99], hyperlipidaemic rats with MD −22.62 mmHg [95% CI −36.15 to −9.08], SHR-SP with MD −13.46 mmHg [95% CI −26.12 to −0.80] and SHR with MD −31.06 mmHg [95% CI −39.36 to −22.77], without affecting the SBP in standard diet-fed control rats (Figure 3). The meta-regression coefficient showed that the reducing effect of atorvastatin on SBP occurred independently of changes in LDL-cholesterol levels in SHR (Table 4). In addition, atorvastatin reduced the DBP and MBP in SHR-SP (Table 3) and did not induce significant differences in DBP in hyperlipidaemic rats and in MBP in SHR, in very high-salt (8%) diet-fed rats and in standard diet-fed control rats. Atorvastatin also reduced the HR in SHR with MD −13.36 mmHg [95% CI −23.96 to −2.76], but not in SHR-SP and standard diet-fed control rats (Table 3).
Discussion
The main finding of this meta-analyses of RCT was that atorvastatin reduces BP in hypertensive individuals, independently of hyperlipidaemia. The meta-regression clarified that the hypotensive effect of atorvastatin occurs independently of LDL-cholesterol level changes. In addition, atorvastatin reduced SBP in hyperlipidaemic individuals when compared with baseline and placebo, with or without hypertension. Concordantly, a meta-analysis of preclinical studies showed that atorvastatin reduced the SBP in hypertensive rats, even without hyperlipidaemia.
The quality analysis of the RCT showed that most studies were considered of high quality, and only one was of low quality. High quality in the Jadad classification was obtained through adequate blinding and the description of the study as double-blind. Regarding the quality of preclinical studies, 50% of the questions on the SYRCLE scale had uncertain answers. Thus, it is not recommended that this tool be used to perform a global assessment of each individual study.
Previous meta-analyses demonstrated, by comparing intervention and control groups, that statin and atorvastatin, including combined therapy with amlodipine, reduced the mean SBP difference between baseline and end-of-treatment.40,41 The effect of atorvastatin on the DBP was less clear, because one study showed a decrease,41 and another showed only a tendency to decrease this parameter.40 More recently, an association between the use of atorvastatin and decreases in BP was demonstrated through the reporting odds ratio (ROR) statistics.42 It has been previously suggested that the hypotensive effect of statin is greater in individuals with high BP and that it is not related to the decrease in serum cholesterol levels.40 By contrast, Takagi et al.43 reported that atorvastatin, alone or in combination with amlodipine, had an LDL-cholesterol-dependent effect on BP.43 The present meta-regression shows that atorvastatin has an LDL-cholesterol-independent effect on SBP and DBP reduction when compared with either baseline or placebo, in the overall population and in a normotensive-normolipidaemic subgroup. The limited number of studies did not allow us to perform a meta-regression among hyperlipidaemic individuals with and without hypertension.
In preclinical studies, atorvastatin reduced the SBP in high-salt (4%) diet-fed rats, genetically (SHR and SHR-SP), surgically and dexamethasone-induced hypertensive rats, and diabetic rats. In addition, in SHR rats, the meta-regression analysis showed that the reduction in SBP was independent of changes in LDL-cholesterol. Although it was not possible to perform a meta-regression in other animal models, they showed no plasma lipid changes, suggesting that the effect of atorvastatin is indeed independent of serum cholesterol levels.
These analyses did not allow us to clarify whether the BP-reducing effect of atorvastatin is dependent on the autonomic nervous system because the RMSSD, LF/HF, and HF were estimated only in normotensive individuals, and atorvastatin does not modulate SBP in this group. Further experiments are needed to clarify the involvement of the autonomic nervous system in the hypotensive effect of atorvastatin.
It is possible that atorvastatin regulates BP through peripheral vascular mechanisms. To the best of our knowledge, there is only one preclinical study evaluating simultaneously the effect of atorvastatin on BP and on these mechanisms.44 Atorvastatin (50 mg.kg−1 by 30 days) decreased SBP and angiotensin II-induced vasoconstriction and improved endothelial dysfunction in normocholesterolaemic SHR. Endothelial dysfunction was assessed by carbachol-induced vasorelaxation in aortic segments.44 These results are likely related to the ability of atorvastatin to increase the expression and activity of endothelial nitric oxide synthase (eNOS) in the aortas of rodents44,45 and block the negative regulation exerted by oxidized LDL-cholesterol on the eNOS mRNA and protein levels in vascular endothelial cells.46 In patients with peripheral arterial disease (n = 30), a prospective study showed a decrease in plasma nitrite levels after 1 month of atorvastatin treatment, suggesting an increase in the bioavailability of nitric oxide (NO).47 Several mechanisms may explain the increase in atorvastatin-induced NO, as follows. (1) Atorvastatin increases eNOS phosphorylation. In mouse aorta and myocardium, atorvastatin increased adenosine monophosphate-activated protein kinase (AMPK), acetyl-CoA carboxylase and eNOS phosphorylation. In cultured human vascular endothelial cells, atorvastatin-induced eNOS phosphorylation was inhibited by AMPK blockade.48 (2) Atorvastatin decreased Ras homolog family member A (RhoA)/Ras homology (Rho) kinase signalling and activation of the nitric oxide/protein kinase G (PKG) pathway.45,49,50 In the myocardium of rats with heart failure, atorvastatin decreased mRNA and protein expression of RhoA/Rho kinase and increased the mRNA and protein expression of eNOS.49 In the livers of cirrhotic rats, atorvastatin decreased Rho-kinase activity and the membrane association of RhoA and Ras (from Rat sarcoma virus) and increased eNOS mRNA and protein levels, eNOS phosphorylation, nitrite/nitrate, and the activity of PKG. In addition, incubation with atorvastatin dose-dependently relaxed the contraction of hepatic stellate cells, resulting in decreased portal pressure.50 In mouse aorta and cultured endothelial cells, atorvastatin decreased isoprenoid-dependent Rho membrane translocation and GTP-binding activity. Atorvastatin increased Rho gene transcription but not Rho mRNA stability and led to the accumulation of non-isoprenylated Rho in the cytosol. Withdrawal of statin treatment restored the availability of isoprenoids and resulted in a massive membrane translocation and activation of Rho, causing downregulation of endothelial NO production.45 (3) Atorvastatin promotes NO production by decreasing caveolin-1 expression in endothelial cells. This effect occurs with no changes in eNOS abundance and is reversed by providing mevalonate.51 (4) Atorvastatin decreases the expression of microRNAs 221/222 and increases NO levels and NOS3 mRNA expression.52 In human umbilical vein endothelial cells, the magnitude of the reduction of microRNAs 221 and 222 after atorvastatin treatment was correlated with the increment in NOS3 mRNA levels.52
Additional vascular mechanisms may mediate the effects of atorvastatin on BP, as follows. (1) Reduction of endothelin-1.46 Atorvastatin decreased the pre-pro endothelin mRNA expression in a concentration- and time-dependent fashion and decreased immunoreactive endothelin-1 levels in bovine aortic endothelial cells. This inhibitory effect was maintained in the presence of oxidized LDL-cholesterol and blocked by mevalonate administration.46 (2) Reduction in angiotensin II-induced vasoconstriction.44 Atorvastatin increased carbachol-induced vasodilation and decreased AT1 receptor mRNA and protein expression in the aortas of SHR.44 (3) Reduction in angiotensin II-induced vascular fibrosis.53 In cultured vascular smooth muscle cells, atorvastatin inhibited angiotensin II-induced connective tissue growth factor (CTGF) production, an effect reversed by the mevalonate and geranylgeranylpyrophosphate (GGPP) supply. In cultured vascular smooth muscle cells, atorvastatin inhibited angiotensin II-induced Rho membrane localization and activation. Atorvastatin downregulated angiotensin II/CTGF-induced activation of p38 mitogen-activated protein kinase (MAPK) and c-Jun N-terminal kinase (JNK), as well as redox processes. In rats infused with angiotensin II, atorvastatin decreased aortic CTGF and Rho activation without modifying BP. Statins also decreased extracellular matrix overexpression caused by angiotensin II in vivo and in vitro.53 (4) Reduction in serotonin-induced pulmonary artery smooth muscle cell mitogenesis and migration.54 Atorvastatin dose dependently inhibited serotonin [5-hydroxytryptamine (5-HT)]-induced mitogenesis and migration of cultured bovine pulmonary artery smooth muscle cells. This inhibition was reversed by mevalonate and GGPP supplementation. Concordantly, atorvastatin inhibited 5-HT-induced cellular RhoA activation, membrane localization, and Rho kinase-mediated phosphorylation of the myosin phosphatase-1 subunit. Atorvastatin also inhibited Rho signalling in human embryonic kidney (HEK)293 cells in a GGPP-dependent manner. While 5-HT-induced Akt kinase activation was unaffected by atorvastatin, 5-HT-induced Extracellular signal-Related Kinase (ERK) nuclear translocation was attenuated in a GGPP-dependent fashion.54
This study has some limitations. First, this study-level meta-analysis is not based on individual patient data. Second, stratification on several subgroups reduced considerably the number of studies and, thus, the power of the meta-analysis. In this regard, it was also not possible to group the studies by time and dose, because there was great heterogeneity regarding the treatment protocol. It was also not possible to perform meta-regression on the hypertensive and hyperlipidaemic group, due to the lack of data on serum lipid measurements. Finally, it was not possible to assess whether the antihypertensive effect of atorvastatin was related to changes in the autonomic nervous system, because the number of studies evaluating the effect of atorvastatin on HRV parameters is limited. Since SNS can activate the renin-angiotensin-aldosterone system, including it in the searching algorithm could contribute to clarify the action mechanism of atorvastatin. All these limitations indicate the need to increase the number of primary studies with this focus.
In summary, the present meta-analyses of clinical and preclinical studies indicate that atorvastatin lowers BP by vascular mechanisms independent of LDL-cholesterol levels. Additional studies are needed to estimate the involvement of the autonomic nervous system in the BP-lowering effect of atorvastatin.
Author contributions
All authors contributed to the development, analysis, drafting and editing of this article.
Funding
This work was supported through funding from the Federal University of São João del-Rei. G.S.C. received a fellowship from the Federal University of São João del-Rei.
Conflict of interest: The authors report no conflicts of interest.
Data availability
The data underlying this article are available in the article and in its online supplementary material.
