


Abstract
To analyse the safety and efficacy of direct oral anticoagulants (DOACs) in real-world studies including atrial fibrillation (AF) patients.
Systematic review and meta-analysis of observational studies including AF patients on DOACs. Primary endpoints: any, major, gastrointestinal (GI), intracranial haemorrhage (ICH), and haemorrhagic stroke (HS). Secondary endpoints: ischaemic stroke (IS), systemic embolism (SE), myocardial infarction (MI), and all-cause of death. A set of pair-wise meta-analyses using a random effect model and a random effect network meta-analysis under a Bayesian framework were performed. Prospero registration number: CRD42019137111. We included 21 studies with 605 771 AF patients. Apixaban was associated with lower major and GI bleeding compared with Rivaroxaban [hazard ratio (HR) 2.0, 95% confidence interval (CI) 1.6–2.5] and Dabigatran (HR 1.6, 95% CI 1.3–2.1). The latter drug performed better than Rivaroxaban (HR 1.2, 95% CI 1.0–1.5). Dabigatran and Apixaban had a similar association with HS, but Apixaban performed better than Rivaroxaban (HR 1.8, 95% CI 1.1–3.0). Apixaban had a similar association with Rivaroxaban and Dabigatran for ICH, the latter drug performing better than Rivaroxaban (HR 1.3, 95% CI 1.0–1.7). Rankograms showed that Apixaban was likely to be the first-choice treatment in relation to any (65%) major (100%) and GI bleeding (100%) followed by Dabigatran (46%, 100%, 99%, respectively). Dabigatran and Apixaban had similar rank as first choice for ICH (44% and 55%) and HS (52% and 48%). DOACs showed similar association with IS/SE, MI, all-cause of death.
Analysis of real-world studies shows significant differences for safety among DOACs.
Introduction
Direct oral anticoagulants (DOACs) are progressively replacing vitamin K antagonists (VKAs) for the thromboprophylaxis treatment of patients with atrial fibrillation (AF), with higher quality of life, patients-reported satisfaction and adherence to anticoagulation treatment.1
For these reasons, DOACs are now guideline-recommended as first choice for patients with AF and CHA2DS2VASc ≥2,2 and anticoagulation treatment may be considered in patients with one additional risk factor beyond sex upon risk-benefit evaluation.2–4 Evidence from phase 3 randomized clinical trials (RCTs) showed that, DOACs are as effective as VKAs for the prevention of ischaemic complications.5,6 Regarding the safety of DOACs, RCTs clearly showed a benefit compared to VKAs with a significant reduction of intracranial bleeding.5 Conversely, use of DOACs was generally associated with an increased risk of gastrointestinal (GI) bleeding.5
The safety and efficacy of DOACs in real-world clinical settings have been under scrutiny, especially since head to head randomized controlled clinical trials directly comparing DOACs have not been performed.7 This poses some issues for clinicians, as patients enrolled in the controlled setting of RCTs may have significantly different clinical characteristics from those encountered in daily clinical practice; indeed, some subgroups of patients at higher risk of ischaemic and bleeding complications have been excluded or were under-represented in RCTs.8
It is therefore important to have metadata on a large sample of patients included in observational cohort studies that despite having some intrinsic methodology limitations, may help discover some difference in the safety and efficacy of DOACs in cohorts of unselected patients.
Thus far, pooled data on observational studies comparing the safety and efficacy of different DOACs are not available.
The aim of our study was to perform a network meta-analysis including only observational studies which compared DOACs for safety endpoints including any, major, GI bleeding, intracranial haemorrhage (ICH), and haemorrhagic stroke (HS). In addition, as secondary endpoints we analysed efficacy outcomes such as ischaemic stroke (IS), systemic embolism (SE), a composite endpoint of IS/SE, myocardial infarction (MI), and all-cause of death.
Methods
Eligibility criteria and research strategy
We performed a systematic review of the literature searching MEDLINE via PubMed and Cochrane (CENTRAL) database using a combination of the following keywords: ‘atrial fibrillation’, ‘DOAC’, ‘NOAC’, ‘non vitamin K antagonists’, ‘direct oral anticoagulants’, ‘bleeding events’, ‘major bleeding’, ‘gastrointestinal bleeding’, ‘intracranial haemorrhage’, ‘haemorrhagic stroke’, ‘ischaemic stroke’, ‘systemic embolism’, ‘death’, ‘myocardial infarction’. The research strategy was performed according to PRISMA guidelines with no time restrictions until 8 March 2020 (Supplementary material online, Figure S1). The systematic review was registered at PROSPERO (https://www.crd.york.ac.uk/PROSPERO) with registration number CRD42019137111.
We included only journal articles in English language with full text available. We included observational (n = 21 for safety outcomes and n = 13 for efficacy outcomes) cohort studies. We excluded RCTs, cross-sectional and case–control studies, case reports, editorials/comments, letters, review and meta-analysis, and experimental studies.
Study selection and quality assessment
Two physicians (F.D.S. and D.M.) independently screened the titles and abstracts of manuscripts identified through the database searches to identify studies potentially eligible for further assessment. A third physician (D.P.) reviewed eligible studies for appropriateness and completeness. The study selection was performed in multiple phases. In the first phase, potentially relevant studies were obtained by combined searches of electronic databases using the selected above-mentioned keywords. Then, studies not in English language, not involving humans, or not addressing study question were excluded. In the second phase, studies were reviewed and selected according to the inclusion and exclusion criteria. The quality of observational studies was assessed by the Newcastle–Ottawa scale.9 Studies with a score ≥7 were considered of good quality. Quality assessment of each study is reported in Supplementary material online, Table S1.
Definition of safety and efficacy endpoints for each study included in the meta-analysis is reported in Supplementary material online, Table S2.
Statistical analysis
Patients characteristics as sex, age, mean thromboembolic risk score (CHA2DS2-VASc and CHADS2), follow-up time, percentages of comorbidities like diabetes mellitus, heart failure, history of MI or acute coronary syndrome, malignancies and concomitant use of proton pump inhibitor, and antiplatelet drugs were collected from each study. Outcomes were presented as the published hazard ratios (HRs) with 95% credible intervals. When HRs were not reported we estimated them from summary statistics with the methods described by Tierney et al.10
Several random-effects pairwise meta-analyses were performed for every comparison. Statistical heterogeneity for each meta-analysis was assessed by considering the I2 statistic and P-value. Potential publication bias was evaluated through funnel plots and Egger’s linear regression test.
For each outcome, a network diagram was utilized to illustrate the amount of evidence available. The size of the nodes is proportional to the total number of patients included to the corresponding treatment across all studies and the width of the lines is proportional to the total number of studies evaluating the corresponding treatment comparison (Supplementary material online, Figure S2).
A Bayesian Network-Meta Analysis (NMA) with random-effects was estimated using Markov Chain Monte Carlo; two independent chains were run for 110 000 iterations each (the first 10 000 iterations were later discarded as burn-in) to obtain posterior distributions. The Brooks–Gelman–Rubin method was used to assess convergence. The probabilities for all treatments of being at each possible rank for each intervention were then estimated. Results are shown with rankograms.
Additionally, a Bayesian network meta-regression analysis was performed for age, sex, diabetes, previous MI, and duration of treatment to assess the possible role of these factors in predicting either cardiovascular or bleeding events in patients treated with DOACs. To do so, we used mixed-effects models which were estimated similarly to NMA models. Results of meta-regression were summarized by means of bubble plots, with bubbles proportional to the inverse variance of each study and trends estimated through non-parametric local polynomial regression.
Consistency between direct and indirect sources of evidence was assessed by separating evidence on each comparison. Comparison-adjusted funnel plot taking into account different comparisons were also plotted to explore whether there was evidence of small study effects within the network.
All statistical analyses for the network meta-analysis were performed using the software R (version 3.6.3), R package netmeta, GeMTC, and Jags (version 4.3.0).
Ethical review
Given the study type (review and meta-analysis article), an ethical approval was not required.
Results
In this meta-analysis, we included 21 studies reporting data on safety and 13 studies reporting data on efficacy endpoints according to different DOAC treatments11–31 (Supplementary material online, Table S3). The overall number of patients was 605 771, of whom 225 807 were on Dabigatran, 128 925 on Apixaban, 251 039 on Rivaroxaban (Table 1). Overall, both sexes were well represented with 333 447 (55.0%) of men. The median age was 72.71 years: 73.95 years in the Apixaban cohort, 72.35 years in the Dabigatran cohort, and 72.17 years in the Rivaroxaban group. The number of ischaemic and bleeding events in each treatment group is reported in Table 2.
Characteristics of studies included in the meta-analysis
| Study (year) | Study design | Number of patients | Age (years) | Men (%) | Diabetes (%) | Heart failure (%) | Prior cardiovascular disease (%) | Antiplatelet (%) | HAS- BLED | CHA2DS2 VASC | CHADS2 |
|---|---|---|---|---|---|---|---|---|---|---|---|
| Hernandez (2017)11 | Ra | 17 505 | 77.1 | 44.3 | 45.40 | 55.78 | 7.53 | 6.81 | — | — | 3.42 |
| Al-Khalili (2016)12 | R | 766 | 72.7 | 50.6 | 11.26 | 10.34 | 8.22 | — | — | 3.00 | — |
| Gorst-Rasmussen (2016)13 | R | 11 313 | 72.8 | 53.7 | 14.01 | 6.42 | — | 51.21 | 2.24 | 2.91 | 1.48 |
| Brook (2019)14 | R | 658 | 75.0 | 51.5 | — | — | — | 17.30 | — | 4.00 | — |
| Godino (2019)15 | R | 632 | 71.7 | 63.7 | 18.32 | 18.34 | 13.58 | 17.71 | 2.01 | 3.68 | — |
| Ellis (2016)16 | R | 1322 | 81.2 | 56.0 | — | — | — | 54.06 | — | — | 3.79 |
| Tepper (2018)17 | R | 60 277 | 69.0 | 63.9 | 29.91 | 18.21 | 6.27 | 6.56 | 1.81 | 1.61 | — |
| Noseworthy (2016)18 | Ra | 57 788 | 71.2 | 56.9 | 34.71 | 29.16 | — | 11.44 | 2.00 | 4.00 | — |
| Graham (2016)19 | R | 118 891 | — | 53.0 | 14.50 | 6.59 | 0.88 | 6.15 | — | — | — |
| Lip (2016)20 | Ra | 32 926 | 67.8 | 63.0 | 27.61 | 18.64 | 5.85 | — | 2.05 | 2.65 | 1.68 |
| Chan (2016)21 | Ra | 9837 | 75.4 | 53.2 | 41.00 | 16.00 | 3.40 | — | 3.12 | 4.10 | — |
| Lamberts (2017)22 | R | 30 091 | 73.0 | 54.1 | 12.12 | 16.34 | — | 49.10 | 2.14 | 2.91 | — |
| Adeboyeje (2017)23 | Ra | 20 626 | 70.0 | 58.9 | 28.58 | 28.08 | — | 10.50 | 2.10 | 2.87 | — |
| Amin (2018)24 | Ra | 23 994 | 72.1 | 57.6 | 32.61 | 25.22 | 9.10 | 14.13 | 2.70 | 3.70 | 2.25 |
| Elvira Ruiz (2019)25 | R | 2292 | 76.0 | 47.0 | 30.09 | 18.44 | — | 5.97 | 2.70 | 3.90 | — |
| Jansson (2019)26 | R | 25 843 | 73.2 | 57.3 | 16.44 | 12.20 | 15.75 | — | — | 2.75 | — |
| Amin and Keshishian (2018)27 | R | 72 444 | 78.1 | 48.4 | 25.78 | 20.50 | 7.88 | 11.53 | 3.21 | 3.21 | 1.92 |
| Fauchier (2020)28 | Ra | 8658 | 88.1 | 36.2 | 16.20 | 28.15 | 5.45 | 52.80 | — | 4.00 | — |
| Deitelzweig (2017)29 | Ra | 18 274 | 77.1 | 53.0 | — | — | — | — | 2.90 | 4.37 | 2.60 |
| Norby (2017)30 | Ra | 33 914 | 67.2 | 65.9 | 23.45 | 19.40 | 5.35 | 8.90 | — | 2.60 | — |
| Abraham (2017)31 | Ra | 57 788 | 70.7 | 56.9 | 34.80 | 29.08 | — | — | 2.32 | 3.78 | — |
Propensity matching.
Number of patients and bleeding (A) and ischaemic (B) events according to each DOAC
| Safety endpoints (%) | ||||||
| Treatment | Patients | Any bleeding | Major Bleeding | ICH | GI bleeding | HS |
| Apixaban | 128 925 | 1023 (0.8) | 2110 (1.64) | 204 (0.16) | 752 (0.58) | 75 (0.06) |
| Dabigatran | 225 807 | 5469 (2.42) | 3467 (1.53) | 416 (0.18) | 2557 (1.13) | 39 (0.02) |
| Rivaroxaban | 251 039 | 5525 (2.2) | 5395 (2.15) | 589 (0.23) | 3444 (1.37) | 122 (0.05) |
| Overall | 605 771 | 12 017 (1.98) | 10 972 (1.81) | 1209 (0.20) | 6753 (1.11) | 236 (0.04) |
| Efficacy endpoints (%) | ||||||
| Treatment | Patients | IS | SE | IS/SE | Myocardial infarction | All-cause death |
| Apixaban | 82 471 | 420 (0.51) | 25 (0.03) | 448 (0.54) | 125 (0.15) | 514 (0.62) |
| Dabigatran | 147 934 | 1947 (1.32) | 528 (0.36) | 814 (0.55) | 558 (0.38) | 2095 (1.42) |
| Rivaroxaban | 169 348 | 1588 (0.94) | 425 (0.25) | 696 (0.41) | 530 (0.31) | 2094 (1.24) |
| Overall | 399 753 | 3955 (0.99) | 978 (0.24) | 1957 (0.49) | 1213 (0.30) | 4703 (1.18) |
GI, gastrointestinal; HS, haemorrhagic stroke; ICH, intracranial haemorrhage; IS, ischaemic stroke; SE, systemic embolism.
Primary safety endpoints
Comparison of DOACs according to each safety endpoint is shown in Figure 1.
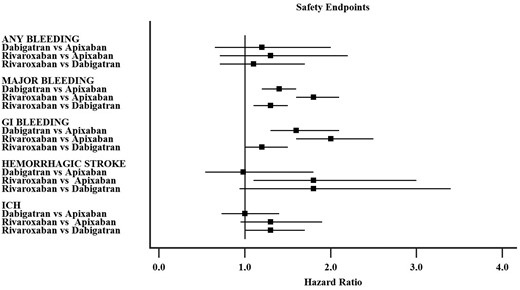
Summary of hazard ratio for each safety endpoint from the network meta-analysis (individual hazard ratios for each study are available in the Supplementary material online).
Any bleeding
Seven studies reported data on any bleeding with 12 017 events. The comparisons among DOACs showed no significant difference with regards to any bleeding (Supplementary material online, Figure S3A). The pooled HR of Dabigatran vs. Apixaban was 1.2, 95% confidence interval (CI) 0.65–2.0 with no heterogeneity (I2 0%), the HR for Rivaroxaban vs. Apixaban was 1.3, 95% CI 0.71–2.22 with high heterogeneity (I2 78.8%) and HR 1.1, 95% CI 0.71–1.7 for Rivaroxaban vs. Dabigatran with high heterogeneity (I2 96%). No significant effect on comparisons was found for age and sex (Supplementary material online, Figure S4).
Major bleeding
Seventeen studies reporting data on major bleeding were included with 10 972 events. The pooled HR (Supplementary material online, Figure S3B) for Dabigatran vs. Apixaban comparison was 1.4, 95% CI 1.2–1.6 with low heterogeneity (I2 37.8%), 1.8, 95% CI 1.6–2.1 for Rivaroxaban vs. Apixaban with modest heterogeneity (I2 59.1%), and 1.3, 95% CI 1.1–1.5 for Rivaroxaban vs. Dabigatran with high heterogeneity (I2 78.8%).
Meta-regression analysis showed that the difference between Dabigatran and Apixaban increased with the proportion of elderly patients, diabetes, and heart failure (Supplementary material online, Figure S5). Conversely, it was reduced in studies with high proportion of men and single antiplatelet use; no effect of prevalent cardiovascular disease was found. The difference between Rivaroxaban and Apixaban was consistent in all meta-regression analyses (Supplementary material online, Figure S5).
GI bleeding
Fifteen studies reported on GI bleedings, with 6753 events. The network analysis (Supplementary material online, Figure S3C) showed a pooled HR of 1.6, 95% CI 1.3–2.1 for Dabigatran vs. Apixaban comparison with low heterogeneity (I2 49.5%), HR 2.0, 95% CI 1.6–2.5 for Rivaroxaban vs. Apixaban comparison with low heterogeneity (I2 28.2%), and HR 1.2, 95% CI 1.0–1.5 for Rivaroxaban vs. Dabigatran with high heterogeneity (I2 89.0%).
Meta-regression analysis showed that the differences between Dabigatran and Apixaban increased with the proportion of elderly patients, diabetes, heart failure, and marginally with single antiplatelet use (Supplementary material online, Figure S6). Conversely, differences were reduced in studies with high proportion of men and no effect of prevalent cardiovascular disease was found.
Meta-regression analysis showed that the difference between Rivaroxaban and Apixaban was not modified by age but increased with the proportion of diabetes, heart failure and marginally with single antiplatelet use and prevalent cardiovascular disease (Supplementary material online, Figure S6). Conversely, a trend towards a reduction with the proportion of men was noted.
Cerebral bleeding
Four studies reported data on HS with 236 events, while 14 studies analysed ICH with 1209 events. The network analysis (Supplementary material online, Figure S3D) for the HS endpoint showed a pooled HR of 0.98, 95% CI 0.54–1.8 for Dabigatran vs. Apixaban comparison with no heterogeneity (I2 0%), HR 1.8, 95% CI 1.1–3.0 in the Rivaroxaban vs. Apixaban with low heterogeneity (I2 19.8%), and HR 1.8, 95% CI 0.94–3.4 in the Rivaroxaban vs. Dabigatran with no heterogeneity (I2 0%).
Analysis of ICH (Supplementary material online, Figure S3E) showed a pooled HR of 1.0, 95% CI 0.73–1.4 in the Dabigatran vs. Apixaban comparison with low heterogeneity (I2 4.0%), HR 1.3, 95% CI 0.95–1.9 in the Rivaroxaban vs. Apixaban comparison with no heterogeneity (I2 0%), and HR 1.3, 95% CI 1.0–1.7 in the Rivaroxaban vs. Dabigatran with modest heterogeneity (I2 70%).
Meta-regression analysis showed no significant effect of age and sex in the comparison between Dabigatran with Apixaban and Rivaroxaban with Apixaban for both HS and ICH (Supplementary material online, Figures S7 and S8).
Funnel plots for each endpoint are shown in Supplementary material online, Figure S9.
DOACs comparison according to bleeding risk
We performed a Bayesian network meta-regression analysis to compare the safety of DOACs according to the bleeding risk, as assessed by the HAS-BLED score. Regarding major bleeding, Apixaban performed better than Dabigatran and Rivaroxaban regardless of bleeding risk while Rivaroxaban and Dabigatran performed similarly in patients with high bleeding risk (Supplementary material online, Figure S10A). The safety profile of Apixaban compared to Dabigatran regarding GI bleeding was more evident in high bleeding risk patients and was similar compared to Rivaroxaban in all bleeding risk groups (Supplementary material online, Figure S10B). The comparison between Rivaroxaban and Dabigatran was not influenced by the bleeding risk (Supplementary material online, Figure S10B).
The three DOACs performed similarly regarding ICH (Supplementary material online, Figure S10C).
Secondary efficacy endpoints
Forest plot for comparison of DOACs according to each efficacy endpoint is shown in Figure 2.
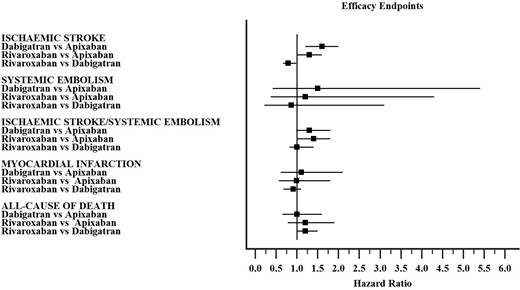
Summary of hazard ratio for each efficacy endpoint from the network meta-analysis (individual hazard ratios for each study are available in the Supplementary material online).
Ischaemic stroke
Nine studies reported data on IS with 3955 events (Supplementary material online, Figure S11A). The pooled HR of Dabigatran vs. Apixaban was 1.6, 95% CI 1.2–2.0 with moderate heterogeneity (I2 45.5%), the HR for Rivaroxaban vs. Apixaban was 1.3, 95% CI 1.00–1.60 with low heterogeneity (I2 5.2%) and HR 0.79, 95% CI 0.67–0.98 for Rivaroxaban vs. Dabigatran with no heterogeneity (I2 0.0%).
Systemic embolism
Four studies reported data on SE with 978 events. The comparisons among DOACs showed no significant difference among DOACs (Supplementary material online, Figure S11B). The pooled HR of Dabigatran vs. Apixaban was 1.5, 95% CI 0.42–5.40 with no heterogeneity (I2 0.0%), the HR for Rivaroxaban vs. Apixaban was 1.2, 95% CI 0.37–4.30 with no heterogeneity (I2 0.0%), and HR 0.86, 95% CI 0.22–3.10 for Rivaroxaban vs. Dabigatran with no heterogeneity (I2 0.0%).
Ischaemic stroke/systemic embolism
Seven studies reported data on IS/SE with 1957 events. The comparisons among DOACs showed no significant difference with regards to IS/SE (Supplementary material online, Figure S11C). The pooled HR of Dabigatran vs. Apixaban was 1.3, 95% CI 0.98–1.80 with high heterogeneity (I2 62.0%), the HR for Rivaroxaban vs. Apixaban was 1.4, 95% CI 1.00–1.80 with moderate heterogeneity (I2 44.1%), and HR 1.0, 95% CI 0.82–1.40 for Rivaroxaban vs. Dabigatran with high heterogeneity (I2 81.5%).
Myocardial infarction
Seven studies reported data on MI with 1213 events. The comparisons among DOACs showed no significant difference with regards to MI (Supplementary material online, Figure S11D). The pooled HR of Dabigatran vs. Apixaban was 1.1, 95% CI 0.61–2.10, but heterogeneity was not estimated due to low number of studies included, the HR for Rivaroxaban vs. Apixaban was 0.99, 95% CI 0.56–1.80 without heterogeneity evaluation and HR 0.91, 95% CI 0.68–1.10 for Rivaroxaban vs. Dabigatran with low heterogeneity (I2 4.3%).
All-cause of death
Seven studies reported data on all-cause of death with 4703 events. The comparisons among DOACs showed no significant difference with regards to all-cause of death (Supplementary material online, Figure S11E). The pooled HR of Dabigatran vs. Apixaban was 1.0, 95% CI 0.65–1.6, but heterogeneity was not estimated due to low number of studies included, the HR for Rivaroxaban vs. Apixaban was 1.2, 95% CI 0.78–1.90 without heterogeneity evaluation and HR 1.2, 95% CI 0.99–1.50 for Rivaroxaban vs. Dabigatran with high heterogeneity (I2 68.6%).
Rankograms
Analysis of rankograms showed that Apixaban was more likely to be the first-choice treatment in relation to any (65%) major (100%) and GI bleeding (100%) followed by Dabigatran (46%, 100%, 99%, respectively). Dabigatran and Apixaban had similar rank as first choice for ICH (44% and 55%) and HS (52% and 48%) (Table 3).
Rankograms (%) values for treatments in bleeding (A) and ischaemic (B) outcomes
| Panel A—safety endpoints | Panel B—efficacy endpoints | ||||||
|---|---|---|---|---|---|---|---|
| Treatment | First choice | Second choice | Third choice | Treatment | First choice | Second choice | Third choice |
| Any bleeding | All-cause death | ||||||
| Apixaban | 65% | 21% | 15% | Apixaban | 53% | 32% | 15% |
| Dabigatran | 24% | 46% | 29% | Dabigatran | 46% | 52% | 2% |
| Rivaroxaban | 11% | 33% | 56% | Rivaroxaban | 1% | 16% | 83% |
| Major bleeding | IS | ||||||
| Apixaban | 100% | 0% | 0% | Apixaban | 97% | 3% | 0% |
| Dabigatran | 0% | 100% | 0% | Dabigatran | 0% | 2% | 98% |
| Rivaroxaban | 0% | 0% | 100% | Rivaroxaban | 3% | 95% | 2% |
| GI bleeding | IS-SE | ||||||
| Apixaban | 100% | 0% | 0% | Apixaban | 96% | 4% | 1% |
| Dabigatran | 0% | 99% | 1% | Dabigatran | 3% | 62% | 35% |
| Rivaroxaban | 0% | 1% | 99% | Rivaroxaban | 1% | 35% | 64% |
| ICH | SE | ||||||
| Apixaban | 55% | 41% | 4% | Apixaban | 61% | 23% | 16% |
| Dabigatran | 44% | 53% | 2% | Dabigatran | 12% | 27% | 61% |
| Rivaroxaban | 1% | 6% | 94% | Rivaroxaban | 27% | 50% | 23% |
| HS | Myocardial infarction | ||||||
| Apixaban | 48% | 51% | 1% | Apixaban | 47% | 17% | 36% |
| Dabigatran | 52% | 45% | 3% | Dabigatran | 9% | 36% | 55% |
| Rivaroxaban | 1% | 4% | 96% | Rivaroxaban | 44% | 47% | 9% |
GI, gastrointestinal; HS, haemorrhagic stroke; ICH, intracranial haemorrhage; IS, ischaemic stroke; SE, systemic embolism.
Regarding secondary endpoints, Apixaban and Dabigatran had a similar chance of being first-choice treatment (53% and 46%, respectively) and Dabigatran second choice (46%) for all-cause death (Table 3). For the IS/Se endpoint, Apixaban was the first-choice treatment (96%) while Dabigatran (62%) and Rivaroxaban (35%) were more likely to be second choice (Table 3). In relation to MI, a similar chance of being first choice treatment for Apixaban (47%) and Rivaroxaban (44%); second choice treatments were Rivaroxaban (47%) and Dabigatran (36%) (Table 3).
Graphical rankograms for each safety and efficacy endpoint are reported in Supplementary material online, Figure S12.
Discussion
This is the largest network meta-analysis comparing safety and efficacy of DOACs in observational real-life studies on non-valvular AF patients. Our analysis provides important information on some difference among DOACs according to the specific safety endpoint considered.
Our principal finding was that Apixaban was associated with lower risk of major and GI bleeding compared to Rivaroxaban and Dabigatran. This finding is in agreement with results from a previous network meta-analysis including only data from RCTs, which showed that Apixaban lowered the risk of major bleeding [risk ratio (RR) 0.74; 95% CI 0.60–0.91] and GI bleeding (RR 0.58; 95% CI 0.41–0.82) vs. Dabigatran and major bleeding vs. Rivaroxaban (RR 0.68; 95% CI 0.55–0.83).32 In contrast with this previous analysis32 that did not show any difference in RCTs, we found a lower rate of major and GI bleeding in patients treated with Dabigatran compared to Rivaroxaban. However, the high heterogeneity of these comparisons warrants caution in their interpretation.
The advantage of Apixaban use on GI bleeding rate was more evident in studies with a high proportion of patients suffering from diabetes and heart failure. A recent large retrospective analysis focusing on patients with AF and diabetes including a total of 154 324 patients showed a lower rate of major bleeding in Apixaban-treated patients compared with Dabigatran and Rivaroxaban.33
A large retrospective study including only AF patients with HF comparing 4263 Apixaban-Dabigatran and 10 477 Apixaban-Rivaroxaban, matched pairs, showed that Apixaban was associated with lower major bleeding compared to Dabigatran and Rivaroxaban (HR 0.71, 95% CI 0.57–0.89; HR 0.55, 95% CI 0.49–0.63, respectively).34
Regarding cerebral bleeding, we found a similar performance of Dabigatran with Rivaroxaban and Apixaban for HS, but Apixaban seems to confer an advantage over Rivaroxaban for this endpoint. Despite the low heterogeneity of this comparison, the low overall number of HS events should be considered.
The performance of Apixaban for ICH was similar to that of Dabigatran and Rivaroxaban. Of note, we found a marginally lower rate of ICH in Dabigatran-treated AF patients than Rivaroxaban ones. The interpretation of this finding would require a better dose-dependent analysis, as suggested by a previous indirect comparison analysis of phase III clinical trials in which Dabigatran 110 mg b.i.d. but not 150 mg b.i.d. was associated with lower ICH than Rivaroxaban.35
Regarding efficacy endpoints, our results showed a slightly lower risk of IS/SE in patients treated with Apixaban and Rivaroxaban compared to Dabigatran, while no differences were found about MI, all-cause of death and SE. This finding is of particular interest considering that a previous analysis showed that characteristics of patients in observational studies are different from clinical trials, as shown by the higher CHA2DS2-VASc scores (3.6 vs. 2.9) of patients in clinical practice translating into an excess of thromboembolism incidence than expected.36
Clinical implications
The strength of this meta-analysis relies on the very large sample of patients included and high number of events for each endpoint, and on the generally low heterogeneity found in DOACs comparisons, which make our results robust. Our results provide further data on the safety and efficacy of DOACs in addition to the evidence from RCTs. Thus, although phase III clinical trials provide the highest-quality level of evidence it is important to have results from observational real-life cohort studies,37 as patients in daily clinical practice may substantially differ from those included in RCTs, in terms of comorbidities as very elderly or patients with cancer or advanced chronic and liver disease are usually excluded or under-represented. Furthermore, patients included in RCT are usually strictly monitored and length of follow-up is usually limited.
Limitations
This analysis has several limitations to acknowledge which are mainly related to the observational design of the studies and to the use of network meta-analysis. Given the lack of head-to-head trials comparing the safety and efficacy of DOACs these results should be intended as indirect comparisons with some possible not considered missing confounding factors. To partially overcome this limitation, we used the HR derived from a multivariable-adjusted Cox proportional hazard regression analysis or propensity score matching, to ensure that the analyses were adjusted at least for the most frequent cardiovascular comorbidities commonly found in patients with AF. The generally high heterogeneity in the comparisons between Rivaroxaban and Dabigatran does not allow to draw any definite conclusions. Furthermore, there is still not enough evidence from real-life studies to compare Edoxaban with other DOACs. A subgroup analysis according to drug dosage was not possible as studies did not report the number of events according to high and low dose of DOACs.
In addition, the appropriateness of DOAC prescription may also have influenced the results, as patients prescribed on an inappropriately high dose of DOAC may experience more bleeding events. Thus, inappropriate dosing of DOACs may be detected in up to 30% of AF patients.38 In the prospective GARFIELD-AF (Global Anticoagulant Registry in the FIELD-AF), 10 426 patients received a DOAC, of whom 23.2% were underdosed, and 3.8% were overdosed: importantly, non-recommended dosing (both underdosage and overdosage) was associated with a higher all-cause mortality, and underdosed patients showed had a significantly lower risk of bleeding.39 These factors may influence safety results, and for this reason, data on dosing appropriateness should always be reported in observational studies.
Another potential confounding factor includes the lack of data on adherence to anticoagulation treatment over time. Previous studies have shown that cessation of oral anticoagulation was associated with an increased risk of death.40,41 It should be also noted that survival models were built using the first event occurred during follow-up, thus we have no information on potential multiple events (i.e. death after a first event).
Finally, we could not analyse the different types of ICH such as intracerebral, subarachnoid, and subdural as this classification was missing in the studies.
In conclusion, results from this large real-world meta-analysis show a better safety profile of Apixaban in comparison to Rivaroxaban and Dabigatran for major and GI bleeding. In addition, Apixaban and Rivaroxaban had a lower risk of IS compared to Dabigatran. A similar performance of the three DOACs with regard to cerebral bleeding, MI, all-cause of death and SE was found.
Supplementary material
Supplementary material is available at European Heart Journal – Cardiovascular Pharmacotherapy online.
Data availability
All available data are published within the present study.
Conflict of interest: G.Y.H.L.: consultant for Bayer/Janssen, BMS/Pfizer, Boehringer Ingelheim, Verseon and Daiichi-Sankyo. Speaker for BMS/Pfizer, Boehringer Ingelheim, and Daiichi-Sankyo. No fees are directly received personally. The other authors declare no conflict of interest.
References
Author notes
Danilo Menichelli, Francesco Del Sole and Arianna Di Rocco authors contributed equally to the study.
Gregory Y H Lip and Daniele Pastori authors are joint senior authorship.
