


Abstract
This prospective, two-centre study derived and validated predictive algorithms for the Siemens Atellica IM high-sensitivity cardiac troponin I (hs-cTnI) assay in the emergency department (ED).
Algorithms for predicting 30-day myocardial infarction (MI) Types 1 and 2 and death or non-ST-elevation MI (NSTEMI, Types 1 and 2) at index admission were developed from a derivation cohort of 1896 patients and validated using a synthetic data set with nearly 1 million patient cases. Performance was compared with the European Society of Cardiology algorithms for hs-cTnT (Roche Diagnostics) and hs-cTnI (Abbott Diagnostics). An admission hs-cTnI concentration < 5 ng/L had a negative predictive value (NPV) and sensitivity for 30-day MI or death of 99.5–99.7% and 98.1–98.8%, respectively, in the derivation cohort and validation data set. The NPV and sensitivity were ≥99.7% and ≥98.8% for ruling out index NSTEMI. A 0- to 1-h algorithm with baseline hs-cTnI concentration < 10 ng/L and Δ change < 3 ng/L had NPV of ≥99.5% and sensitivity ≥ 97.3% for predicting 30-day MI or death and a ≥99.5% sensitivity and NPV for index NSTEMI. Rule-in algorithms of either 0-h hs-cTnI ≥ 120 ng/L or 0- to 1-h Δ change ≥ 12 ng/L had positive predictive value ≥ 73% and specificity > 96% for 30-day MI or death and index NSTEMI. The results were comparable with established hs-cTn algorithms.
This study presents Siemens Atellica hs-cTnI algorithms for diagnosis and risk prediction in the ED with performance comparable with established hs-cTnT (Roche) and hs-cTnI (Abbott) algorithms.
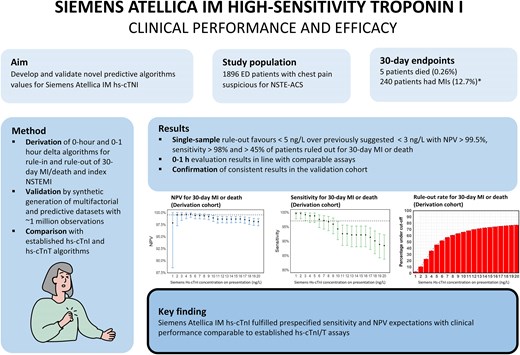
*Patients who both had MI and died are counted in both groups of the figure only for illustrative purposes, though in the statistical analysis each patient could at most count for one positive endpoint.
Introduction
Patients presenting to emergency departments (EDs) with symptoms suspicious for acute coronary syndromes (ACS) constitute a significant proportion of all ED evaluations, although only a minor percentage (10–30%) are eventually diagnosed with ACS.1,2 Rapid diagnostic clarification of these patients is imperative both from a treatment and logistical perspective.
The European Society of Cardiology (ESC) has published guidelines for the rapid evaluation of possible non-ST-elevation myocardial infarction (NSTEMI), suggesting that clinical evaluation should be combined with cardiac troponins measured at admission and after 1 h in the rule-in and rule-out of AC,; specifically high-sensitivity cardiac troponins (hs-cTn).2
Differences in patient cohorts and health care systems, as well as assay stability, may influence the performance of these algorithms.2 Accordingly, rigorous and repeated clinical evaluations taking all these aspects into account are necessary to establish assay performance.3,4 A permanent challenge in the development of hs-cTn algorithms aiming for very high sensitivity (97–99%) and negative predictive value (NPV) (>99.5%)5 is the so-called small number problem, wherein a very small number of patients with lower tail concentrations will have a disproportionate effect on derived algorithms. For instance, if the cut-off derived from a cohort with e.g. 100 events aims for a sensitivity of 99%, the cut-off concentration must be placed between the lowest and second lowest admission concentration in the event group.6 This implies large uncertainty in the data as the applicable cut-off could be markedly different in another cohort, merely from coincidence. Splitting the original cohort into even smaller derivation and validation cohorts, which is a common method for evaluating 0- to 1-h algorithms, further accentuates this problem.6,7
A novel concept developed to reduce the uncertainty in suggested cut-offs proposes to derive the cut-offs from the complete data set and then validate them based on a very large number of synthetically generated patients, themselves derived from the cohort of real patients.8,9
Earlier studies have proposed different algorithms for the Siemens Atellica IM hs-cTnI assay,10–13 but there remains uncertainty about the optimal cut-offs, in part due to the small number problem. We aimed to use the novel concept outlined above and derived cut-offs based on data from the two-centre WESTCOR study, with subsequent validation in a 500 times larger synthetic cohort (c. 1 million patient cases).
Methods
Study design
The WESTCOR study (clinical trial number NCT02620202) is a two-centre prospective observational study previously described in detail.14 Patients admitted to Haukeland University Hospital (HUH, Bergen, Norway) and Stavanger University Hospital (SUH, Stavanger, Norway) with suspected non-ST-elevation ACS (NSTE-ACS) in the period from 2015 to 2020 were eligible for inclusion. Data from the HUH cohort have been previously published,15–17 but this paper is the first to also include the SUH cohort. The study and biobank were approved by the Regional Committees for Medical and Health Research Ethics (2014/1365 REK West and 2014/1905 REK West).
Study enrolment
Patients eligible for inclusion were ≥18 years, referred with chest pain or symptoms suggestive of NSTE-ACS, had life expectancy > 2 months, and could provide informed consent. In total, 1896 patients fulfilled all criteria and had sufficient biomaterial for analysis.
Biochemical analyses
Blood samples were drawn shortly after arrival to the ED; and after 1, 3, and 8–12 h, 1190 patients (63%) had blood samples available at both 0 and 1 h after admission. The samples were processed and stored at −80°C. At HUH, hs-cTnT was measured in fresh serum samples using the Roche Diagnostics hs-cTnT assay, whereas SUH measured hs-cTnI in fresh serum samples using the Abbott Diagnostics hs-cTnI assay. Biobanked and frozen samples were then exchanged between the two study centres for measurement of the non-local hs-cTn assay. Both centres thereafter sent frozen, biobanked samples for measurement of hs-cTnI by the Siemens Atellica IM, which was performed at Vestre Viken Hospital Trust (Bærum, Norway). The glomerular filtration rate was estimated using the CKD-EPI (Chronic Kidney Disease Epidemiology Collaboration) formula.18 The relevant assay characteristics are provided in Supplementary material online, Methods.
Endpoints and adjudication
The primary endpoint was a combination of 30-day MI or death. The secondary endpoint was NSTEMI at index hospitalization. Both MI Type 1 and Type 2 were included in the diagnosis of MI. The choice of 30-day outcome as the primary endpoint was chosen to optimize safety over initial accuracy, as minimizing serious adverse events was considered more clinically important than increasing the discharge rate from the ED. Adjudication was done by two independent cardiologists who reviewed all clinical information (including imaging and laboratory data) before determining the final diagnosis, while a third cardiologist solved disagreements (see Supplementary material online, Methods). The adjudicators were blinded to the hs-cTnI Siemens results. Non-ST-elevation myocardial infarction was defined according to the third universal definition for MI (which was current during the planning of the study).19 High-sensitivity cTnT (Roche) was used for adjudication of the patients included at HUH (n = 1490), while high-sensitivity cTnI (Abbott) was used for adjudication at SUH (n = 406). Follow-up data were provided from the Norwegian Patient Registry and the Norwegian Cause of Death Registry.
Derivation of proposed rule-out and rule-in algorithms
Baseline and Δ concentrations for the hs-cTnI (Siemens) assay were systematically tested to derive algorithms for the rule-out of 30-day MI or death and compared with the established hs-cTn algorithms; starting at the limit of detection (1 ng/L) (for determining the very low, low, and 1-h Δ, respectively) and increasing by 1 ng/L until a rule-out algorithm with NPV > 99.5%, sensitivity > 97% and the highest possible specificity had been determined. For rule-in algorithms, we attempted to achieve a positive predictive value (PPV) > 75% or at least a comparable discriminatory capability as the algorithms for hs-cTnT (Roche) and hs-cTnI (Abbott) suggested by the ESC.2 The algorithms thus established were then used for the analysis of the secondary endpoint (index NSTEMI).
Validation of proposed rule-out and rule-in algorithms
The derived algorithms were tested in a synthetically generated cohort derived through mathematical extrapolation of the patient characteristics and troponin concentrations in the derivation cohort (Synthpop package in R).20 This statistical method utilizes classification and regression trees for the generation of synthetic data through the extrapolation of probability distributions including the generation of plausible troponin concentrations. The method can be considered a more advanced and robust form of statistical bootstrapping.8,20
Figure 1 shows the flow chart for the analysis. The predictive variables listed in the chart were used to generate 500 simulated data sets equal in size to the original data set and subsequently merged to one large data set including ∼1 million cases. This was done for the entire cohort and for subgroups: (i) patients with >3 h between symptom start and first blood draw and (ii) patients sampled at 0 and 1 h. The derived algorithms were then tested for the primary and secondary endpoints in the applicable data sets (all comers, patients with >3 h of symptoms and patients with a complete set of samples).
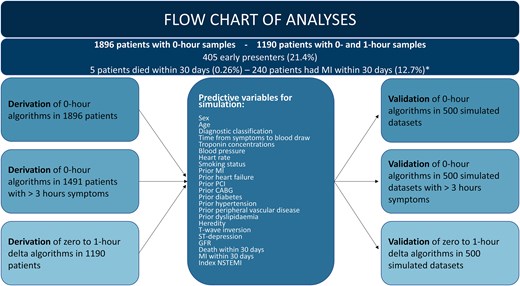
Flow chart overview of the analytical and methodological process for derivation of novel algorithms, generation and simulation of predictive variables, and synthetic validation. *Patients who both had MI and died are counted in both groups of the figure only for illustrative purposes, but in the statistical analysis each patient could at most count for one positive endpoint. CABG, coronary artery bypasss graft; GFR, glomerular filtration rate; MI, myocardial infarction; NSTEMI, non-ST-elevation myocardial infarction; PCI, percutaneous coronary intervention.
A supplementary analysis was done to derive thresholds to achieve 97% and 99% sensitivity for the two endpoints. From the combined synthetic data sets, 500 random sets of 1896 individuals were drawn and the mean thresholds, with 95% confidence intervals (CIs), were estimated (see Supplementary material online, Figure S1).
Statistical analysis
The baseline demographic characteristics of the patients are given as median levels with interquartile ranges for continuous data and percentages for categorical data. Comparison between groups was made using the non-parametric Kruskal–Wallis test for continuous variables and the χ2 and Fisher’s exact test for categorical variables, as appropriate. Diagnostic accuracy of continuous concentrations of hs-cTnT/I was quantified by using the area under the receiver operating characteristic curve in all patients. Areas under the curve (AUCs) were compared using the DeLong test.21 Statistical analyses further included calculations of sensitivity, specificity, NPV, and PPV for the tested algorithms.
We used SPSS Statistics 29 (IBM Corporation), MedCalc 17.6 (Medcalc Software Ltd), and RStudio 561 (RStudio Team) for the statistical analyses.
Results
Characteristics of patients
The derivation cohort consisted of 1896 patients with median age 65 years. Men made up 61.1% of the cohort. 12.3% had NSTEMI, 13.3% unstable angina pectoris, 58.4% non-cardiac chest pain (NCCP). The patients classified with NCCP were younger, more likely to be female and with less established cardiovascular disease or other risk factors. Overall, 21.4% of all patients had first blood draw <3 h after onset of symptoms, and 9.7% were sampled within 2 h (Table 1). Further information on diagnostic workup, in-hospital management, and discharge status is provided in Supplementary material online, Table S1.
Baseline characteristics of the patients in the derivation cohort
| Total | NSTEMI | UAP | Other cardiac | Non-cardiac | NCCP | |
|---|---|---|---|---|---|---|
| Descriptive factors | ||||||
| Patient count (%) | 1896 | 234 (12.3) | 252 (13.3) | 172 (9.1) | 131 (6.9) | 1107 (58.4) |
| Age, median, years | 62 (52–72) | 67 (57–76) | 68 (59–75) | 69 (58–80) | 68 (57–76) | 58 (49–68) |
| Male, % | 61.1 | 67.9 | 70.2 | 65.1 | 55.0 | 57.6 |
| BMI, median, kg/m2 | 26.9 (24.5–30.0) | 26.3 (24.1–29.7) | 26.1 (24.5–30.1) | 27.0 (24.9–29.5) | 27.8 (25.7–30.1) | 27.0 (24.5–30.0) |
| eGFR, median, mL/min/1.73 m2 | 86 (71–97) | 80 (67–95) | 82 (66–92) | 76 (60–91) | 83 (63–95) | 89 (77–100) |
| Symptoms to blood draw, median, hours | 8.2 (3.5–32.0) | 5.3 (2.8–22.9) | 12.8 (4.2–70.8) | 8.1 (3.3–32.0) | 9.0 (3.8–25.9) | 8.4 (3.5–30.6) |
| Very early presenters < 2 h, % | 9.7 | 12.4 | 7.5 | 15.1 | 9.2 | 8.9 |
| Early presenters < 3 h, % | 21.4 | 27.8 | 16.7 | 22.1 | 14.5 | 21.8 |
| Late presenters > 12 h, % | 42.1 | 31.6 | 51.2 | 41.9 | 43.5 | 42.1 |
| Hospital stay, median, hours | 29.0 (22.0–71.0) | 75.0 (63.0–122) | 74.5 (46.0–137) | 50.0 (24.7–97.2) | 30.0 (22.0–75.6) | 24.0 (19.0–31.0) |
| Risk factors | ||||||
| Hypertension, % | 42.6 | 50.9 | 54.4 | 48.3 | 45.0 | 36.9 |
| Hyperlipidaemia, % | 20.4 | 21.4 | 29.0 | 18.6 | 21.4 | 28.4 |
| Diabetes mellitus, % | 11.7 | 14.5 | 22.6 | 9.9 | 14.5 | 8.5 |
| Family history, % | 20.1 | 19.2 | 21.4 | 14.0 | 19.1 | 21.0 |
| Current smoker, % | 18.5 | 20.5 | 17.5 | 18.0 | 17.6 | 18.4 |
| Previous smoker, % | 41.5 | 47.2 | 40.1 | 45.8 | 42.8 | 42.6 |
| Medical history | ||||||
| Prior MI, % | 20.4 | 24.8 | 31.7 | 27.9 | 20.6 | 15.6 |
| Prior PCI, % | 20.5 | 22.2 | 39.3 | 26.2 | 17.6 | 15.3 |
| Prior CABG, % | 7.8 | 11.1 | 19.8 | 9.9 | 9.9 | 3.7 |
| Heart failure, % | 4.4 | 4.7 | 4.0 | 13.4 | 6.9 | 2.8 |
| Stroke, % | 3.3 | 3.4 | 5.6 | 5.2 | 3.1 | 2.5 |
| Peripheral vascular disease, % | 2.3 | 2.6 | 6.3 | 1.7 | 3.1 | 1.3 |
| Vital signs on admission | ||||||
| Systolic BP, median, mm Hg | 144 (130–160) | 147 (132–162) | 148 (134–160) | 139 (123–157) | 138 (126–158) | 144 (130–160) |
| Diastolic BP, median, mm Hg | 82 (75–91) | 84 (75–91) | 81 (75–91) | 80 (71–92) | 81 (73–90) | 83 (75–91) |
| Heart rate, median, b.p.m. | 71 (63–82) | 72 (63–80) | 70 (62–80) | 78 (65–98) | 74 (64–89) | 70 (63–80) |
| Electrocardiography | ||||||
| ST-segment depression, % | 3.8 | 15.8 | 2.8 | 5.8 | 2.3 | 1.4 |
| T-wave inversion, % | 4.3 | 14.1 | 6.0 | 7.0 | 2.3 | 1.6 |
| Biomarker concentrations | ||||||
| Troponin T (Roche), median, ng/L | 7 (3–16) | 48 (23–143) | 9 (6–17) | 15 (8–24) | 8 (3–15) | 5 (3–8) |
| Troponin I (Abbott), median, ng/L | 4 (2–10) | 95 (29–455) | 5 (3–11) | 7 (3–15) | 4 (2–10) | 2 (2–4) |
| Troponin I (Siemens), median, ng/L | 6 (3–17) | 154 (56–846) | 8 (4–20) | 10 (6–26) | 6 (3–15) | 4 (3–7) |
Numbers in parentheses for continuous data are the 25th and 75th percentile.
BMI, body mass index; BP, blood pressure; CABG, coronary artery bypass graft; eGFR, estimated glomerular filtration rate; MI, myocardial infarction; NCCP, non-cardiac chest pain; NSTEMI, non-ST-elevation myocardial infarction; PCI, percutaneous coronary intervention; UAP, unstable angina pectoris.
Primary and secondary endpoints
All MIs and deaths within 30 days of index admission are listed by event type and diagnostic classification in Supplementary material online, Table S2. There were 234 NSTEMIs at presentation (30 of which were classified as Type 2 MI) and an additional seven MIs outside of index. There were five deaths, for a total of 244 patients that fulfilled the primary endpoints.
Area under the curve/receiver operating characteristic analyses
Receiver operating characteristic curves and AUCs for the endpoints in the derivation cohort and validation data set were calculated for all three troponin assays. The AUCs were virtually identical in the derivation and validation groups for both endpoints, although with much tighter 95% CI in the validation data set, owing to a far larger data material. For the Siemens assay, AUC in the derivation cohort was 0.939 (95% CI 0.923–0.955) and 0.946 (95% CI 0.932–0.960) for the primary and secondary endpoints, respectively. The equivalent AUCs for the primary endpoint with the Roche and Abbott assays, respectively, were 0.916 (95% CI 0.897–0.935) and 0.937 (0.919–0.955). The AUCs for the hs-cTnT assay were consistently smaller than both hs-cTnI assays (see Supplementary material online, Figure S2 and Table S3).
Single-sample rule-out algorithms
Figure 2 shows the Siemens hs-cTnI concentrations at admission in all patients of the derivation cohort (Figure 2A) and validation data set (Figure 2B), with the subsets of patients with MI or death within 30 days (Figure 2C and D). In total, 46% of patients in the derivation cohort had a baseline hs-cTnI concentration of <5 ng/L, while 77% had a baseline concentration of <20 ng/L. The same relationship held true in the validation data set. Similarly, for the patients who died or had an MI within 30 days, around 1.0% (both data sets) had a baseline hs-cTnI of <5 ng/L. The relationships between NPV, sensitivity, and specificity for increasing cut-off values of hs-cTnI for predicting low risk of 30-day MI or death (‘rule out’) are illustrated in Figure 3.
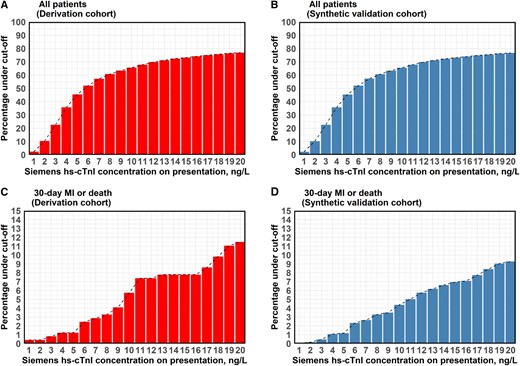
Cumulative percentage of patients cumulative percentage of patients who had baseline high-sensitivity cardiac troponin I (Siemens) concentrations below certain cut-off (0–20 ng/L) in all patients (A, B) and in the subgroup of patients who died or had myocardial infarction within 30 days of inclusion (C, D) for both derivation and validation cohort. hs-cTnI, high-sensitivity cardiac troponin I; MI, myocardial infarction.
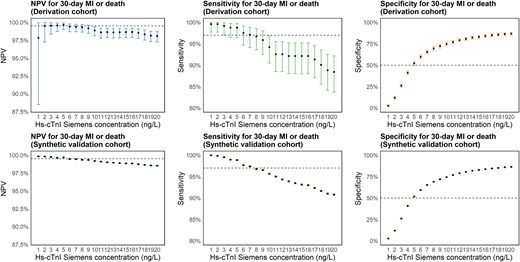
Negative predictive value, sensitivity, and specificity Negative predictive value, sensitivity, and specificity for 30-day myocardial infarction or death by baseline high-sensitivity cardiac troponin I (Siemens) concentrations below certain cut-offs (0–20 ng/L) in the derivation and validation cohort. Dashed line at 99.5% for NPV plots, 97% for sensitivity plots and 50% for specificity plots. hs-cTnI, high-sensitivity cardiac troponin I; MI, myocardial infarction; NPV, negative predictive value.
The highest NPV in the derivation cohort (99.7%) was achieved by a cut-off of <5 ng/L. Sensitivity was slightly higher with the cut-off < 3 ng/L, 99.2% vs. 98.8%, but NPV was lower, and the specificity was remarkably lower, 25.9% vs. 52.1% (Table 2; Supplementary material online, Table S4).
Single-sample rule-out
| Endpoint | 30-day MI or death | Index NSTEMI | ||||||
|---|---|---|---|---|---|---|---|---|
| Algorithm | Roche TnT 0 h < 5 ng/L | Abbott TnI 0 h < 4 ng/L | Siemens TnI 0 h < 3 ng/L | Siemens TnI 0 h < 5 ng/L | Roche TnT 0 h < 5 ng/L | Abbott TnI 0 h < 4 ng/L | Siemens TnI 0 h < 3 ng/L | Siemens TnI 0 h < 5 ng/L |
| Derivation cohort | ||||||||
| Sensitivity | 98.4 (95.8–99.5) | 95.9 (92.6–98.0) | 99.2 (97.1–99.9) | 98.8 (96.4–99.7) | 98.7 (96.3–99.7) | 96.1 (92.8–98.2) | 99.6 (97.6–100) | 99.1 (96.9–99.9) |
| NPV | 99.3 (98.2–99.8) | 99.0 (98.3–99.5) | 99.5 (98.3–99.9) | 99.7 (99.0–99.9) | 99.5 (98.5–99.9) | 99.1 (98.4–99.6) | 99.8 (98.7–100) | 99.8 (99.2–100) |
| Specificity | 34.1 (31.8–36.4) | 63.2 (60.8–65.6) | 25.9 (23.8–28.1) | 52.1 (49.6–54.5) | 33.9 (31.6–36.2) | 62.9 (60.5–65.2) | 25.8 (23.7–27.9) | 51.8 (49.3–54.2) |
| PPV | 18.0 (16.0–20.2) | 27.8 (24.8–30.9) | 16.5 (14.6–18.5) | 23.3 (20.7–26.0) | 17.3 (15.3–19.4) | 26.6 (23.6–29.7) | 15.8 (13.9–17.7) | 22.3 (19.8–25.0) |
| % Ruled out | 29.9 | 55.6 | 22.7 | 45.5 | 29.9 | 55.6 | 22.7 | 45.5 |
| False negatives | 4 | 10 | 2 | 3 | 3 | 9 | 1 | 2 |
| Synthetic validation cohort | ||||||||
| Sensitivity | 98.6 (98.5–98.7) | 96.5 (96.4–96.6) | 98.6 (98.5–98.6) | 98.1 (98.0–98.2) | 98.6 (98.5–98.7) | 96.5 (96.4–96.6) | 99.5 (99.5–99.6) | 98.8 (98.8–98.9) |
| NPV | 99.4 (99.4–99.5) | 99.2 (99.2–99.3) | 99.2 (99.2–99.2) | 99.5 (99.4–99.5) | 99.4 (99.4–99.5) | 99.2 (99.2–99.3) | 99.7 (99.7–99.8) | 99.7 (99.7–99.7) |
| Specificity | 33.9 (33.8–34.0) | 63.1 (63.0–63.3) | 26.0 (25.9–26.0) | 51.9 (51.8–52.0) | 33.9 (33.8–34.0) | 63.1 (63.0–63.3) | 25.8 (25.7–25.9) | 51.7 (51.6–51.8) |
| PPV | 17.3 (17.2–17.4) | 26.8 (26.7–27.0) | 16.4 (16.3–16.5) | 23.1 (23.0–23.2) | 17.3 (17.2–17.4) | 26.8 (26.7–27.0) | 15.8 (15.7–15.9) | 22.3 (22.2–22.4) |
| % Ruled out | 29.9 | 55.8 | 22.8 | 45.5 | 29.9 | 55.8 | 22.7 | 45.5 |
Diagnostic performance for early rule-out by selected single-sample algorithms.
MI, myocardial infarction; NPV, negative predictive value; NSTEMI, non-ST-elevation myocardial infarction; PPV, positive predictive value; TnI, troponin I; TnT, troponin T.
The results in the synthetic validation data set confirmed these findings. With the <3 ng/L cut-off, 22.7% of the total cohort could be ruled out, increasing to 45.5% with the <5 ng/L cut-off. Both cut-offs appeared to outperform the comparator algorithms when assessed for sensitivity and NPV, markedly so for the Abbott hs-cTnI assay. Specificity with the <5 ng/L cut-off was noticeably higher than the hs-cTnT assay but lower than the Abbott hs-cTnI assay (Table 2; Supplementary material online, Table S5).
The data for index NSTEMI showed only marginal differences from the primary endpoint (Table 2; Supplementary material online, Tables S6 and S7 and Figures S1–S3).
Estimated sensitivity thresholds
When drawing 500 independent random data sets of 1896 patients from the combined synthetic data set, the mean Siemens hs-cTnI threshold that achieved 99% (98.5–99.5) sensitivity for the primary endpoint was 3.5 ng/L (95% CI 1.2–5.8) and for the secondary endpoint 5.0 ng/L (95% CI 2.2–7.6). For 97% (96.5–97.5) sensitivity, the results were 5.9 (95% CI 5.0–8.2) and 7.8 ng/L (95% CI 5.4–10.0), for the primary and secondary endpoints, respectively (Supplementary material online, Figure S1).
Non-ST-elevation myocardial infarction in early presenters
To stay in line with the guidelines from the ECS, only patients with >3 h between symptoms onset and first blood draw are currently eligible for potential rule-out of NSTEMI with single-sample troponin testing.2 We, therefore, analysed our derived algorithms in the subgroup of patients with symptoms > 3 h alongside all comers. There were no marked differences in the performance of either a <3 or 5 ng/L cut-off between all comers and the >3-h subgroup. Indeed, NPV and sensitivity were slightly lower in the >3-h subgroup owing to fewer events. None of the patients falsely ruled out for an NSTEMI using a cut-off of <3 or 5 ng/L were early presenters. This performance was noticeably different from both comparator algorithms, particularly the Abbott hs-cTnI assay, which increased in NPV and sensitivity, 99.1% vs. 99.6% and 96.1% vs. 98.1%, respectively, after excluding early presenters. The same relationships held true in the validation data set (Table 3; Supplementary material online, Tables S8 and S9).
Early presenters
| Endpoint | Index NSTEMI | |||||||
|---|---|---|---|---|---|---|---|---|
| Presentation time | >3 hours from symptom start to blood draw | All comers | ||||||
| Algorithm | Roche TnT 0 h < 5 ng/L | Abbott TnI 0 h < 4 ng/L | Siemens TnI 0 h < 3 ng/L | Siemens TnI 0 h < 5 ng/L | Roche TnT 0 h < 5 ng/L | Abbott TnI 0 h < 4 ng/L | Siemens TnI 0 h < 3 ng/L | Siemens TnI 0 h < 5 ng/L |
| Derivation cohort | ||||||||
| Sensitivity | 98.8 (95.7–99.9) | 98.2 (94.999.6) | 99.4 (96.7–100) | 98.8 (95.7–99.9) | 98.7 (96.3–99.7) | 96.1 (92.8–98.2) | 99.6 (97.6–100) | 99.1 (96.9–99.9) |
| NPV | 99.5 (98.4–99.9) | 99.6 (98.9–99.9) | 99.7 (98.3–100) | 99.7 (98.9–100) | 99.5 (98.5–99.9) | 99.1 (98.4–99.6) | 99.8 (98.7–100) | 99.8 (99.2–100) |
| Specificity | 32.9 (30.4–35.5) | 62.4 (59.7–65.0) | 24.8 (22.4–27.2) | 50.9 (48.1–53.6) | 33.9 (31.6–36.2) | 62.9 (60.5–65.2) | 25.8 (23.7–27.9) | 51.8 (49.3–54.2) |
| PPV | 15.7 (13.6–18.0) | 25.0 (21.7–28.4) | 14.3 (12.3–16.5) | 20.3 (17.6–23.2) | 17.3 (15.3–19.4) | 26.6 (23.6–29.7) | 15.8 (13.9–17.7) | 22.3 (19.8–25.0) |
| % Ruled out | 29.4 | 55.5 | 22.0 | 45.3 | 29.9 | 55.6 | 22.7 | 45.5 |
| False negatives | 2 | 3 | 1 | 2 | 3 | 9 | 1 | 2 |
| Synthetic validation cohort | ||||||||
| Sensitivity | 98.5 (98.4–98.5) | 98.3 (98.2–98.4) | 99.5 (99.4–99.5) | 98.1 (98.0–98.2) | 98.6 (98.5–98.7) | 96.5 (96.4–96.6) | 99.5 (99.5–99.6) | 98.8 (98.8–98.9) |
| NPV | 99.4 (99.4–99.5) | 99.7 (99.6–99.7) | 99.7 (99.7–99.8) | 99.5 (99.5–99.5) | 99.4 (99.4–99.5) | 99.2 (99.2–99.3) | 99.7 (99.7–99.8) | 99.7 (99.7–99.7) |
| Specificity | 33.4 (33.3–33.6) | 62.5 (62.4–62.6) | 24.7 (24.6–24.8) | 50.8 (50.7–50.9) | 33.9 (33.8–34.0) | 63.1 (63.0–63.3) | 25.8 (25.7–25.9) | 51.7 (51.6–51.8) |
| PPV | 15.8 (15.7–15.9) | 25.0 (24.8–25.1) | 14.4 (14.3–14.4) | 20.2 (20.1–20.3) | 17.3 (17.2–17.4) | 26.8 (26.7–27.0) | 15.8 (15.7–15.9) | 22.3 (22.2–22.4) |
| % Ruled out | 29.8 | 55.7 | 22.0 | 45.3 | 29.9 | 55.8 | 22.7 | 45.5 |
Diagnostic performance for early rule-out of index NSTEMI by selected single-sample algorithms in either all comers or only patients with >3 h between symptom start and first blood draw.
NPV, negative predictive value; NSTEMI, non-ST-elevation myocardial infarction; PPV, positive predictive value; TnI, troponin I; TnT, troponin T.
Zero- to 1-h Δ rule-out algorithms
In the derivation cohort, the highest NPV for 30-day MI or death (99.9%) was achieved with a baseline hs-cTnI < 10 ng/L combined with a 1-h Δ < 3 ng/L. A baseline of <6 ng/L with Δ < 3 ng/L had identical sensitivity (99.3%), and similar NPV (99.8%), but lower specificity, 61.6% vs. 74.1%. In the synthetic validation cohort NPV for both algorithms dropped slightly to 99.5% and sensitivity dropped to 97.8% for a baseline concentration of <6 ng/L and 97.3% for <10 ng/L. Specificity remained nearly identical. The performance of the baseline < 10 ng/L algorithm was similar to the Abbott hs-cTnI algorithm, whereas the hs-cTnT algorithm had slightly better specificity, yet lower sensitivity. This was confirmed in the validation data set (Table 4; Supplementary material online, Tables S10 and S11).
Zero- to 1-h Δ rule-out
| Endpoint | 30-day MI or death | Index NSTEMI | ||||||
|---|---|---|---|---|---|---|---|---|
| Algorithm | Roche TnT 0 h < 12 ng/L + 1 h Δ < 3 ng/L | Abbott TnI 0 h < 5 ng/L + 1 h Δ < 2 ng/L | Siemens TnI 0 h < 6 ng/L + 1 h Δ < 3 ng/L | Siemens TnI 0 h < 10 ng/L + 1 h Δ < 3 ng/L | Roche TnT 0 h < 12 ng/L + 1 h Δ < 3 ng/L | Abbott TnI 0 h < 5 ng/L + 1 h Δ < 2 ng/L | Siemens TnI 0 h < 6 ng/L + 1 h Δ < 3 ng/L | Siemens TnI 0 h < 10 ng/L + 1 h Δ < 3 ng/L |
| Derivation cohort | ||||||||
| Sensitivity | 98.5 (94.7–99.8) | 99.2 (95.9–100) | 99.3 (95.9–100) | 99.3 (95.9–100) | 99.2 (95.7–100) | 100 (97.2–100) | 100 (97.2–100) | 100 (97.2–100) |
| NPV | 99.7 (99.0–100) | 99.9 (99.2–100) | 99.8 (99.1–100) | 99.9 (99.2–100) | 99.9 (99.2–100) | 100 (99.5–100) | 100 (99.4–100) | 100 (99.5–100) |
| Specificity | 75.4 (72.6–78.1) | 69.9 (66.9–72.8) | 61.6 (58.5–64.7) | 74.1 (71.3–76.8) | 75.1 (72.3–77.8) | 69.6 (66.6–72.5) | 58.3 (55.1–61.4) | 73.9 (71.0–76.6) |
| PPV | 35.3 (30.4–40.4) | 31.1 (26.8–35.8) | 26.1 (22.3–30.1) | 34.4 (29.6–39.3) | 34.2 (29.4–39.3) | 30.2 (25.9–34.8) | 23.8 (20.3–27.7) | 33.3 (28.7–38.3) |
| % Ruled out | 66.5 | 61.6 | 54.3 | 65.3 | 66.5 | 61.6 | 51.5 | 65.3 |
| False negatives | 2 | 1 | 1 | 1 | 1 | 0 | 0 | 0 |
| Synthetic validation cohort | ||||||||
| Sensitivity | 95.5 (95.3–95.7) | 97.6 (97.5–97.7) | 97.8 (97.7–97.9) | 97.3 (97.2–97.4) | 97.7 (97.6–97.9) | 99.7 (99.7–99.7) | 99.6 (99.6–99.7) | 99.5 (99.5–99.6) |
| NPV | 99.2 (99.2–99.2) | 99.5 (99.5–99.6) | 99.5 (99.5–99.5) | 99.5 (99.5–99.5) | 99.6 (99.6–99.6) | 99.9 (99.9–100) | 99.9 (99.9–99.9) | 99.9 (99.9–99.9) |
| Specificity | 75.7 (75.6–75.9) | 69.2 (69.0–69.3) | 60.8 (60.7–61.0) | 73.4 (73.3–73.5) | 75.7 (75.5–75.8) | 69.1 (68.9–69.2) | 60.8 (60.6–60.9) | 73.3 (73.2–73.5) |
| PPV | 34.6 (34.4–34.8) | 29.9 (29.7–30.1) | 25.2 (25.0–25.4) | 33.1 (32.8–33.3) | 34.1 (33.8–34.3) | 29.4 (29.2–29.6) | 24.7 (24.5–24.8) | 32.5 (32.3–32.7) |
| % Ruled out | 67.3 | 61.2 | 50.5 | 65.0 | 67.3 | 61.2 | 53.9 | 65.0 |
Diagnostic performance for early rule-out by selected 0- to 1-h Δ algorithms.
NPV, negative predictive value; NSTEMI, non-ST-elevation myocardial infarction; PPV, positive predictive value; TnI, troponin I; TnT, troponin T.
Considering index NSTEMI, the proposed algorithms had a sensitivity and NPV of 100% in the derivation cohort. Identical sensitivity was found for the Abbott hs-cTnI algorithm, together with a specificity intermediary between the Siemens cTnI algorithms using baseline cut-offs < 6 or <10 ng/L. The hs-cTnT algorithm again had slightly lower sensitivity and slightly higher specificity than the <10 ng/L Siemens hs-cTnI algorithm. Negative predictive value at 99.9% for both algorithms was maintained in the validation data set, with relationships between the algorithms similar to the derivation cohort (Table 4; Supplementary material online, Tables S12 and S13).
Rule-in algorithms
In the derivation cohort, applying either a baseline hs-TnI concentration ≥ 120 ng/L or a 0- to 1-h Δ ≥ 12 ng/L for rule-in of the 30-day MI or death endpoint achieved PPV > 74.4% with specificity > 96.2%. Results were comparable with, albeit marginally less specific than, the algorithms for hs-cTnT and Abbott hs-cTnI (Table 5; Supplementary material online, Tables S14 and S18). This was confirmed in the validation data set, although the 0- to 1-h Δ ≥ 12 ng/L algorithm dropped in PPV to 72.7%, yet increased slightly to 74.9% for the baseline ≥ 120 ng/L algorithm (see Supplementary material online, Tables S15 and S19).
Rule-in
| Endpoint | 30-day MI or death | Index NSTEMI | ||||||||||
|---|---|---|---|---|---|---|---|---|---|---|---|---|
| Algorithm | Roche TnT 0 h ≥ 52 ng/L | Roche TnT 1 h Δ ≥ 5 ng/L | Abbott TnI 0 h ≥ 64 ng/L | Abbott TnI 1 h Δ ≥ 6 ng/L | Siemens TnI 0 h ≥ 120 ng/L | Siemens TnI 1 h Δ ≥ 12 ng/L | Roche TnT 0 h ≥ 52 ng/L | Roche TnT 1 h Δ ≥ 5 ng/L | Abbott TnI 0 h ≥ 64 ng/L | Abbott TnI 1 h Δ ≥ 6 ng/L | Siemens TnI 0 h ≥ 120 ng/L | Siemens TnI 1 h Δ ≥ 12 ng/L |
| Derivation cohort | ||||||||||||
| Specificity | 98.0 (97.2–98.6) | 97.5 (96.4–98.4) | 97.5 (96.6–98.2) | 96.5 (95.1–97.6) | 97.3 (96.4–98.1) | 96.2 (94.8–97.3) | 97.8 (97.0–98.5) | 97.5 (96.3–98.3) | 97.4 (96.5–98.1) | 96.4 (95.0–97.5) | 97.2 (96.3–98.0) | 96.0 (94.6–97.2) |
| PPV | 77.6 (69.9–84.0) | 79.1 (70.6–86.1) | 77.1 (70.2–83.0) | 76.9 (69.2–83.4) | 74.4 (67.2–80.8) | 74.5 (66.6–81.4) | 75.5 (67.7–82.2) | 78.3 (69.6–85.4) | 76.0 (69.0–82.0) | 76.2 (68.5–82.8) | 73.3 (66.0–79.7) | 73.1 (65.1–80.1) |
| % Ruled in | 7.8 | 10.4 | 9.5 | 13.3 | 9.1 | 13.0 | 7.8 | 10.4 | 9.5 | 13.3 | 9.1 | 13.0 |
| False positives | 33 | 24 | 41 | 34 | 44 | 37 | 36 | 25 | 43 | 35 | 46 | 39 |
| Synthetic validation cohort | ||||||||||||
| Specificity | 97.6 (97.5–97.6) | 97.1 (97.1–97.1) | 97.4 (97.4–97.4) | 96.4 (96.4–96.5) | 97.3 (97.3–97.4) | 95.9 (95.9–96.0) | 97.6 (97.5–97.6) | 97.0 (97.0–97.1) | 97.4 (97.4–97.4) | 96.3 (96.3–96.4) | 97.3 (97.3–97.4) | 95.9 (95.8–95.9) |
| PPV | 73.2 (72.9–73.5) | 75.3 (74.9–75.6) | 76.5 (76.2–76.7) | 76.2 (75.9–76.5) | 74.9 (74.6–75.2) | 72.7 (72.4–73.0) | 73.2 (72.9–73.5) | 74.6 (74.2–74.9) | 76.5 (76.2–76.7) | 75.5 (75.2–75.8) | 74.9 (74.6–75.2) | 72.0 (71.7–72.3) |
| % Ruled in | 8.0 | 10.3 | 9.6 | 13.2 | 9.3 | 13.1 | 8.0 | 10.3 | 9.6 | 13.2 | 9.3 | 13.1 |
Diagnostic performance for early rule-in by selected single-sample and 0- to 1-h Δ algorithms.
NPV, negative predictive value; NSTEMI, non-ST-elevation myocardial infarction; PPV, positive predictive value; TnI, troponin I; TnT, troponin T.
For NSTEMI at index, the results were close to identical with the primary endpoint (Table 5; Supplementary material online, Tables S16, S17, S20, and S21).
Discussion
This paper presents algorithms for the Siemens Atellica IM hs-cTnI assay utilized for prediction of 30-day MI or death for patients presenting with chest pain in the ED, alongside rapid rule-in and rule-out of NSTEMI in the ED. The data were derived using a clinical cohort and validated using a synthetically generated data set. Our results raise several points of interest.
Choice of sensitivity threshold
Within the biochemical, cardiologic, and biostatistical communities, there are different opinions regarding the optimal clinical sensitivity of high-sensitivity cardia troponin assays. Whereas a 99% sensitivity ideal has been touted based on the view of some clinicians,22 the expert opinion of the British National Institute for Health and Care Excellence recommends a lower limit of 97% sensitivity.5 Others have suggested a statistically derived threshold of 98% sensitivity.23 While the highest possible sensitivity might be ideal, this often involves a significant lowering of specificity and does not necessarily represent the most economical or safe threshold. We have chosen 97% sensitivity as the lowest acceptable safety threshold, although aiming for the optimal balance of sensitivity, specificity, and NPV.
Proposed Siemens IM Atellica high-sensitivity cardiac troponin I algorithms
The assay tested in our paper has been the subject of several prior studies, although with some uncertainty regarding the most optimal cut-off levels, particularly for a single-sample cut-off for predicting low risk of MI or death (single-sample rule-out).10–13 The original rule-out algorithms for the similar, but distinct, Siemens Centaur assay were published by Boeddinghaus et al.24 and validated by Chapman et al., Nowak et al., and Sörensen et al.10,11,13 The rationale for choosing a very low 0-h cut-off level (<3 ng/L) is not entirely clear. Chapman et al., Sandoval et al., and Sörensen et al.10,12,13 also suggested a single-sample rule-out cut-off < 5 ng/L, although the excellent NPV results and significantly larger specificity and rule-out rate compared with <3 ng/L have achieved less notice. Neither Nowak et al.11 nor Boeddinghaus et al.24 have published data for the <5 ng/L cut-off (see Supplementary material online, Table S22).
Even though some heterogeneity exists in the methodology of prior studies, several results are comparable. Boeddinghaus et al.24 achieved NPV 99.7%, sensitivity 99.1–99.2%, and rule-out rate > 45% for index NSTEMI with a combined algorithm of either 0 h < 3 ng/L or 0 h < 6 ng/L with 0- to 1-h Δ < 3 ng/L, while the results for the single-sample rule-out alone were not presented. Using <3 ng/L as the cut-off for predicting NSTEMI, we achieved virtually identical NPV (99.7–99.8%) and sensitivity (99.5–99.6%), with 22.7% rule-out rate. Sörensen et al.,13 who did present individual results for both single-sample and 0- to 1-h algorithms, achieved NPV 99.4–100.0%, sensitivity 98.9–100.0%, and rule-out rate 29.3–29.5% for index NSTEMI with the <3 ng/L cut-off, very similar to our results. Sörensen et al. tested the single-sample cut-off < 5 ng/L and found NPV 99.6%, sensitivity 97.7%, and rule-out rate 43.9% with this algorithm. Our results for the same cut-offs and endpoint achieved a similar NVP 99.7–99.8%, sensitivity 98.8–99.1%, and rule-out 45.5%.
In our paper, we tested both the <3 and <5 ng/L single-sample cut-offs, concluding that the <5 ng/L appear to have the optimal balance between sensitivity and specificity, presenting the possibility of safe and rapid discharge of a large number of low-risk patients. Sensitivity for MI or death was slightly lower than <3 ng/L, although still well above the safety criteria of >97%.5 Negative predictive value was identical for the two cut-offs, while specificity and proportion of patients eligible for immediate rule-out were twice as large with the <5 ng/L cut-off compared with <3 ng/L (Table 2). The <5 ng/L cut-off appeared more specific than the hs-cTnT assay, and more sensitive than the Abbott hs-cTnI assay, at their respective established cut-offs. However, this finding should be interpreted with care as prespecified cut-offs may be less fitted with the current data.
For a 0- to 1-h Δ rule-in algorithm the consensus from prior studies is clearer. A baseline of < 6 ng/L with a 0–1 Δ < 3 ng/L has been tested in several studies.10,11,13 Our analysis indicates that the Δ concentration is the most significant driver of high sensitivity. Although we replicated very high sensitivity and NPV with the <6 ng/L and 0- to 1-h Δ < 3 ng/L algorithm, we found equally good sensitivity and significantly increased specificity with a higher baseline (<10 ng/L) and identical 0- to 1-h Δ (Table 4). Sörensen et al. is the only study that evaluated the 0- to 1-h algorithms with baseline cut-offs higher than <6 ng/L. They demonstrate findings similar to us but did not propose a novel 0- to 1-h algorithm based on those data.13 The algorithm using <6 ng/L as baseline cut-off was outperformed in specificity by the hs-cTnT and Abbott hs-cTnI algorithms in our data, unlike the <10 ng/L baseline algorithm, which had more similar performance to the comparator algorithms. The optimal 0- to 1-h algorithm from our material would appear to be the combination of baseline < 10 ng/L and 0- to 1-h Δ < 3 ng/L. While the Δ appears to have full support in all prior studies, it is not possible to compare our proposed baseline cut-off to other studies. The most prudent suggestion is therefore to support the extant proposition of baseline < 6 ng/L, until other study groups have further evaluated the <10 ng/L cut-off.
For rule-in algorithms, both single-sample and 0- to 1-h Δ, our results are very much in line with prior studies. The single-sample rule-in concentration of ≥120 ng/L or 0- to 1-h Δ ≥ 12 ng/L now appears to be robustly and repeatedly validated and should be universally applied.
Early presenters
A very interesting result from our analysis challenges the universality of the ESC proposition that suggests only patients with symptoms lasting >3 h can be eligible for single-sample rule-out.2 Although measurable troponin concentrations do not increase immediately after myocardial injury, prior studies have demonstrated assay-dependent differences in the time to reach measurable cardiac troponin concentration after an event. In an experimental study with iatrogenic balloon occlusion of the left anterior descendent coronary artery, Siemens Atellica IM was the earliest assay to detect troponin release and peaked prior to other assays.25 The same pattern was apparent in a study measuring troponin release after catheter ablation for arrhythmia.26 In our material, there were no real differences in sensitivity and NPV for the Siemens assay regardless of whether the patients had symptoms lasting more or less than 3 h. This was in noticeable contrast to the comparator assays, which had clear improvement of sensitivity in patients with symptoms lasting >3 h. If the single-sample rule-out for the Siemens IM Atellica assay could be extended to include, e.g. patients with >2 h of symptoms rather than >3 h of symptoms, the number of patients not eligible for admission sample evaluation would be more than halved, from 21.4% to 9.7%, and hence be more time-effective. This would be in line with the suggestion from the High-STEACS pathway developed and utilized in the UK.27 The number of early presenters (n = 406) and number of index NSTEMI (n = 65) in the early presenter subgroup, however, are likely not large enough for robust statistical propositions but offer relevant venues for further research in this population.
Synthetic validation as a solution to the small number problem
In our study, we demonstrate the apparent utility of synthetic data generation and add to the emerging evidence that this method can represent a cost-effective method for the validation of cardiac biomarkers.8 In real-life settings, one or two outlying patients can have significant effects when aiming for very high sensitivity and NVP benchmarks. Generating synthetic data sets of very large size, derived and extrapolated from a real-life data set with numerous predictive variables, offers the ability to reduce the significance of outliers. In our case, the combined population of 500 synthetic data sets approach 1 million observations, a wholly improbable number in any real-life biobank study. Outliers that are statistically improbable (i.e. a very low troponin value in a patient who otherwise has variables very consistent with NSTE-ACS) would be less likely to be reproduced with this method.8 This is in contrast to classical bootstrapping that simply replicates extant data, including troponin levels, while the method used through the Synthpop package generates new and probable troponin levels. This can be readily observed in the smoothening out of the curves for cumulative troponin concentrations when the real-life and synthetic data sets are compared (Figure 3). For both our primary and secondary endpoints, we found very good correlation between the real observed data and the synthetically generated data without any signal indicating meaningful differences between the two data sets.
Finally, it should be noted that this method of synthetic data generation, along with its use for validation, is novel, and as of yet, experimental. However, the statistical principles supporting the use of classification and regression trees for generating synthetic data, including continuous variables, have been explored previously.8,9,28,29 The method appears promising and could offer significant cost-saving effects while avoiding the weakening of statistical power inherent in traditional splitting of observational cohorts.6 Further studies extending on this method and examining the reliability of synthetically generated data in general could have a very large impact on the entire field of medical biomarkers and particularly hs-cTn.
Strengths and limitations of the study
Our study includes a large real-life data set measured with three different hs-cTn assays. Using the entire data set for derivation of novel algorithms further strengthens the statistical validity of the derived results. The study had wide inclusion criteria mimicking real-life experience from the ED. The prevalence of events and diagnostic classification appears broadly similar to other studies. Accordingly, our results, in context with already published studies, make the scientific data behind the Siemens Atellica IM hs-cTnI assay increasingly solid.
Originally, the study was designed to include a larger data set. The inclusion was terminated prematurely at the outbreak of the Covid-19 pandemic in Norway (March 2020). Due to logistical challenges in the rapid and stressful environment of our EDs, we could not achieve complete consecutive inclusion or 1-h samples in all patients. This could potentially lead to bias of e.g. patients admitted at certain times of the day. However, the implementation of the 1-h sample at a later stage of the study was preplanned and it is unlikely that this affected the results.14 Also, the cut-offs derived were optimal for our cohort. However, the rather similar results in our study when compared with prior studies make overfitting or systematic, unconscious, inclusion bias less likely. Another limitation is that most patients were ethnically Caucasian, meaning the data could potentially be less generalizable to other ethnic groups. Also, the subgroup is not large enough for independent suggestions for change in clinical practice for this population. Potential replication of our findings could offer clinical and economic benefits.
Finally, the application of a novel method for synthetic validation is a potential weakness of the study, as any systematic bias embedded in our data set may not be identified nor corrected by this validation method. This method does not obviate the need for, and scientific value of, independent and repeated validation of proposed novel algorithms. However, the use of two inclusion sites in this study and the similarity with external and comparative data from studies performed in Europe and America supports our current findings.10,12,13
Conclusions
Our study presents rule-out and rule-in algorithms for early prediction of 30-day MI or death, as well as index NSTEMI, using the Siemens Atellica hs-cTnI assay. We demonstrate prognostic safety, accuracy, and efficacy at least comparable with established hs-cTn algorithms for hs-cTnT (Roche), hs-cTnI (Abbott), and hs-cTnI (Siemens).
Supplementary material
Supplementary material is available at European Heart Journal: Acute Cardiovascular Care online.
Funding
The study was financed by a grant from Helse Vest (The Western Norway Regional Health Authority) (grant number: 912265). I.Z.R. has a PhD grant from Helse Vest (The Western Norway Regional Health Authority) (ID: F-12501). The reagent costs for Siemens hs-cTnI were covered by Siemens Healthineers.
Data availability
The data underlying this article cannot be shared publicly due to the risk of violating patient privacy, as regulated by national and institutional data protection agencies.
References
Author notes
Conflict of interest: K.M.A. has served on an advisory board for Roche Diagnostics, Siemens Healthineers, and SpinChip and received consultant honoraria from CardiNor, lecturing honorarium from Siemens Healthineers, Mindray, and Snibe Diagnostics, and research grants from Siemens Healthineers and Roche Diagnostics. K.M.A. is an associate editor of Clinical Biochemistry and Chair of the IFCC Committee of Clinical Application of Cardiac Biomarkers. J.W.P. has undertaken statistical consultancy for Siemens Healthineers, Radiometer, QuidelOrtho, Abbott Point of Care, Roche, and Upstream Medical Technologies. T.O. has received research support from Abbott Laboratories, ChromaDex, Novartis, and Roche Diagnostics via Akershus University Hospital and consultant or speaker honoraria from Abbott Laboratories Diagnostics, Bayer Healthcare, CardiNor, and Roche Diagnostics. T.O. is a board member and owns stock in CardiNor and is on a patent (Roche, patent application numbers EP21740587 and EP20186620). Ø.S. has received lecture fees from Abbott Diagnostics. Ø.R.M. has received payment from Pfizer in relation to work as facilitator at a POCUS course (emergency medicine). There are at present no known other possible conflicts of interest.

Comments