


Abstract
Pulmonary hypertension (PH) management is dependent on cardiac output (CO) assessment. The gold standard Fick method for CO and cardiac index (CI) measurement is not widely available. An accessible and reliable method for CO/CI estimation is needed not only in catheterization labs but also in other environments such as the intensive care unit, where pulmonary artery catheters are less likely to be used. We hypothesized that veno-arterial carbon dioxide gradient (PvaCO2) is a reliable surrogate for Fick CI in patients with PH.
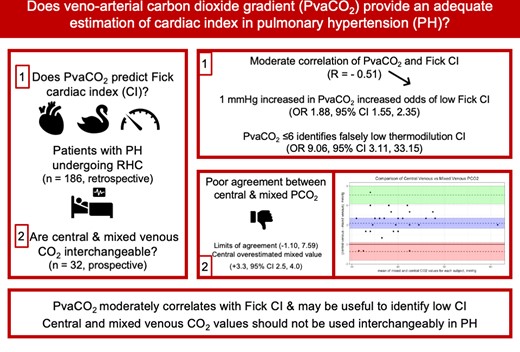
A single-centre retrospective analysis of patients with PH who underwent direct Fick CI (DFCI) measurement during right heart catheterization. The primary outcome was correlation between PvaCO2 and DFCI. To assess the agreement between central and mixed venous CO2 values, a separate prospective cohort of patients was analysed. Data from 186 patients with all haemodynamic types of PH were analysed. PvaCO2 moderately correlated with Fick CI, R = −0.51 [95% confidence interval (CI): −0.61, −0.39]. A higher PvaCO2 was associated with an increased risk of CI < 2.5 L/min/m2 (odds ratio: 1.88, 95% CI: 1.55, 2.35). Low thermodilution CI with normal veno-arterial carbon dioxide gradient values was associated with a thermodilution underestimation of Fick CI. In the prospective analysis of 32 patients, central venous CO2 overestimated mixed venous values (mean difference 3.3, 95% CI: 2.5, 4.0) and there was poor agreement overall (limits of agreement −1.10, 7.59).
Veno-arterial carbon dioxide gradient moderately correlates with Fick CI and may be useful to identify patients with low CI. Central and mixed venous CO2 values should not be used interchangeably in PH.
Introduction
Despite advances in therapy, the median time from diagnosis of pulmonary arterial (PA) hypertension to death is ∼7 years.1 In the last few years, efforts have been made to diagnose the disease at an earlier stage with a revised definition of pulmonary hypertension (PH) using a lower mean PA pressure and pulmonary vascular resistance (PVR).2 Even though cardiac index (CI) heavily influences risk stratification and management of PH, the gold standard approach to measure CI, the direct Fick method, is rarely followed due to the need for specialized equipment and expertise. Recent studies have shown that there is poor precision and accuracy between the measurement of CI using thermodilution and indirect Fick compared with direct Fick.3,4
More accurate methods for cardiac output (CO) estimation are also needed outside of the catheterization laboratory. Cardiac output monitoring in patients with PH admitted to the intensive care unit (ICU) is a cornerstone of care, and hospital mortality is high in PH patients requiring ICU care, ranging from 22 to 48%.5–7 Fick methodology is virtually unavailable in this setting. As a result, mixed venous oxygen saturation and/or central venous oxygen saturation are often used as a surrogate for CO in ICU settings. However, there are many physiologic alterations that may render this value unreliable, such as impaired oxygen utilization by tissues and microvascular shunting, amongst a number of other causes.8
Veno-arterial carbon dioxide gradient (PvaCO2), defined as the difference between mixed (or central) venous carbon dioxide minus arterial carbon dioxide, is a possible alternative surrogate. Regardless of the metabolism source, carbon dioxide is produced. The rate of its removal from tissues serves as a marker of CO. PvaCO2 provides an estimate of the adequacy of CO, with a normal value of 6 mm of mercury (mmHg) or less. PvaCO2 correlates inversely with CO and has been shown to do so reliably in critically ill patients.9–12 However, PvaCO2 has not been validated in patients with PH, nor has it been compared with the Fick method. If it can model CO well, it could obviate the need for more advanced measurements required for direct Fick CI (DFCI). We, therefore, hypothesized that PvaCO2 will adequately model CO measured using the direct Fick method. Secondarily, we sought to demonstrate that central venous CO2 would be an adequate substitute for mixed venous CO2, since the former value is more commonly available given the infrequent use of PA catheters in hospitalized patients.
Methods
Study design, setting, and participants
We performed a single-centre, retrospective study in patients with all haemodynamic types of PH (pre-capillary, post-capillary, and mixed type) who underwent right heart catheterization in order to characterize or monitor their PH from April 2013 through July 2021. Pulmonary hypertension was defined by a mean PA pressure of ≥20 mmHg. Patients were classified as pre-capillary PH if PVR was ≥3 wood units (WUs) with PA wedge pressure (PAWP) ≤ 15 mmHg. Post-capillary PH was defined as PAWP > 15 mmHg with PVR < 3 WU. Combined pre- and post-capillary PH was defined by PAWP > 15 mmHg with PVR ≥ 3 WUs. The 2015 guidelines were used for this analysis, given these were the standards in effect when these patients underwent evaluation.13 This work was approved by the Cleveland Clinic Institutional Review Board (#21-1141 and #06-245). Patients were included if they also underwent DFCI measurement, which was most often performed to verify low or borderline CI measurements by thermodilution CI, usually <2.5 L/min/m2. Indirect Fick CI (IFCI) was also calculated on all patients. Patients were excluded if they had missing information necessary to calculate PvaCO2 (defined as the difference between the mixed venous partial pressure of carbon dioxide and arterial partial pressure of carbon dioxide, PaCO2, from a peripheral arterial draw), or DFCI was missing from the right heart catheterization report.
Data measurement and technical aspects
Patients had fasted for at least 4 h and underwent right heart catheterization in the outpatient setting by a single operator (A.R.T.) using only local anaesthesia. At the time of right-sided heart catheterization, breath-by-breath oxygen uptake was measured with the CCM express indirect calorimeter (MGC Diagnostic Corporation, St Paul, MN, USA) and averaged over the course of 12–15 min. Direct Fick CI was calculated using the following formula: VO2 in millilitres per minute/(arteriovenous oxygen content difference × 10)/body surface area in metres squared. Thermodilution CI was obtained by averaging at least three estimates with <15% variation. Peripheral arterial blood gasses were drawn from either the radial or brachial artery and were obtained within 15 min of the mixed venous blood gas draw. All measurements were obtained in the supine position. Data were abstracted from the electronic medical record by the study team.
Outcomes
The primary outcome of this study was the correlation of PvaCO2 with DFCI. Secondary outcomes included ability of PvaCO2 to predict inadequate CI, described as <2.5 mL/min/m2. This cut-off was chosen based on the European Society of Cardiology and European Respiratory Society risk group allocation.2 We also analysed the correlation of PvaCO2 across each of the three PH haemodynamic subgroups. Next, we assessed the additive value of PvaCO2 when thermodilution CI has been obtained. The purpose of this analysis was to determine whether PvaCO2 provides useful diagnostic information when combined with thermodilution CI. This would be particularly useful in cases when thermodilution CI is over- or underestimating DFCI near risk stratification cut-off values. Finally, to evaluate if results would be generalizable to patients with central venous catheters only, near-simultaneously obtained venous blood gasses from the central venous port and the PA catheter tip were prospectively obtained to assess agreement between central and mixed PaCO2. This analysis included patients with pre-capillary PH only. Finally, because of the updated PVR cut-off in the 2022 guidelines, a sensitivity analysis of the primary outcome was performed using the new value.2
Potential confounders
We considered factors that may impair pulmonary gas exchange as potential confounders. Specifically, we analysed baseline PaCO2, per cent predicted forced expiratory volume in one second, forced vital capacity, smoking status, and whether the patient was diagnosed with chronic obstructive pulmonary disease. We also considered extremes of arterial pH as a confounder as it may shift the haemoglobin–carbon dioxide dissociation curve. All these confounders were tested in by stratification as detailed in the Statistical analysis section.
Statistical analysis
Continuous variables are presented as median [interquartile range (IQR)] and categorical variables are presented as counts (percentages). Continuous variables were compared across the three PH haemodynamic groups by the Kruskal–Wallis rank-sum test. Categorical variables were compared across the groups by Pearson’s χ2 test.
The primary outcome was assessed by Spearman correlation with bootstrap confidence intervals (CIs) using 1000 samples. Univariable linear regression was also performed. Exploratory data analysis revealed significant right skew in DFCI. As a result, a natural log transformation of DFCI was performed prior to regression analysis. Bootstrap validation of the linear regression model was performed using 100 resamples of the data set.
A logistic regression model was fit using PvaCO2 to predict inadequate direct Fick CI, defined as CI <2.5 mL/min/m2. Bootstrap validation of the logistic regression model was performed using 100 resamples of the data set. Optimal cut-off for PvaCO2 was assessed by Youden’s index. Alternative cut points to maximize both positive predictive value (PPV) and negative predictive value (NPV) were also assessed. A subgroup analysis of patients based on ‘concordant’ or ‘discordant’ thermodilution CI and PvaCO2 was carried out in a similar fashion to those above. Concordant was defined by both variables giving the same information (i.e. either thermodilution CI < 2.5 mL/min/m2 and PvaCO2 > 6 mmHg or thermodilution CI ≥ 2.5 mL/min/m2 and PvaCO2 ≤ 6 mmHg). Discordant was defined as variables pointing in the opposite direction, one indicating normal CI and the other suggesting low CI, i.e. thermodilution CI < 2.5 mL/min/m2 and PvaCO2 ≤ 6 mmHg or thermodilution CI ≥ 2.5 mL/min/m2 and PvaCO2 > 6 mmHg.
Stratified analyses were carried out to assess the role of potential confounders on the correlation of PvaCO2 with DFCI. Full analytic details and results can be seen in the Supplementary Material. Finally, an agreement between central and mixed PaCO2 was assessed using the Bland–Altman analyses. All analyses were performed using R software version 4.2.1, R Core Team.14
Results
Participants
From April 2013 through July 2021, 1434 patients underwent right heart catheterization by the primary operator. Direct Fick CI was measured in 219 patients with PH. Of those, 33 patients were excluded due to missing DFCI measurement in the procedure note or missing peripheral arterial blood gasses (one patient missing both values). Based on the absence of a discernible pattern to missing data, we considered these data to be missing at random. Data on 186 patients were available for analysis.
Descriptive data
The study population included 101 (54.3%) patients with pre-capillary PH, 26 (14.0%) with post-capillary PH, and 59 (31.7%) with mixed pre-/post-capillary PH. Patients in the pre-capillary PH group were younger with lower body mass index (BMI) and were more likely to be receiving PH-specific therapies compared with the other haemodynamic types. The mixed type tended to have worse pulmonary function test results, on average (see Table 1 for other baseline characteristics). Haemodynamic variables obtained during right heart catheterization are reported in Table 2. Median values for mean PA pressure, PAWP, and PVR are as expected for each haemodynamic type. Median DFCI for the cohort was 2.11 mL/min/m2 (IQR: 1.78, 2.67), with a median PvaCO2 6 mmHg (IQR: 5, 8).
Baseline characteristics
| Characteristic | Overall, N = 186a | Pre-capillary PH, N = 101a | Post-capillary PH, N = 26a | Pre- and post-capillary PH, N = 59a |
|---|---|---|---|---|
| Age | 62 (49, 72) | 56 (40, 70) | 63 (46, 70) | 69 (62, 73) |
| Sex | ||||
| ȃFemale | 109 (59%) | 63 (62%) | 12 (46%) | 34 (58%) |
| Race | ||||
| ȃWhite | 140 (75%) | 73 (72%) | 22 (85%) | 45 (76%) |
| ȃAfrican American | 30 (16%) | 17 (17%) | 1 (3.8%) | 12 (20%) |
| ȃHispanic | 2 (1.1%) | 2 (2.0%) | 0 (0%) | 0 (0%) |
| ȃAAPI | 5 (2.7%) | 2 (2.0%) | 2 (7.7%) | 1 (1.7%) |
| ȃNative American | 2 (1.1%) | 2 (2.0%) | 0 (0%) | 0 (0%) |
| ȃOther | 7 (3.8%) | 5 (5.0%) | 1 (3.8%) | 1 (1.7%) |
| BMI | 29 (25, 36) | 27 (23, 33) | 35 (29, 38) | 30 (27, 38) |
| PH-specific therapies | ||||
| ȃPDE5 inhibitor | 70 (38%) | 48 (48%) | 1 (3.8%) | 21 (36%) |
| ȃEndothelin receptor antagonist | 51 (27%) | 38 (38%) | 0 (0%) | 13 (22%) |
| ȃProstacyclin analogues/agonists | ||||
| ȃȃIV epoprostenol | 4 (2.2%) | 4 (4.0%) | 0 (0%) | 0 (0%) |
| ȃȃIV/SQ treprostinil | 23 (12%) | 19 (19%) | 0 (0%) | 4 (6.8%) |
| ȃȃInhaled treprostinil | 12 (6.5%) | 7 (6.9%) | 0 (0%) | 5 (8.5%) |
| ȃȃSelexipag | 4 (2.2%) | 3 (3.0%) | 0 (0%) | 1 (1.7%) |
| Comorbidities | ||||
| ȃCOPD | 46 (25%) | 19 (19%) | 4 (15%) | 23 (39%) |
| ȃDiabetes | 49 (26%) | 23 (23%) | 5 (19%) | 21 (36%) |
| ȃMalignancy | 11 (5.9%) | 5 (5.0%) | 3 (12%) | 3 (5.1%) |
| ȃCirrhosis | 16 (8.6%) | 9 (8.9%) | 2 (7.7%) | 5 (8.5%) |
| ȃCKD | 44 (24%) | 14 (14%) | 4 (15%) | 26 (44%) |
| ȃESRD | 5 (2.7%) | 3 (3.0%) | 0 (0%) | 2 (3.4%) |
| ȃOHS | 2 (1.1%) | 2 (2.0%) | 0 (0%) | 0 (0%) |
| ȃOSA | 68 (37%) | 28 (28%) | 11 (42%) | 29 (49%) |
| Smoking | ||||
| ȃCurrent | 11 (5.9%) | 7 (6.9%) | 2 (7.7%) | 2 (3.4%) |
| ȃFormer | 89 (48%) | 43 (43%) | 9 (35%) | 37 (63%) |
| ȃNever | 86 (46%) | 51 (50%) | 15 (58%) | 20 (34%) |
| Pulmonary function testing | ||||
| ȃFEV1% predicted | 76 (59, 86) | 77 (60, 87) | 80 (71, 97) | 68 (55, 82) |
| ȃFVC | 2.76 (2.16, 3.49) | 2.78 (2.23, 3.66) | 3.19 (2.53, 3.82) | 2.40 (1.92, 3.12) |
| ȃFEV/FVC | 77 (71, 86) | 80 (74, 92) | 77 (72, 84) | 72 (63, 76) |
PH, pulmonary hypertension; AAPI, Asians and Pacific Islanders; BMI, body mass index; PDE5, phosphodiesterase Type 5; IV, intravenous; SQ, subcutaneous; COPD, chronic obstructive pulmonary disease; CKD, chronic kidney disease; ESRD, end-stage renal disease; OHS, obesity hypoventilation syndrome; OSA, obstructive sleep apnoea; FEV1, forced expiratory volume in one second; FVC, forced vital capacity.
Median (IQR); n (%).
Haemodynamic measurements by pulmonary hypertension type
| Characteristic | Overall, N = 186a | Pre-capillary PH, N = 101a | Post-capillary PH, N = 26a | Pre-and post-capillary PH, N = 59a | P-valueb |
|---|---|---|---|---|---|
| Mean arterial pressure, mmHg | 96 (84, 106) | 91 (82, 101) | 100 (91, 107) | 101 (90, 112) | <0.001 |
| Heart rate, beats/min | 73 (64, 85) | 79 (68, 87) | 64 (60, 71) | 70 (63, 82) | <0.001 |
| Right atrial pressure, mmHg | 12 (9, 17) | 10 (7, 16) | 12 (11, 16) | 15 (12, 24) | <0.001 |
| Mean PA pressure, mmHg | 46 (35, 54) | 48 (39, 57) | 27 (25, 34) | 49 (43, 56) | <0.001 |
| PA wedge pressure, mid A wave, end-expiratory, mmHg | 16 (12, 20) | 12 (10, 15) | 18 (18, 23) | 22 (18, 25) | <0.001 |
| Thermodilution CI, L/min/m2 | 1.95 (1.71, 2.41) | 1.92 (1.69, 2.34) | 2.65 (2.10, 3.13) | 1.86 (1.70, 2.03) | <0.001 |
| Indirect Fick CI, L/min/m2 | 2.18 (1.89, 2.64) | 2.14 (1.85, 2.63) | 2.68 (2.17, 3.14) | 2.15 (1.94, 2.47) | 0.037 |
| Direct Fick CI, L/min/m2 | 2.11 (1.78, 2.67) | 2.11 (1.79, 2.65) | 2.95 (2.23, 3.47) | 1.99 (1.68, 2.27) | <0.001 |
| PVR, wood units | 7.4 (3.9, 10.8) | 9.6 (6.8, 12.7) | 1.7 (1.4, 2.1) | 6.6 (4.6, 8.5) | <0.001 |
| Mixed venous oxygen saturation, % | 63 (58, 69) | 63 (58, 69) | 69 (66, 72) | 61 (56, 66) | <0.001 |
| PvaCO2, mmHg | 6 (5, 8) | 7 (5, 8) | 5 (4, 6) | 7 (5, 9) | 0.014 |
PH, pulmonary hypertension; PA, pulmonary artery; CI, cardiac index; PVR, pulmonary vascular resistance.
Median (IQR).
Kruskal–Wallis rank-sum test.
Main results
PvaCO2 was moderately negatively correlated with DFCI, with R = −0.51 (95% CI: −0.61, −0.39). The correlation was slightly stronger in the pre-capillary PH group, R = −0.55 (95% CI: −0.68, −0.40, P < 0.0001) and worse in the mixed and post-capillary groups (Figure 1). Linear regression performed using PvaCO2 to predict DFCI revealed that only 28.5% of the variability in the data can be explained by the model, corrected to 26.5% after bootstrap validation. As such, a formula for DFCI based on PvaCO2 is not reported. The strength of the correlation of PvaCO2 with thermodilution CI, IFCI, and mixed venous oxygen saturation was similar. A correlation was R = −0.45 (95% CI: −0.57, −0.31) for thermodilution CI, R = −0.53 (95% CI: −0.64, −0.42) for indirect Fick, and R = −0.44 (95% CI: −0.56, −0.31) for mixed venous oxygen saturation (Figure 2). For the breakdown of each method by haemodynamic PH type (see Supplementary material online, FiguresS1–S3).
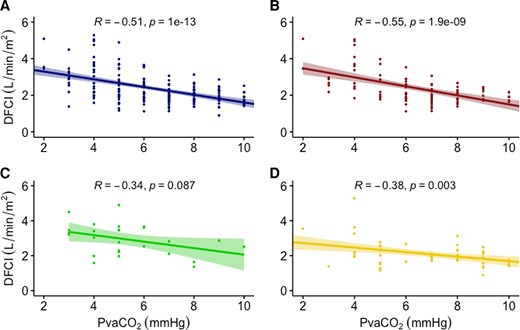
Correlation of PvaCO2 and direct Fick cardiac index by pulmonary hypertension type. A = full cohort, B = pre-capillary, C = post-capillary, D = mixed. DFCI, direct Fick cardiac index; PvaCO2, veno-arterial carbon dioxide gradient.
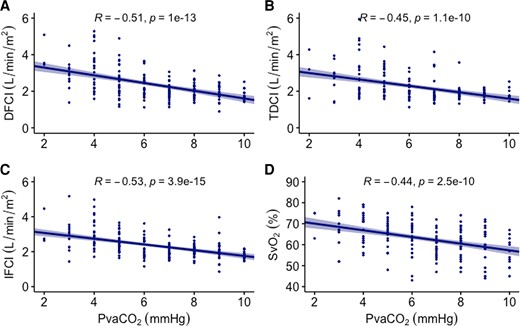
Correlation of PvaCO2 across different measures of cardiac index. A = direct Fick cardiac index (DFCI), B = thermodilution cardiac index (TDCI), C = indirect Fick cardiac index (IFCI), D = mixed venous oxygen saturation (SvO2) PvaCO2, veno-arterial carbon dioxide gradient.
Veno-arterial carbon dioxide gradient predicted DFCI of < 2.5 L/min/m2 with 75.8% accuracy (95% CI: 69.0%, 81.8%), sensitivity of 89.6%, and specificity of 47.5%. For each 1 mmHg increase in PvaCO2, the odds of DFCI < 2.5 increase by 1.88 (95% CI: 1.55, 2.35). Moving from a PvaCO2 of 5–8 mmHg (the 25th and 75th percentiles in this cohort, respectively) increased the odds of DFCI < 2.5 [odds ratio (OR): 6.66, 95% CI: 3.58, 11.39] (Table 3). Using the Youden index, the optimal cut-off to differentiate between DFCI above and below 2.5 L/min/m2 was 6 mmHg, with a C-statistic of 0.80. Additional analyses were performed to find cut-offs that maximized PPV and NPV, respectively. The best PPV was achieved at a PvaCO2 of > 8 mmHg (90.1% PPV), with the best NPV occurring at a PvaCO2 < 4 mmHg (87.5% NPV).
Summary of relationships between veno-arterial carbon dioxide gradient and normal or abnormal Fick cardiac index
| Parameter | Outcome | Odds ratio (95% conf. int) | Comments |
|---|---|---|---|
| PvaCO2, 1 mmHg increase | Direct Fick CI <2.5 L/min/m2 | 1.88 (1.55, 2.35) | Optimal cut-off > 6 mmHg |
| Best NPV < 4 mmHg (87.5%) | |||
| Best PPV > 8 mmHg (90.1%) | |||
| PvaCO2, increase from 25th to 75th percentile | Direct Fick CI <2.5 L/min/m2 | 6.66 (3.58, 11.39) | 25th percentile is PvaCO2 = 5 mmHg; 75th percentile = 8 mmHg |
| PvaCO2 ≤ 6 when thermodilution CI < 2.0 L/min/m2 | Direct Fick CI ≥2.5 L/min/m2 | 2.76 (1.20, 6.53) | |
| PvaCO2 ≤ 6 when thermodilution CI < 2.5 L/min/m2 | Direct Fick CI ≥2.5 L/min/m2 | 9.06 (3.11, 33.15) |
Conf. int, confidence interval; PvaCO2, veno-arterial carbon dioxide gradient; CI, cardiac index; NPV, negative predictive value; PPV, positive predictive value.
Analysis by thermodilution cardiac index
We also assessed the haemodynamic profile of patients stratified by thermodilution CI above/below 2.5 L/min/m2, and PvaCO2 above/below 6 mmHg, to create four groups as in Table 3. In subjects with concordant values (i.e. thermodilution CI and PvaCO2 both ‘normal’ or both ‘abnormal’ as defined in the Methods section), thermodilution CI more closely approximated DFCI [mean difference of 0.11 (95% CI: 0.04, 0.19) for low thermodilution CI group, mean difference 0.01 (95% CI: −0.24, 0.25) for the normal thermodilution CI group]. Patients with low thermodilution CI but normal PvaCO2 had underestimated CI compared with DFCI (mean difference 0.35, 95% CI: 0.21, 0.49). Patients with normal thermodilution CI but abnormal PvaCO2 had overestimated CI compared with DFCI (mean difference: −0.57, 95% CI: −1.27, 0.14), but this subgroup was very small (n = 6).
Further analysis of these groups demonstrated that a normal PvaCO2 ≤ 6 mmHg in a subject with thermodilution CI < 2.5 L/min/m2 (i.e. discordant values) increased the chances of having a normal DFCI (OR: 9.06, 95% CI: 3.11, 33.15), Table 4. Considering all cases, a concordant thermodilution CI with PvaCO2 ≤ 6 mmHg improved the correlation of thermodilution with DFCI (R = 0.73, 95% CI: 0.61, 0.83) compared with discordant cases (R = 0.41, 95% CI: 0.14, 0.6) (Figure 3). For evaluation of correlation by each concordant/discordant subgroups, see Supplementary material online, Figure S4.
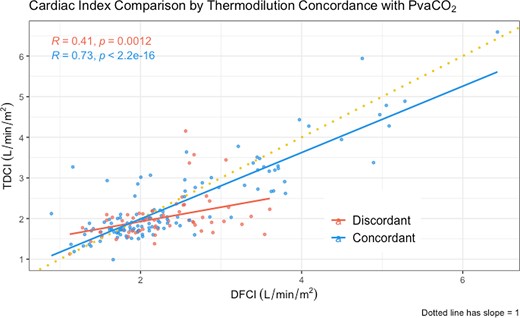
Cardiac output comparison by thermodilution concordance with PvaCO2. Comparison of direct Fick with thermodilution cardiac indices, depending on thermodilution concordance with veno-arterial carbon dioxide gradient. Concordant was defined by both variables giving the same information (i.e. either thermodilution cardiac index < 2.5 mL/min/m2 and PvaCO2 > 6 mmHg or thermodilution cardiac index ≥ 2.5 mL/min/m2 and PvaCO2 ≤ 6 mmHg). Discordant was defined as variables pointing in the opposite direction, one indicating normal cardiac index and the other suggesting low cardiac index, i.e. thermodilution cardiac index < 2.5 mL/min/m2 and PvaCO2 ≤ 6 mmHg or thermodilution cardiac index ≥ 2.5 mL/min/m2 and PvaCO2 > 6 mmHg. Dotted line has slope of 1, points along it would reflect perfect correlation between the two cardiac output methods. PvaCO2, veno-arterial carbon dioxide gradient; TDCI, thermodilution cardiac index, DFCI, direct Fick cardiac index.
Sensitivity and confounder stratification analyses
Based on the 2022 update to the PVR cut-off of 2 WU, a sensitivity analysis of the main correlation findings was performed by PH subtype. The full cohort results are unchanged. Using the new cut-offs, 44.1% of patients were classified as pre-capillary, 46.3% as combined pre- and post-capillary, and 9.7% as isolated post-capillary. The correlation was again slightly stronger in the pre-capillary PH group, R = −0.59 (95% CI: −0.70, −0.44, P < 0.0001), and worse in both combined (R = −0.37, 95% CI: −0.72, 0.10, P = 0.13) and post-capillary groups (R = −0.39, 95% CI: −0.57, −0.16, P < 0.001).
Haemodynamic measurements stratified by thermodilution cardiac index and veno-arterial carbon dioxide gradient
| Characteristic | TDCI < 2.5 L/min/m2 | TDCI ≥ 2.5 L/min/m2 | P-valueb | |||
|---|---|---|---|---|---|---|
| Overall, N = 186a | PvaCO2 ≤ 6 mmHg, N = 55a | PvaCO2 > 6 mmHg, N = 85a | PvaCO2 ≤ 6 mmHg, N = 40a | PvaCO2 > 6 mmHg, N = 6a | ||
| Right atrial pressure, mmHg | 12 (9, 17) | 12 (9, 17) | 15 (10, 18) | 11 (8, 13) | 12 (10, 16) | 0.019 |
| Mean PA pressure, mmHg | 46 (35, 54) | 46 (36, 52) | 49 (42, 57) | 33 (26, 45) | 60 (40, 68) | <0.001 |
| Transpulmonary gradient, mmHg | 29 (18, 39) | 29 (18, 38) | 33 (25, 41) | 18 (10, 30) | 44 (19, 53) | <0.001 |
| Thermodilution CI, L/min/m2 | 1.95 (1.71, 2.41) | 1.92 (1.70, 2.07) | 1.77 (1.66, 1.95) | 3.19 (2.84, 3.67) | 3.41 (2.76, 3.54) | <0.001 |
| Direct Fick CI, L/min/m2 | 2.11 (1.78, 2.67) | 2.17 (1.86, 2.62) | 1.88 (1.66, 2.11) | 3.47 (2.65, 3.84) | 2.64 (2.57, 2.78) | <0.001 |
| Mean difference, L/min/m2 | 0.14 | 0.35 | 0.11 | 0.01 | −0.57 | − |
| (95% CI) | (0.06, 0.22) | (0.21, 0.49) | (0.04, 0.19) | (−0.24, 0.25) | (−1.27, 0.14) | |
| (Fick—Thermodilution) | ||||||
| PVR, wood units | 7.4 (3.9, 10.8) | 7.4 (4.4, 11.1) | 9.0 (6.9, 12.3) | 2.4 (1.6, 4.3) | 5.9 (2.8, 7.3) | <0.001 |
| Mixed venous O2 saturation, % | 63 (58, 69) | 65 (57, 69) | 60 (54, 65) | 70 (67, 74) | 64 (62, 66) | <0.001 |
| PvaCO2, mmHg | 6 (5, 8) | 5 (4, 6) | 8 (7, 9) | 4 (3, 5) | 7 (7, 8) | <0.001 |
PvaCO2, veno-arterial carbon dioxide gradient; PA, pulmonary artery; CI, cardiac index; PVR, pulmonary vascular resistance; O2, oxygen.
Median (IQR).
Kruskal–Wallis rank-sum test.
Because high right atrial pressure (RAP) could impact PvaCO2 due to the impedance of venous outflow, sensitivity analyses on this parameter were performed. Treating RAP as an interaction term with PvaCO2 only modestly improved linear regression performance (R2 of 0.322, compared with 0.285 in the original model; 0.292 after bootstrap validation). Assessing the correlation of PvaCO2 with Fick CI in a subgroup of patients with RAP ≥ 12 (n = 107) resulted in a slightly worse correlation compared with the full cohort (R = −0.46, 95% CI: −0.60, −0.30). See Supplementary Material for further analyses on potential confounders.
Analysis of mixed vs. central partial pressure of carbon dioxide
A separate prospective analysis of 32 patients was performed in order to assess the agreement between partial pressure of carbon dioxide (PCO2) values obtained from mixed venous gas and blood obtained near-simultaneously from the superior vena cava (‘central’ venous blood gas) during right heart catheterization. The correlation between the two values was very strong (R = 0.93, 95% CI: 0.84, 0.97). However, central venous PCO2 overestimated mixed venous PCO2, mean difference 3.3 mmHg (95% CI: 2.5, 4.0), with a range of −1 to 8 mmHg. Limits of agreement were wide (−1.10, 7.59) (see Figure 4). PvaCO2 was not computed in this prospective cohort as arterial blood gasses were not obtained as part of the patient’s routine care.
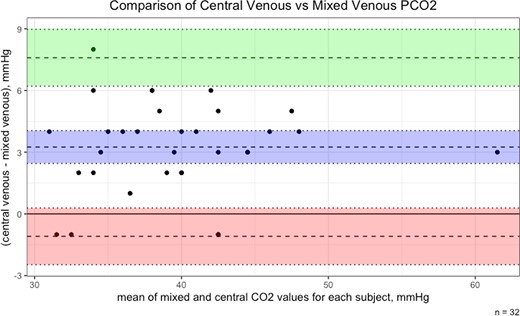
Bland–Altman plot of central vs. mixed venous carbon dioxide. PCO2, partial pressure of carbon dioxide. Blue area = mean difference with 95% confidence interval (CI). Green area = 1.96 standard deviation (SD) with 95% CI. Red area = −1.96 SD with 95% CI.
Discussion
In the largest cohort to date assessing PvaCO2 to predict CI, we found a moderate correlation of R = −0.51 with DFCI in patients with PH. PvaCO2 had similar strength of correlation across all CI methods, including thermodilution, indirect Fick, and mixed venous oxygen saturation. Performance was somewhat better in pre-capillary PH patients, as well as those on PH-specific therapies, and somewhat worse in patients with BMI >30 kg/m2.
To our knowledge, this is the largest analysis of PvaCO2 to estimate CI to date and the only one to use the gold standard DFCI method as a reference. It is also the first to specifically study patients with PH. Most other investigations have evaluated patients in shock, predominantly septic, and used thermodilution CI as the reference value. Our correlation value is similar to what other studies have reported, although the reported ranges span from roughly 0.3 to 0.8,10,12,15–17 with one >0.9.11 Because this cohort of patients was not in shock, it is possible that some have adapted physiologically to a lower CI, and thus, the flow could be sufficient to clear carbon dioxide from the tissues despite numerically lower CI. Our derived cut-off of >6 mmHg to identify abnormal DFCI is consistent with what has been used throughout the literature cited. The apparently contraindicatory finding of improved correlation in pre-capillary PH patients with elevated BMI may be an example of collider bias18 as the plausibility is low, although it could be investigated in future analyses.
Central venous carbon dioxide meaningfully overestimated the mixed venous value in the prospective cohort, with a strong correlation but wide limits of agreement between the two. Because simultaneous arterial blood gasses were not obtained, we cannot compare the mixed venous PvaCO2 to the central venous PvaCO2. Regardless, such a wide bias to calculate a parameter like PvaCO2 (which typically ranges from roughly 1 to 15 mmHg) is too imprecise to use central venous gasses in this population. This conflicts with some of the available literature, which has suggested that central or mixed venous gasses could be used interchangeably to calculate PvaCO2.11,17,19,20 However, some of these have only compared the correlation between the mixed venous and the central venous PvaCO2 values, rather than the limits of agreement. Interestingly, in this study, in all but four cases (4/32, 12.5%), the central venous PCO2 was higher than the mixed value. At least one other study has documented a similar difference.21 We hypothesize that this may be due to a higher metabolic activity of the upper body (particularly cerebral activity) compared with that of the lower body in a supine, resting state. Future studies could attempt to predict central venous PvaCO2 with CI in this population, although given the wide limits of agreement with the mixed value, the relationship may be weaker.
The single-centre, retrospective, observational nature of this study is a limitation. However, the more relevant limitation is the inherent selection bias, as patients who had their DFCI measured were overwhelmingly those with borderline or low thermodilution CI, which may limit generalizability. Despite these limitations, this was a well-characterized group of patients with the PH of all haemodynamic types who had CI measurements using the gold standard technique. The correlation strength was similar to that in many other investigations and was reasonably consistent across CI measurement techniques.
Our findings suggest that PvaCO2 has select utility in patients with PH. When thermodilution CI is available, a concordant PvaCO2 value suggests a more reliable measurement when compared with DFCI. Discordant values may compel the clinician to consider measuring by the DFCI method, particularly when the thermodilution CI is low. Using the alternative cut-offs to maximize PPV and NPVs may also enhance its utility. Importantly, this work does not support the interchangeability of central and mixed venous CO2 values, given the bias towards higher central values and overall wide limits of agreement. This has immediate implications for critical care clinicians caring for patients with PH, as it cannot be assumed that central venous gas CO2 values are useful, similar to what is already known regarding the limitations of central venous oxygen saturation compared with mixed venous oxygen saturation values.22,23
Conclusions
PvaCO2 correlates moderately with Fick CI and may be useful to identify patients who have low CI or patients in whom thermodilution values may be less reliable. Central venous carbon dioxide values do not appear to be interchangeable with mixed values in the equation for veno-arterial carbon dioxide gradient.
Supplementary material
Supplementary material is available at European Heart Journal: Acute Cardiovascular Care.
Acknowledgements
M.T.S. drafted the bulk of the manuscript, performed the data analysis, and quality-checked the data collection process; he is the guarantor of the paper, taking responsibility for the integrity of the work as a whole, from inception to publication. A.B. and A.R.T. also wrote portions of the manuscript and performed the data analysis and interpretation. J.K., O.P., D.T., J.L., D.P., and P.F. all participated in the processes of data acquisition and quality control and critically revised the work for important intellectual content. A.D. and C.L. interpreted the data analysis and critically revised the work for important intellectual content. M.T.S. and A.R.T. conceived and designed the study. All authors approved the final version of the manuscript for publication.
Funding
No funding was received for this work.
Data availability
The data underlying this article cannot be shared publicly due to privacy reasons but could be shared on reasonable request with a data use agreement executed with the institution of the corresponding author.
References
Author notes
Conflict of interest: None declared.

Comments