


Abstract
An invasively measured cardiac index (CI) of ≤2.2 L/min/m2 is one of the strongest prognostic indicators after ST-elevation myocardial infarction (STEMI), however, knowledge is mainly based on invasive evaluations performed in the pre-stent era. Velocity-encoded phase-contrast cardiac magnetic resonance (PC-CMR) allows non-invasive determination of CI.
In this prospective study, CMR was performed in 406 stable and contemporarily revascularized patients a median of 3 days after STEMI. Forward stroke volume was assessed at the level of the ascending aorta by PC-CMR. Left ventricular ejection fraction (LVEF) and global longitudinal strain (GLS) were determined by cine CMR. Major adverse cardiac events (MACE) were defined as the composite of death, myocardial infarction, or hospitalization for heart failure. Median CI was 2.52 L/min/m2 and 27% of patients had ≤2.2 L/min/m2. Median LVEF was 53% and median GLS was −12.2%. During a median follow-up of 14.2 [95% confidence interval (95% CI) 13.6–14.7] months, 41 patients (10.1%) experienced a MACE. A depressed CI was significantly associated with MACE after adjustment for LVEF, GLS, Thrombolysis in Myocardial Infarction (TIMI) risk score, and infarct size [hazard ratio = 3.15 (95% CI 1.53–6.47); P = 0.002] and led to significant discrimination improvement [net reclassification improvement 0.61 (95% CI 0.25–0.97); P < 0.001].
A CI of 2.2 L/min/m2 or less as measured by PC-CMR was present in 27% of clinically stable patients after STEMI and strongly and independently predicted medium-term MACE. The prognostic value of a depressed CI was superior and incremental to LVEF, GLS, TIMI risk score, and infarct size.

Introduction
ST-elevation myocardial infarction (STEMI) is the most common cause of cardiogenic shock.1 Invasively measured cardiac indices belong to the strongest short-term prognostic indicators after STEMI2,3 and a cardiac index (CI) of 2.2 L/min/m2 or less measured by pulmonary artery catheter is part of the accepted criteria of cardiogenic shock.4–6 Knowledge about the prognostic value of haemodynamic indices in the acute phase after STEMI is mainly based on invasive evaluation in the pre-stent era in patients with cardiogenic shock.7 Routine pulmonary artery catheterization has been abandoned for several reasons. Recently a clinical classification of cardiogenic shock has been proposed incorporating clinical signs and biomarkers, invasive haemodynamics only when available.4
Velocity-encoded, phase-contrast cardiac magnetic resonance (PC-CMR) is an accepted non-invasive method for the assessment of haemodynamics and commonly used in congenital heart disease for flow quantification in central arteries.8–13 It allows measurement of both forward and reverse blood flow in the ascending aorta independent of aortic regurgitation (AR) and mitral regurgitation (MR) in a few minutes. Results have been proven to be reproducible14 with a lower inter-institutional variance than cine CMR.15 Our group has previously reported on CI measurements with PC-CMR in healthy controls demonstrating excellent agreement with cine CMR.16
The aim of the present study was to (i) non-invasively evaluate the prevalence of a depressed CI of 2.2 L/min/m2 or less among contemporary revascularized and stable STEMI patients (Killip < 3), (ii) characterize patients with a depressed CI, and (iii) examined its prognostic value in comparison to established non-invasive prognostic markers.
Methods
Patient population and endpoint definition
This prospective and observational CMR study analysed STEMI patients enrolled in the Magnetic Resonance IN Acute STEMI (MARINA-STEMI) trial (NCT04113356) between 2011 and 2019 presenting at the Heart Center of the University Clinic III of Innsbruck. Exclusion criteria were an estimated glomerular filtration rate <30 mL/min/m2, contraindications to CMR, and haemodynamic instability not allowing CMR acquisition. Clinical endpoints were assessed via telephone interviews at 6, 12, and then every 12 months thereafter. A major adverse cardiac event (MACE) was defined as the composite of all-cause death, non-fatal reinfarction, and the occurrence of new heart failure after hospital discharge for the index event. Before study inclusion, written informed consent was given by all participants. The study was designed and conducted in compliance with the Declaration of Helsinki and received approval by the research ethics committee of the Medical University of Innsbruck.
Cardiac magnetic resonance protocol and image evaluation
All scans were performed on a 1.5 Tesla Magnetom AVANTO scanner (Siemens, Erlangen, Germany) as described previously.17 Late enhancement images were acquired 10 min after gadolinium injection as previously described.18 Cine stroke volume was the difference between end-diastolic and end-systolic volume, cardiac output calculated by the multiplication of stroke volume and heart rate during CMR. Feature tracking CMR analyses were performed using the commercially available left ventricle (LV)-specific Tissue Tracking software (Circle Cardiovascular Imaging, Inc., Calgary, Canada) as previously described.19 In 45 patients (11.1%) feature tracking data were missing. To quantify forward and reverse blood flow in the ascending aorta a free-breathing, velocity-encoded phase-contrast protocol with a spatial resolution of 1.3 mm × 1.3 mm × 8 mm was applied directly after the cine CMR protocol. Flow measurements were performed using retrospective gating with an acquired temporal resolution of 41.68 ms, which was retrospectively interpolated to 128 phases during image reconstruction. Velocity encoding was set to 150 cm/s per protocol and adjusted to 200 cm/s or higher, if necessary, to avoid aliasing artefacts.20,21 Following a previously described procedure to determine pulse wave velocity22 image slices were set perpendicular to the ascending and descending aorta at the level of the pulmonary artery and perpendicular to the descending aorta at the level of diaphragm to measure through-plane flow.20 The acquisition time for each slice position was ∼2min. Evaluation was performed using standard software (ARGUS, Siemens Erlangen, Germany). Contours of the ascending aorta were drawn manually on all 128 phases, and flow (mL/s) throughout one cardiac cycle was measured using the velocity values of the corresponding velocity-encoded images. Forward stroke volume was defined as the net forward flow in the ascending aorta over one cardiac cycle. Heart rate was determined from the mean RR interval during PC-CMR. Cardiac output was calculated by multiplication of forward stroke volume and heart rate during PC-magnetic resonance imaging (MRI). A depressed CI was defined as 2.2 L/min/m2 or less.6,7Figure 1 presents exemplary flow curves in the ascending aorta of two patients with moderately reduced left ventricular ejection fraction (LVEF) and greatly diverging CI after infarction of the left anterior descending artery.
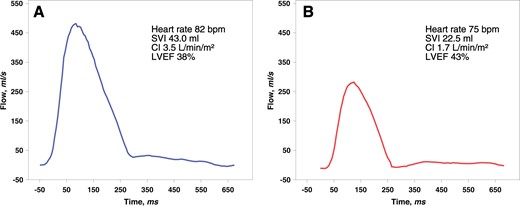
Flow curves in the ascending aorta in two cases after left anterior descending artery infarction presenting with greatly diverging haemodynamics and similar left ventricular ejection fraction. (Patient A) A 41-year-old male presented after a delay of 100 min (cine magnetic resonance imaging Supplementary material online, Videos S1–S3). (Patient B) A 60-year-old male was intervened after a delay of 280 min (cine magnetic resonance imaging Supplementary material online, Videos S4–S6). CI, cardiac index ; LVEF, left ventricular ejection fraction; SVI, stroke volume index.
Transthoracic echocardiography
In 315 patients (78%), echocardiograms were available for analysis of MR and AR as well as aortic stenosis (no patient with mitral stenosis). Echocardiograms were performed in routine clinical practice in the Echocardiography department of the University Hospital Innsbruck. Native exams were reloaded from the PACS system and reanalysed by an experienced examiner similar to previously described.23
Statistics
IBM SPSS Statistics 25.0 (Armonk, NY, USA) and R 3.6.1 (The R Foundation, Austria) were used for statistical analyses. P-values <0.05 were considered to indicate statistical significance. Shapiro–Wilk test was used to test for normal distribution. Data are presented as median with interquartile range (IQR); comparisons were performed with non-parametric Wilcoxon test. Median follow-up was calculated using the reverse Kaplan–Meier method. Categorical variables were compared using the χ2 test. Correlation of variables was performed using the Spearman correlation coefficient. Univariate and multivariate Cox regression analyses were performed to identify predictors of MACE. The TIMI (Thrombolysis in Myocardial Infarction) risk score was used instead of the individual risk factors age, diabetes, hypertension, heart rate, Killip class, weight, anterior infarction, and time to treatment. The continuous variables LVEF, global longitudinal strain (GLS), and infarct size were categorized for better comparison of hazard ratios (HRs). For discrimination analysis LVEF was dichotomized at 40%, GLS at −12%, infarct size at 19%, and the TIMI risk score at its median similar to previously published literature.19,24,25
To assess whether the threshold of 2.2 L/min/m2 is appropriate or whether another potential form of relationship between CI and time to MACE would be missed by such a categorization, non-linear P-splines were performed for the univariate model of the continuous variable CI. Kaplan–Meier survival curves were used to describe the cumulative incidence of event-free survival over time, and log-rank test was used to test for differences. To disclose predictors of a depressed CI ≤2.2 L/min/m2 binary logistic regression was performed. The incremental prognostic value of a CI of 2.2 L/min/m2 or less as compared with established parameters of LV function was further evaluated by discrimination analyses using R package PredictABEL. Continuous net reclassification improvement (NRI) and integrated discrimination improvement were calculated.
Results
Study population
In total, 406 STEMI patients treated by primary percutaneous coronary intervention after a median ischaemia time of 192 (IQR 125–331) minutes were included (Figure 2). Cine CMR and PC-CMR were performed sequentially a median of 3 (IQR 2–4) days after STEMI. Table 1 provides CMR parameters at baseline. During phase-contrast imaging 12 patients (3%) required adjustment of velocity encoding to 200 cm/s to eliminate aliasing.
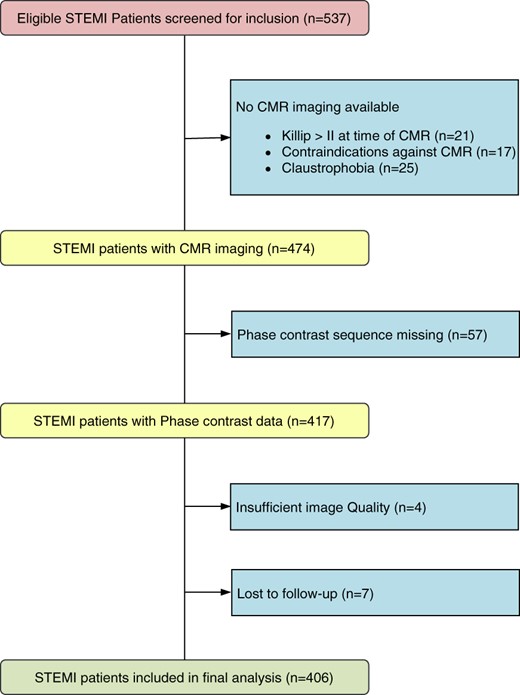
Flow diagram of the present study. CMR, cardiac magnetic resonance; STEMI, ST-elevation myocardial infarction.
Patient characteristics
| Total population | No MACE (n=365) | MACE (n=41) | P-value | |
|---|---|---|---|---|
| Age (years) | 57 (50–66) | 56 (49–65) | 65 (53–72) | 0.002 |
| Male sex (%) | 83,7 | 83.8 | 82.9 | 0.5 |
| BSA (m²) | 2 (1.9–2.1) | 2 (1.9–2.1) | 1.9 (1.8–2.1) | 0.1 |
| Hypertension (%) | 50.7 | 46 | 85.4 | <0.001 |
| Smoking (%) | 54.6 | 54.2 | 53.7 | 0.5 |
| Hyperlipidaemia (%) | 55.4 | 46.3 | 85.4 | 0.3 |
| Diabetes (%) | 10.8 | 9.3 | 24.4 | 0.007 |
| Creatinine (mg/dL) | 0.96 (0.85–1.08) | 0.96 (0.85–1.08) | 0.93 (0.83–1.07) | 0.51 |
| Peak hs-TnT (ng/L) | 5089 (2146–8923) | 4742 (2007–8369) | 7596 (3963–14 877) | 0.002 |
| Total ischaemia time (min) | 192 (125–331) | 195 (224–332) | 188 (125–356) | 0.8 |
| Door to balloon (min) | 25 (3–55) | 25 (3–54) | 25 (3–64) | 0.6 |
| IS (% of LVMM) | 15.0 (7.2–24.6) | 14 (7–24) | 20 (11–35) | 0.01 |
| MVO (%) | 52.7 | 51 | 72.5 | 0.007 |
| MVO (% of LVMM) | 0.36 (0–1.9) | 0.22 (0–1.8) | 1 (0–4.8) | 0.007 |
| TIMI risk score | 3 (2–5) | 3 (2–5) | 5 (2–6) | 0.01 |
| Multivessel disease (%) | 39.8 | 36.9 | 60 | 0.003 |
| Culprit lesion | ||||
| RCA/LAD/LCX/RI | 39.1/46.4/13.5/1 | 40.5/43.6/14.8/1.1 | 29.3/68.3/2.4/0 | 0.01 |
| TIMI flow post-PCI | ||||
| 0/1/2/3 | 0.5/1.3/11.8/86.5 | 0.5/0.8/11.2/87.4 | 0/4.9/17.1/78.0 | 0.09 |
| Mitral regurgitation (echocardiography) | ||||
| None (%) | 42.5 | 44.4 | 30.6 | 0.2 |
| Mild (%) | 43.5 | 41.5 | 58.3 | |
| Moderate (%) | 11.4 | 12.3 | 11.1 | |
| Severe (%) | 2.6 | 1.8 | 0 | |
| Heart rate cine CMR | 70 (62–79) | 70 (62–79) | 74 (65–85) | 0.05 |
| LV EDVI (mL/m²) | 72 (63–82) | 72 (64–82) | 79 (58–86) | 0.6 |
| LV ESVI (mL/m²) | 34 (27–43) | 34 (27–41) | 40 (24–52) | 0.2 |
| LV EF (%) | 53 (45–59) | 53 (45–59) | 49 (40–59) | 0.1 |
| SVI cine (mL/m²) | 37 (31–43) | 37.4 (32–43) | 33.0 (28–41) | 0.02 |
| CI cine (L/min/m²) | 2.59 (2.2–2.9) | 2.60 (2.2–3) | 2.53 (2.1–2.8) | 0.8 |
| CI cine ≤2.2 L/min/m² (%) | 23.2 | 22.3 | 31.7 | 0.12 |
| Heart rate PC-CMR | 67 (60–78) | 67 (60–77) | 68 (60–81) | 0.3 |
| SVI PC-CMR (mL/m²) | 37.5 (31.7–43) | 37.9 (32–43) | 34.1 (29–39) | 0.02 |
| CI PC-CMR (L/min/m²) | 2.52 (2.2–2.9) | 2.52 (2.2–2.9) | 2.4 (2.1–2.8) | 0.13 |
| CI PC ≤2.2 L/min/m² (%) | 26.9 | 24.9 | 46.3 | 0.004 |
| GLS (%) | −12.2 (−14.1 to −10.0) | −12.4 (−14.2 to −10.1) | −10.8 (−12.5 to −6.8) | <0.001 |
BSA, body surface area; CI, cardiac index; EDVI, end-diastolic volume index; ESVI, end-systolic volume index; EF, ejection fraction; GLS, global longitudinal strain; hs-TnT, high sensitive troponin T; IS, infarct size; LAD, left anterior descending artery; LCX, circumflex artery; LV, left ventricle; LVMM, left ventricular myocardial mass; MACE, major adverse cardiac events; MVO, microvascular obstruction; PC-CMR, phase-contrast cardiac magnetic resonance; PCI, percutaneous coronary intervention; RCA, right coronary artery; RI, ramus intermedius; SVI, stroke volume index; TIMI, Thrombolysis in Myocardial Infarction.
In the overall population, median CI by PC-CMR in the ascending aorta was 2.52 L/min/m2 (IQR 2.2–2.9; range 1.39–3.94). Twenty-seven percent of patients had a depressed CI of 2.2 L/min/m2 or less, a further 21% a CI of 2.2–2.5 L/min/m2. Mean CI by cine CMR was 2.59 L/min/m2 (IQR 2.2–2.9; range 1.16–4.71), correlation of CI by cine and by PC-MR was moderate (r = 0.58; P = <0.001) (Supplementary material online, Figure S1A). Median LVEF was 53% (IQR 45–59%; range 15–83) and median GLS was −12.2% (IQR −14.1 to −10.0%; range −3.9 to −20.3%). Correlations between CI by PC-CMR and LVEF and GLS were weak (both r < 0.25, P < 0.001; Supplementary material online, Figure S1B and C).
Mitral and aortic valvular disease—transthoracic echocardiography
Eighty-six percent either had no or only minimal and 14% had at least moderate or severe MR (Table 1). Aortic regurgitation was significantly less common, 9.2% had mild and 2.2% moderate AR and no cases of severe AR were documented. Mitral regurgitation had significant impact on CI measurement, CI by PC-CMR was lower in patients with at least moderate MR (2.4 vs. 2.6 L/min/m2, P = 0.007), whereas CI by cine MR was not (2.5 vs. 2.6 L/min/m2, P = 0.4).
Characteristics of patients with a cardiac index ≤2.2 L/min/m2
Table 2 presents the comparison of patients with depressed and normal CI (as measured by PC-CMR). Multivariate binary logistic regression demonstrated that older age, smaller end-diastolic LV volume, and lower LVEF were the parameters independently contributing to a depressed CI (Supplementary material online, Table S1).
Characteristics of patients with a depressed and normal cardiac index
| Cardiac index ≤2.2 L/min/m² a (n = 110) | Cardiac index ≥2.2 L/min/m² a (n = 296) | P-value | |
|---|---|---|---|
| Age (years) | 63 (54–72) | 55 (49–64) | <0.001 |
| Male sex (%) | 73 | 87.7 | <0.001 |
| BSA (m²) | 2 (1.8–2.1) | 2 (1.9–2.1) | 0.04 |
| Hypertension (%) | 54.1 | 49.7 | 0.2 |
| Smoking (%) | 53.2 | 54.6 | 0.4 |
| Hyperlipidaemia (%) | 55 | 55 | 0.5 |
| Diabetes (%) | 12.6 | 10.6 | 0.3 |
| Haemoglobin | 14.6 (13.6–15.6) | 14.7 (13.9–15.8) | 0.2 |
| Creatinine (mg/dL) | 0.99 (0.87–1.12) | 0.95 (0.84–1.06) | 0.04 |
| Peak hs-TnT (ng/L) | 6250 (3375–11 334) | 4587 (1940–7887) | 0.001 |
| Total ischaemia time (min) | 221 (139–343) | 185 (120–323) | 0.09 |
| Door to balloon (min) | 25 (4.5–56) | 25 (3–55) | 0.5 |
| TIMI risk score | 4 (2–5) | 3 (2–5) | 0.03 |
| IS (% of LVMM) | 17.0 (10.5–27.0) | 14.0 (6.6–23.3) | 0.008 |
| Multivessel disease (%) | 42.7 | 38.7 | 0.2 |
| Culprit lesion | |||
| RCA/LAD/LCX/RI | 37.8/47.7/13.5/0.9 | 41.1/44.7/13.2/1 | 0.9 |
| TIMI flow post-PCI | |||
| 0/1/2/3 | 0.9/0.9/10.8/87.4 | 0.3/1.3/12.6/85.5 | 0.8 |
| Mitral regurgitation (echocardiography) | |||
| None (%) | 36.8 | 44.8 | 0.09 |
| Mild (%) | 43.4 | 43.5 | |
| Moderate (%) | 16.9 | 9.5 | |
| Severe (%) | 3.6 | 2.2 | |
| GLS | −11.5 (−14 to 8.8) | −12.5 (−14.2 to 10.7) | 0.008 |
| LV EDVI (mL/m²) | 70.3 (58–80) | 73.3 (65–83) | 0.03 |
| LV ESVI (mL/m²) | 35.3 (28–45) | 33.4 (27–42) | 0.2 |
| LV EF (%) | 48.5 (40–55) | 54.1 (47–60) | <0.001 |
BSA, body surface area; CI, cardiac index; EDVI, end-diastolic volume index; ESVI, end-systolic volume index; EF, ejection fraction; GLS, global longitudinal strain; hs-TnT, high sensitive Troponin T; IS, infarct size; LAD, left anterior descending artery; LCX, circumflex artery; LV, left ventricle; LVMM, left ventricular myocardial mass; MRI, magnetic resonance imaging; MVO, microvascular obstruction; PC-CMR, phase-contrast cardiac magnetic resonance; PCI, percutaneous coronary intervention; RCA, right coronary artery; RI, ramus intermedius; SVI, stroke volume Index; TIMI, Thrombolysis in Myocardial Infarction.
Cardiac index as per PC-MRI.
Clinical outcome
During a median follow-up of 14.2 [95% confidence interval (95% CI) 13.6–14.7] months, 41 patients (10.1%) experienced a MACE. Ten patients died, 17 experienced a myocardial infarction, and 14 were hospitalized due to heart failure. In terms of typical risk factors, patients with MACE were older [65 (53–72) vs. 56 (49–65) years], diabetes (24.4% vs. 9.3%) and hypertension (85.4% vs. 46%) were more common (all P < 0.05). The TIMI risk score was significantly higher in patients with MACE [5 points (2–6) vs. 3 points (2–5); P = 0.01] (Table 1). Stroke volume index by both cine MR and PC-CMR was significantly lower in patients with MACE, as was LVEF and GLS. Whereas CI by PC-CMR was not statistically different, a depressed CI of 2.2 L/min/m2 was nearly twice as common in patients with MACE [(46.3 vs. 24.9%); P = 0.004].
Figure 3 shows the Kaplan–Meier curve demonstrating MACE-free survival for patients with a CI of ≤2.2 L/min/m2. A CI of 2.2 L/min/m2 or less determined by PC-CMR was associated with a significantly lower risk of MACE-free survival than with a CI >2.2 L/min/m2 (P = 0.003).
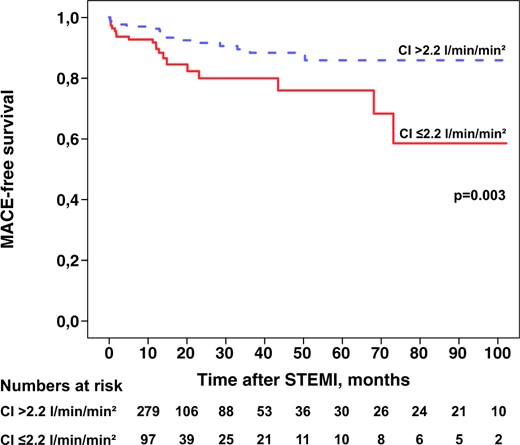
Kaplan–Meier curve demonstrating the event-free survival in relation to a cardiac index ≤2.2 L/min/m2 as assessed with phase-contrast magnetic resonance. CI, cardiac index; MACE, major adverse cardiac events; STEMI, ST-elevation myocardial infarction.
Cox regression analysis
First, the form of relationship of CI with ‘Time to MACE’ was assessed using a non-linear P-spline. Figure 4 shows the HR for varying values of CI compared to the median (2.52 L/min/m2), indicating increasing risk for decreasing values of CI. The risk starts to increase for values lower than the median and reaches a plateau for values lower than ∼2.1–2.2 L/min/m2. In univariable Cox regression, a PC-CMR–CI of 2.2 L/min/m2 or less was significantly associated with time to MACE [HR = 2.48 (95% CI 1.34–4.59), P = 0.004]. In multivariable Cox regression adjusted for LVEF, GLS, infarct size, and the TIMI risk score the HR increased to 3.15 (95% CI 1.53–6.47; P = 0.002) (Table 3). The addition of a CI of 2.2 L/min/m2 to a model with the same variables led to a significant improvement of discrimination between those experiencing a MACE and those who did not [continuous NRI 0.61 (95% CI 0.25–0.97); P < 0.001].
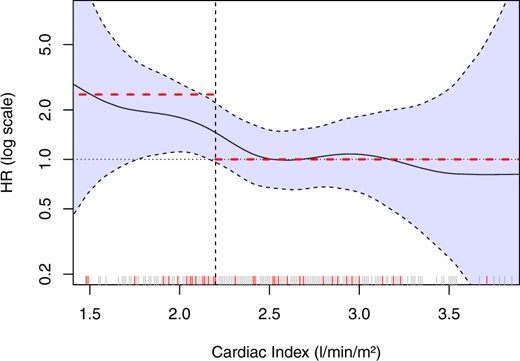
Non-linear spline analysis demonstrating that the dichotomization of cardiac index at 2.2 L/min/m2 did not miss any relevant potential other form of association. The hazard ratio of 2.48 in univariable Cox regression analysis represents the curve on the left side of the cut-off quite well, whereas the same is true for the reference groups (cardiac index > 2.2 L/min/m2) with a hazard ratio of 1. Each line on the x-axis represents a patient and red lines represent patients with major adverse cardiac events. HR, hazard ratio.
Cox models
| Univariable | Multivariable | |||
|---|---|---|---|---|
| HR (95% CI) | P-value | HR (95% CI) | P-value | |
| CI ≤2.2 L/min/m²a | 2.48 (1.34–4.59) | 0.004 | 3.15 (1.53–6.47) | 0.002 |
| TIMI risk score >median | 1.99 (1.05–3.77) | 0.034 | 1.42 (0.69–2.93) | 0.3 |
| LVEF <40% | 2.46 (1.20–5.05) | 0.014 | 1.16 (0.43–3.07) | 0.8 |
| Infarct size >19% | 1.86 (0.98–3.52) | 0.056 | 1.41 (0.64–3.13) | 0.4 |
| GLS >−12% | 2.47 (1.18–5.18) | 0.016 | 1.97 (0.84–4.58) | 0.1 |
95% CI, 95% confidence interval; CI, cardiac index; HR, hazard ratio; GLS, global longitudinal strain; LVEF, left ventricular ejection fraction; MRI, magnetic resonance imaging; TIMI, Thrombolysis in Myocardial Infarction.
Cardiac index as per PC-MRI.
Discussion
The key findings of this study can be summarized as follows: first, we demonstrated that a substantial portion (27%) of clinically stable post-STEMI patients had a CI of 2.2 L/min/m2 or less, which corresponds to the usually accepted criteria of low output. These patients were older, had smaller LVs and a lower LVEF.
Second, we showed that a CI of 2.2 L/min/m2 or less was significantly predictive of MACE, which was independent of LVEF, GLS, infarct size, or the TIMI risk score. In particular, a depressed CI had a significant incremental predictive value for MACE when added to an LV function risk model comprising the same parameters in reclassification analysis.
Depressed cardiac index after ST-elevation myocardial infarction
Invasively measured cardiac indices have been demonstrated to be the most powerful prognostic indicators in shock after STEMI.3,6 Routine pulmonary artery catheterization, however, has been abandoned for many reasons and is nowadays performed only in a minority of patients.26 Already in 1977, in their seminal study, Forrester et al.7 have demonstrated that 14% of patients without clinical hypoperfusion had a CI of 2.2 L/min/m2 or less, which was shown in other studies.27 These data indicate that a depressed CI is more common in stable patients after STEMI than clinically anticipated.
Recently a new clinical shock definition was proposed focusing on readily available clinical signs and laboratory results.4 According to this definition patients who are ‘at risk’ for cardiogenic shock (group A) have no signs or symptoms but should have—if available—a CI >2.5 L/min/m2. In contrary patients with ‘beginning shock’ (group B) are well perfused but demonstrate subtle clinical signs and have—if available—a CI of 2.2–2.5 L/min/m2. Our study comprised stable patients (Killip < 3) and were therefore group A from a clinical perspective. However, 27% of patients would be reclassified to group C according to their CI of ≤2.2 L/min/m2 and a further 21% of patients would be reclassified to group B according to their CI of 2.2–2.5 L/min/m2.
These results indicate that a rapid and non-invasive measurement of CI would be needed to better categorize patients who are asymptomatic but may have a more depressed CI than clinically anticipated. Why some patients remain clinically stable despite depressed cardiac indices is unclear. Once myocardial function starts to improve after revascularization and optimal medical therapy one might speculate that the improvement goes unrecognized within days, no data are available about repeat CI measurements after STEMI.
As Figure 4 demonstrates the relation between CI and MACE is not linear. Patients with higher cardiac indices—despite systolic dysfunction after recent STEMI—can have further, outcome-limiting comorbidities which falsely increase cardiac output (anaemia, systemic inflammation, etc.). As Figure 4 demonstrates most cases of MACE cluster below 2.2 L/m2/min, the remainder spread out over the whole spectrum. This explains the lack of significant difference in simple statistical comparison of the median (MACE vs. no MACE).
Furthermore, the association between a depressed CI and myocardial reinfarction appears less clear—in contrary to heart failure post-myocardial infarction. However, the pathophysiology of thrombosis is three-fold. Besides endothelial dysfunction, systemic procoagulopathy, it is also slow flow that contributes to atherothrombosis and myocardial infarction.
Cardiac magnetic resonance markers after ST-elevation myocardial infarction
Cardiac MRI has become the gold standard cardiac imaging method after STEMI for volumetric quantification, determination of LVEF, infarct size, and microvascular obstruction.24,28 In recent years newer imaging markers like GLS have evolved, demonstrating strong and incremental prognostic value beyond accepted parameters of outcome like LVEF.19 Measurement of CI non-invasively in the ascending aorta by PC-CMR now adds on to this list offering independent and strong prognostic information, which is superior, and offers incremental information to LVEF, GLS, infarct size, and the TIMI risk score.
Data on left ventricular volumes and subsequently CI are routinely available during cine CMR; however, this information is significantly biased by left-sided valvular regurgitations, in particular MR, a common consequence of STEMI.29 In our study, CI by PC-CMR was significantly lower in patients with at least moderate MR compared to patients without MR, whereas there was no difference in CI measured by cine-CMR. Second, in our study, the number of patients with a depressed cine-CI was not significantly different in patients with or without MACE which is in line with a previous study.30 Third, possible bias may be introduced by the necessary measurements of end-diastolic and end-systolic volumes.
Characteristics of patients with a depressed cardiac index
When characterizing patients with a depressed CI we have demonstrated that a depressed CI was associated with older age, smaller LVs, and a lower LVEF. The association between older age and a depressed cardiac output is not new and has been demonstrated in previous studies.3 Not taking into account the acute myocardial infarction these demographics remind us of patients with previous heart failure and preserved (HFpEF) or mid-range LVEF (HFmrEF). Patients with HFpEF or HFmrEF are known to be of older age and a higher prevalence of female sex and relevant comorbidities.31
Limitations
Flow measurements made in vivo are only approximations based on results of phantom studies.32 The gold standard in terms of CI measurements is right heart catheterization. However, this technique has a number of significant limitations. Besides being invasive, it is operator dependent, highly sensitive to a number of technical issues and variations of respiratory and heart rate and right-sided valvular regurgitation.
As we have used a free-breathing and high-resolution PC-CMR sequence further study would be needed to examine whether a standard PC-CMR sequence—which can be performed in a 10–12 s breathhold—delivers similar results. Furthermore, our results cannot be extended to patients with relevant aortic stenosis due to increased flow velocities and complex flow patterns.13 Our imaging focused on the avoidance of aliasing. Although velocity encoding may be set higher than necessary, noise is unlikely to become a source of systematic error when it is about flow quantification.20,21
In conclusion, in contemporarily treated and stable STEMI patients a depressed CI of 2.2 L/min/m2 or less is common and a strong and independent predictor of MACE. Velocity-encoded PC-CMR allows quick and reliable measurement of CI in the ascending aorta and its prognostic value was superior to LVEF, GLS, infarct size, and the TIMI risk score and offered incremental discrimination improvement. A rapid and non-invasive measurement of CI could improve risk categorization patients when there is suspicion of a depressed cardiac index but symptoms are relatively mild and/or LVEF appears relatively preserved. In addition, further research on cardiac index measurement by PC-CMR could prove valuable in other cardiac disease, e.g. chronic left heart failure or right heart failure secondary to pulmonary hypertension.
Supplementary material
Supplementary material is available at European Heart Journal – Acute Cardiovascular Care online.
Data availability statement
The data underlying this article will be shared on reasonable request to the corresponding author.
Funding
The author(s) received no financial support for the research, authorship, and/or publication of this article.
Conflict of interest: none declared.

Comments