


Abstract
To use quality indicators to study the management of ST-segment elevation myocardial infarction (STEMI) in different regions.
Prospective cohort study of STEMI within 24 h of symptom onset (11 462 patients, 196 centres, 26 European Society of Cardiology members, and 3 affiliated countries). The median delay between arrival at a percutaneous cardiovascular intervention (PCI) centre and primary PCI was 40 min (interquartile range 20–74) with 65.8% receiving PCI within guideline recommendation of 60 min. A third of patients (33.2%) required transfer from their initial hospital to one that could perform emergency PCI for whom only 27.2% were treated within the quality indicator recommendation of 120 min. Radial access was used in 56.6% of all primary PCI, but with large geographic variation, from 76.4 to 9.1%. Statins were prescribed at discharge to 98.7% of patients, with little geographic variation. Of patients with a history of heart failure or a documented left ventricular ejection fraction ≤40%, 84.0% were discharged on an angiotensin-converting enzyme inhibitor/angiotensin receptor blocker and 88.7% were discharged on beta-blockers.
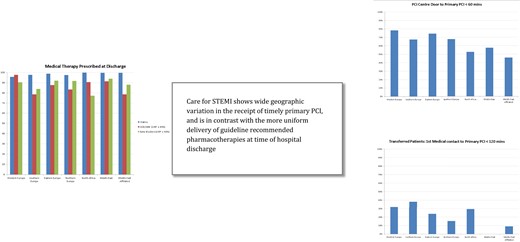
Care for STEMI shows wide geographic variation in the receipt of timely primary PCI, and is in contrast with the more uniform delivery of guideline-recommended pharmacotherapies at time of hospital discharge.
Introduction
In European countries, the incidence of ST-segment elevation myocardial infarction (STEMI) varies between 43 and 144 per 100 000 per year.1 In-hospital mortality rates for STEMI are reported to be between 3 and 12%,2 and following primary percutaneous cardiovascular intervention (PCI) the 30-day, 1-year, and 5-year all-cause mortality rates have been reported as 7.9, 11.4, and 23.3% respectively.3 The 2017 European Society of Cardiology (ESC) guidelines for STEMI care4 synthesized the literature that has provided an understanding of therapies and strategies that improve survivorship of patients presenting with STEMI. It has been shown that adherence to guidelines is associated with improved outcomes,5–11 yet geographic variation in care is well recognized, and has been present for decades being documented in previous surveys within the Euro Heart Survey Programme in 2000,12 2004,13 2009,14 and also in more recent studies.1,2
Measuring standards of care is a mechanism by which variation can be addressed and cardiovascular outcomes improved. To address the second translational gap between optimal and actual care,15,16 the ESC Acute Cardiovascular Care Association (ACCA, but now renamed the Association for Acute Cardiovascular Care—ACVC) and European Society of Cardiology (ESC) have endorsed the development and use of quality indicators17 to compare health service provision and serve as a foundation for quality improvement initiatives. The ESC Quality Indicators for acute myocardial infarction are split these into seven domains of care proposing 12 main quality indicators and several secondary indicators. The indicators address organizational measures, performance measures for reperfusion therapy, in-hospital risk assessment, anti-thrombotic medication during hospitalization, secondary prevention at discharge, patient satisfaction and counselling at discharge, and outcomes including risk-adjusted mortality. At the time these quality indicators were described, the latest available European guidelines were the 2012 ESC STEMI guidelines18 and the 2014 ESC/EACTS guidelines on myocardial revascularization.19 When the 2017 ESC STEMI guidelines were published those quality indicators pertaining to STEMI were broadly mirrored,4 but there were subtle differences which are described in more detail below. While the main results of this registry have been published,20 in this current analysis, we used some of these quality indicators to measure and compare the performance of hospitals across different geographical regions for patients presenting with STEMI.
Methods
The design and methods of the registry have been published.21,22 A brief summary of the salient features is given in the following sections.
Study organization and selection of centres
This registry was a joint initiative of the ACCA and the European Association of Percutaneous Cardiovascular Interventions (EAPCI) under the umbrella of the EURObservational Research Programme (EORP). The number of centres in each country varied according to its approximate size. The choice of centres was made by the National Coordinator of each country. To maximize representativeness, each category of hospital (with and without PCI facilities) was selected in proportion to the distribution of the different types of centres in the individual country. Each centre was asked to enrol at least 30, and up to 60 consecutive patients presenting with STEMI in the community within 24 h after symptom onset. The writers declare that this study complies with the Declaration of Helsinki, that the locally appointed ethics committee has approved the research protocol and that informed consent has been obtained from the subjects (or their legally authorized representative).
Patients
Inclusion criteria were all patients aged >18 years with an initial diagnosis of STEMI according to the ESC 2012 STEMI guidelines, admitted within 24 h after symptom onset. Enrolment started on 1 January 2015 and continued until 31 March 2018. Characteristics of the treating centres were recorded. For each patient, demographic features, mode of admission, therapeutic methods, and time delays to reperfusion were documented on an electronic case record form. Risk stratification, adverse events, and medications during admission and at discharge were also recorded. Follow up for clinical events and life status was censored at 1 year.
Quality indicators
While both the quality indicators from the position paper of the ACCA17 and the quality indicators subsequently set out in the 2017 ESC Guidelines for the Management of Acute Myocardial Infarction in Patients Presenting with ST-Segment Elevation4 are broadly similar, there are slight differences. For clarity, the relevant quality indicators as they relate to STEMI are compared in Table 1, and set alongside the indicators used in the current analysis. The data set for the registry was established before publication of either of these suites of quality indicators, and indeed before the publication of the most recent updated 2020 quality indicators.23
Comparison of a selection of the Acute Cardiovascular Care Association and European Society of Cardiology ST-Elevation Myocardial Infarction guideline quality indicators, and those used in the current analysis
| ACCA | ESC | Current analysis | |
|---|---|---|---|
| Centre organization | Centre should be part of a STEMI network (with features detailed) | Same as ACCA | Is centre part of a STEMI network (no features detailed) |
| Reperfusion | Proportion of STEMI patients reperfused among eligible (onset of symptoms to diagnosis<12 h) | Proportion of STEMI patients arriving in the first 12 h receiving reperfusion therapy | Proportion of STEMI patients arriving in the first 12 h receiving reperfusion therapy |
| Fibrinolysis: <30 min from diagnosis (FMC) to needle | For patients attending in the pre-hospital setting: | FMC to lytic bolus <30 min | |
| <10 min from STEMI diagnosis to lytic bolus | |||
| PPCI: For patients attending in the pre-hospital setting: No recommendation | PPCI: For patients attending in the pre-hospital setting: <90 min from STEMI diagnosis to IRA wire crossing for reperfusion with PCI | PPCI: For patients attending in the pre-hospital setting: <90 min from STEMI diagnosis to IRA wire crossing for reperfusion with PCI | |
| Treated by PPCI and admitted to PCI centre: <60 min Door to arterial access for reperfusion by PCI | For patients admitted to PCI centres <60 min from STEMI diagnosis to IRA wire crossing for reperfusion with PCI | PCI door to PPCI (absolute value) and % treated within 60 min | |
| For transferred patients: | For transferred patients: | ||
| Door-in-door-out time of <30 min | <30 min door-in-door out for patients presenting to a non-PCI centre (en route to a PCI centre) | ||
| <120 min from STEMI diagnosis to IRA wire crossing for reperfusion with PCI | |||
| Time between diagnosis (FMC) and arterial access time (absolute value) for primary PCI | FMC to primary PCI (all) (absolute value) | ||
| FMC to primary PCI (all) < 120 min | |||
| Performance measures for risk assessment in hospital | Proportion of patients having LVEF assessment | Proportion of patients having LVEF assessed before discharge | Proportion of patients having LVEF assessed before discharge |
| Performance measures for discharge medication and counselling | Proportion of patients with AMI discharged on statins, unless contra-indicated, at high intensity (defined as Atorvastatin ≥40 mg or Rosuvastatin ≥20 mg) | Proportion of patients without contra-indications with a statin (high intensity) prescribed at discharge | Proportion statin at discharge |
| Proportion of patients with AMI and clinical evidence of heart failure or a LVEF ≤ 40% who are discharged on beta-blockers, unless contra-indicated | Proportion of patients with LVEF ≤ 40% or clinical evidence of heart failure and without contra-indications with a beta-blocker prescribed at discharge | Proportion of patients with LVEF ≤ 40%, clinical evidence of heart failure or history of chronic heart failure with a beta-blocker prescribed at discharge | |
| Proportion of patients with AMI and clinical evidence of heart failure or a LVEF ≤ 40% who are discharged on ACEI (or ARBs if intolerant of ACEI) unless contra-indicated | Proportion of patients with LVEF ≤ 40% or clinical evidence of heart failure without contra-indications with an ACE inhibitor (or ARB if not tolerated) prescribed at discharge | Proportion of patients with LVEF ≤ 40% or clinical evidence of heart failure discharged on an AECI/ARB | |
| Opportunity-based composite quality indicators | Proportion of patients with LVEF > 40% and no evidence of heart failure receiving at discharge low-dose aspirin and a P2Y12 inhibitor and high-intensity statins | Same as ACCA | Proportion of ALL patients receiving at discharge aspirin a P2Y12 inhibitor and a statins |
| Proportion of patients with LVEF ≤ 40% and/or heart failure receiving at discharge low-dose aspirin and a P2Y12 inhibitor and high-intensity statins, an ACE inhibitor (or ARB) and a beta-blocker | Same as ACCA | Proportion of patients with LVEF ≤ 40% and/or heart failure receiving at discharge all of: Aspirin, P2Y12 inhibitor, statins, an ACE/ARB and a beta-blocker |
ACCA, Acute Cardiovascular Care Association; ACEI, angiotensin-converting enzyme inhibitor; AMI, acute myocardial infarction; ARB, angiotensin receptor blocker; ESC, European Society of Cardiology; FMC, first medical contact; IRA, infarct-related artery; STEMI, ST-elevation myocardial infarction; LVEF, left ventricular ejection fraction; GRACE, Global Registry of Acute Coronary Events; PCI, percutaneous coronary intervention; PPCI, primary PCI.
While the ACCA (ACVC) guidelines consider STEMI diagnosis to be equivalent to first medical contact (FMC), the ESC STEMI guideline Task Force suggest that the reperfusion strategy clock (time zero) should start at the time of ‘STEMI diagnosis’ [usually 12-lead electrocardiogram (ECG)]. It recommends that FMC to STEMI diagnosis should be ≤10 min. In measuring the start of primary PCI, ACCA has used arterial access and the ESC ‘infarct-related artery’ wire crossing. ACCA suggests < 30 min from diagnosis and FMC to lytic bolus, but the ESC guideline is <10 min from STEMI diagnosis. If we combine this with the recommended <10 min from FMC to STEMI diagnosis, this would equate to a <20 min guideline, compared with ACCA’s <30 min. Other indicators are essentially the same.
Regions
We divided the cohort into seven regions according to the definition of the World Health Organization: four European (Northern Europe, Eastern Europe, Western Europe, and Southern Europe), North Africa, Middle East, and non-ESC Middle East. In two of these regions, only one country participated (for North Africa it was Egypt, and for Middle East it was Israel). Israel shared the data collected for national biennial survey of ACS ACSIS during March–April, 2016.
Statistics
Categorical data were described using numbers and percentages for non-missing data, and continuous data were described using medians, interquartile range (IQR), means, and standard deviations (SDs). Comparison between groups was performed using the Kruskal–Wallis test or using Pearson’s χ2 test or Fisher’s exact test if any expected cell count was <5. All analyses were conducted using SAS version 9.4, with statistical significance determined at 5%.
Results
From 1 January 2015 to 31 March 2018, 11 462 patients in 196 centres from 29 countries were enrolled into the registry. The contribution of each country and baseline demographics have been published.22 The relative percentage of patients included from each of the regions was as follows: Northern Europe (2.1%), Western Europe (2.4%), Middle East (6.6%), North Africa (11.8%), Middle East Affiliated (20.8%), Southern Europe (22.8%), and Eastern Europe (33.6%). The overall mean age was 61 years (varying from 55 years in North Africa to 64 years in North Europe), 76.9% males, 26.7% having diabetes, and 45.7% smokers. Overall, 72.2% of patients received PCI, 18.8% thrombolysis, and 9.0% no reperfusion therapy. Across the European regions, primary PCI varied only from 83.2% (eastern) to 97.4% (western). There were greater differences with other regions with, for example, Middle East Affiliated countries showing a primary PCI rate of 45.7% (Figure 1, see Supplementary material online, Table S1).
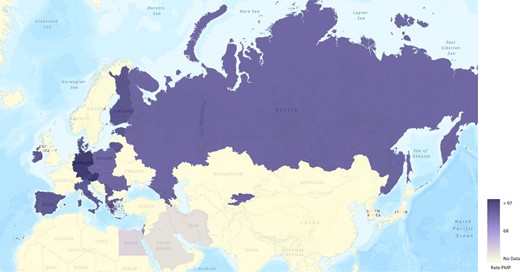
Percentage of patients treated by primary percutaneous coronary intervention for ST-elevation myocardial infarction by region.
Centre organization (structural measures)
Of the 156 centres providing information, 82.7% (n = 129) were part of a STEMI network, varying from 38.9% in the Middle East Affiliated, to 100% in Northern Europe (however, note that this information was not provided by 40 centres). The median number of primary PCIs performed each year was 300 (IQR 145–500), which varied from 100 (IQR 100–238) in Middle East Affiliated, to 380 (IQR 300–600) in Eastern Europe (see Supplementary material online, Table S2). By the nature of participation in this registry, all did systematically record key times to reperfusion for quality assessment, as recommended in the quality indicators.
Performance measures for reperfusion therapy
The majority of patients included in the registry presented within 12 h of symptoms (93.7%). Of these, 92.7% received reperfusion therapy (72.7% by primary PCI and 20.0% by lysis). The proportion of patients not treated by PCI or lysis varied from 2.5% (West Europe) to 15.1% (Middle East). The median time between symptom onset and call for help was 75 min (IQR 30–190), and to FMC 100 min (IQR 50–225). The shortest time to FMC was seen in North Europe and Middle East (80 min) and longest in North Africa (120 min).
Details of the regional breakdown of reperfusion treatment, time delays, the type of medical contact, admission mode, and admission site are given in Table 2. The most frequent FMC was either a medical ambulance crew (37.9%) or the staff in an Emergency Department (41.2%), with 72.8% presenting via medical ambulance in Eastern Europe, but 2.6% in North Africa where the majority (81.4%) presented to an Emergency Department. Paramedical ambulance crews were used most often in West and North Europe (21.9% of FMC for both), but rarely elsewhere. Just under half of patients self-presented (44.2%), but this was most common in North Africa and Middle East Affiliated (86.1 and 78.8%, respectively), and much less common in West, East, and North Europe (15.2, 11.0, and 15.3%, respectively). Presentation with an out-of-hospital cardiac arrest was uncommon, but highest in Middle East (13.2%) and West Europe (8.2%).
Admission process by region
| Overall | Western Europe | Southern Europe | Eastern Europe | Northern Europe | North Africa | Middle East | Middle East Affiliated Countries | P-value | ||
|---|---|---|---|---|---|---|---|---|---|---|
| (N = 11 462) | (N = 270) | (N = 2613) | (N = 3846) | (N = 242) | (N = 1356) | (N = 756) | (N = 2379) | |||
| Time between symptoms onset and first medical contact < 12 h | Yes | 10 503/11 214 (93.7%) | 243/265 (91.7%) | 2424/2588 (93.7%) | 3505/3844 (91.2%) | 226/242 (93.4%) | 1292/1356 (95.3%) | 502/542 (92.6%) | 2311/2377 (97.2%) | <0.001 (S) |
| No | 711/11 214 (6.3%) | 22/265 (8.3%) | 164/2588 (6.3%) | 339/3844 (8.8%) | 16/242 (6.6%) | 64/1356 (4.7%) | 40/542 (7.4%) | 66/2377 (2.8%) | ||
| ND | 248 | 5 | 25 | 2 | 0 | 0 | 214 | 2 | ||
| Type of initial reperfusion therapy among patients with Time between symptoms onset and first medical contact < 12 h | Primary PCI | 7635/10 503 (72.7%) | 236/243 (97.1%) | 2127/2424 (87.8%) | 2964/3505 (84.6%) | 201/226 (88.9%) | 634/1292 (49.1%) | 412/502 (82.1%) | 1061/2311 (45.9%) | <0.001 (S) |
| Thrombolysis | 2105/10 503 (20.0%) | 1/243 (0.4%) | 109/2424 (4.5%) | 388/3505 (11.1%) | 17/226 (7.5%) | 568/1292 (44.0%) | 14/502 (2.8%) | 1008/2311 (43.6%) | ||
| None/Not applicable | 763/10 503 (7.3%) | 6/243 (2.5%) | 188/2424 (7.8%) | 153/3505 (4.4%) | 8/226 (3.5%) | 90/1292 (7.0%) | 76/502 (15.1%) | 242/2311 (10.5%) | ||
| ND | 0 | 0 | 0 | 0 | 0 | 0 | 0 | 0 | ||
| Time between symptoms onset and call for medical help (min) | Number of data (Number of missing data) | 9129 (2333) | 231 (39) | 2056 (557) | 3243 (603) | 234 (8) | 1269 (87) | 0 (756) | 2096 (283) | <0.001 (S) |
| Mean (± SD) | 188.8 (±389.1) | 221.8 (±419.8) | 197.3 (±505.1) | 218.8 (±430.9) | 167.5 (±341.7) | 175.0 (±255.8) | NA | 141.2 (±214.6) | ||
| Median (Q1; Q3) | 75.0 (30.0; 190.0) | 90.0 (20.0; 220.0) | 60.0 (30.0; 180.0) | 80.0 (30.0; 231.0) | 60.0 (27.0; 160.0) | 85.0 (30.0; 210.0) | NA | 75.0 (30.0; 166.5) | ||
| (Min; Max) | (0.0; 13 020.0) | (0.0; 3678.0) | (0.0; 13 020.0) | (0.0; 10 080.0) | (0.0; 3572.0) | (0.0; 4380.0) | NA | (0.5580.0) | ||
| Time between symptoms onset and first medical contact (min) | Number of data (Number of missing data) | 11 214 (248) | 265 (5) | 2588 (25) | 3844 (2) | 242 (0) | 1356 (0) | 542 (214) | 2377 (2) | <0.001 (S) |
| Mean (± SD) | 221.6 (±460.6) | 233.0 (±408.7) | 227.6 (±531.3) | 257.3 (±486.7) | 249.9 (±812.5) | 201.6 (±255.6) | 251.1 (±765.9) | 158.0 (±218.0) | ||
| Median (Q1; Q3) | 100.0 (50.0; 225.0) | 105.0 (43.0; 225.0) | 90.0 (45.0; 210.0) | 110.0 (55.0; 270.0) | 80.0 (45.0; 190.0) | 120.0 (60.0; 240.0) | 80.0 (39.0; 180.0) | 90.0 (45.0; 185.0) | ||
| (Min; Max) | (0.0; 14 189.0) | (0.0; 3700.0) | (0.0; 13 035.0) | (0.0; 10 080.0) | (0.0; 10 261.0) | (10.0; 4440.0) | (0.0; 14 189.0) | (0.0; 5580.0) | ||
| Type of first medical contact | General Practitioners | 1203/11 451 (10.5%) | 42/270 (15.6%) | 328/2613 (12.6%) | 302/3846 (7.9%) | 24/242 (9.9%) | 143/1356 (10.6%) | 17/745 (2.3%) | 347/2379 (14.6%) | <0.001 (S) |
| Medical Ambulance | 4345/11 451 (37.9%) | 120/270 (44.4%) | 754/2613 (28.9%) | 2798/3846 (72.8%) | 135/242 (55.8%) | 35/1356 (2.6%) | 221/745 (29.7%) | 282/2379 (11.9%) | ||
| Paramedical ambulance | 665/11 451 (5.8%) | 59/270 (21.9%) | 154/2613 (5.9%) | 300/3846 (7.8%) | 53/242 (21.9%) | 17/1356 (1.3%) | 68/745 (9.1%) | 14/2379 (0.6%) | ||
| Emergency Room staff | 4718/11 451 (41.2%) | 42/270 (15.6%) | 1287/2613 (49.3%) | 367/3846 (9.5%) | 27/242 (11.2%) | 1104/1356 (81.4%) | 188/745 (25.2%) | 1703/2379 (71.6%) | ||
| Others | 520/11 451 (4.5%) | 7/270 (2.6%) | 90/2613 (3.4%) | 79/3846 (2.1%) | 3/242 (1.2%) | 57/1356 (4.2%) | 251/745 (33.7%) | 33/2379 (1.4%) | ||
| ND | 11 | 0 | 0 | 0 | 0 | 0 | 11 | 0 | ||
| Admission mode | Via ambulance/EMS | 6388/11 444 (55.8%) | 229/270 (84.8%) | 1328/2613 (50.8%) | 3422/3846 (89.0%) | 205/242 (84.7%) | 189/1356 (13.9%) | 511/738 (69.2%) | 504/2379 (21.2%) | <0.001 (S) |
| Self-presented | 5056/11 444 (44.2%) | 41/270 (15.2%) | 1285/2613 (49.2%) | 424/3846 (11.0%) | 37/242 (15.3%) | 1167/1356 (86.1%) | 227/738 (30.8%) | 1875/2379 (78.8%) | ||
| ND | 18 | 0 | 0 | 0 | 0 | 0 | 18 | 0 | ||
| Admission site | Admission direct to PCI centre | 7656/11 462 (66.8%) | 219/270 (81.1%) | 1647/2613 (63.0%) | 2932/3846 (76.2%) | 170/242 (70.3%) | 786/1356 (58.0%) | 756/756 (100.0%) | 1146/2379 (48.2%) | <0.001 (S) |
| First hospital not a PCI centre | 3806/11 462 (33.2%) | 51/270 (18.9%) | 966/2613 (37.0%) | 914/3846 (23.8%) | 72/242 (29.8%) | 570/1356 (42.0%) | 0/756 (0.0%) | 1233/2379 (51.8%) | ||
| ND | 0 | 0 | 0 | 0 | 0 | 0 | 0 | 0 | ||
| Out-of-hospital cardiac arrest | Yes | 482/10 963 (4.4%) | 22/269 (8.2%) | 84/2613 (3.2%) | 255/3846 (6.6%) | 13/242 (5.4%) | 34/1356 (2.5%) | 34/258 (13.2%) | 40/2379 (1.7%) | <0.001 (S) |
| No | 10 481/10 963 (95.6%) | 247/269 (91.8%) | 2529/2613 (96.8%) | 3591/3846 (93.4%) | 229/242 (94.6%) | 1322/1356 (97.5%) | 224/258 (86.8%) | 2339/2379 (98.3%) | ||
| ND | 499 | 1 | 0 | 0 | 0 | 0 | 498 | 0 | ||
| Time between first medical contact and Primary PCI (min) | Number of data (Number of missing data) | 8165 (3297) | 259 (11) | 2264 (349) | 3197 (649) | 214 (28) | 663 (693) | 485 (271) | 1083 (1296) | |
| Mean (± SD) | 195.2 (±1105.6) | 193.9 (±906.9) | 215.6 (±1948.7) | 197.6 (±565.2) | 227.5 (±389.9) | 147.1 (±241.6) | 131.9 (±179.9) | 197.2 (±237.4) | ||
| Median (Q1; Q3) | 95.0 (63.0; 163.0) | 90.0 (60.0; 140.0) | 95.0 (63.0; 155.0) | 96.0 (65.0; 155.0) | 110.0 (78.0; 181.0) | 60.0 (36.0; 140.0) | 87.0 (63.0; 129.0) | 125.0 (75.0; 225.0) | ||
| (Min; Max) | (0.0; 89 452.0) | (24.0; 14 435.0) | (0.0; 89 452.0) | (0.0; 14 340.0) | (22.0; 3315.0) | (0.0; 1740.0) | (0.0; 2154.0) | (1.0; 2160.0) | ||
| Time between first medical contact and Primary PCI < 60 min | Yes | 1690/8165 (20.7%) | 60/259 (23.2%) | 456/2264 (20.1%) | 598/3197 (18.7%) | 20/214 (9.4%) | 286/663 (43.1%) | 106/485 (21.9%) | 164/1083 (15.1%) | |
| No | 6475/8165 (79.3%) | 199/259 (76.8%) | 1808/2264 (79.9%) | 2599/3197 (81.3%) | 194/214 (90.7%) | 377/663 (56.9%) | 379/485 (78.1%) | 919/1083 (84.9%) | ||
| ND | 3297 | 11 | 349 | 649 | 28 | 693 | 271 | 1296 | ||
| Time between first medical contact and Primary PCI < 90 min | Yes | 3653/8165 (44.7%) | 127/259 (49.0%) | 1024/2264 (45.2%) | 1416/3197 (44.3%) | 80/214 (37.4%) | 400/663 (60.3%) | 256/485 (52.8%) | 350/1083 (32.3%) | |
| No | 4512/8165 (55.3%) | 132/259 (51.0%) | 1240/2264 (54.8%) | 1781/3197 (55.7%) | 134/214 (62.6%) | 263/663 (39.7%) | 229/485 (47.2%) | 733/1083 (67.7%) | ||
| ND | 3297 | 11 | 349 | 649 | 28 | 693 | 271 | 1296 | ||
| Time between first medical contact and Primary PCI < 120 min | Yes | 5044/8165 (61.8%) | 174/259 (67.2%) | 1404/2264 (62.0%) | 2028/3197 (63.4%) | 119/214 (55.6%) | 466/663 (70.3%) | 348/485 (71.8%) | 505/1083 (46.6%) | |
| No | 3121/8165 (38.2%) | 85/259 (32.8%) | 860/2264 (38.0%) | 1169/3197 (36.6%) | 95/214 (44.4%) | 197/663 (29.7%) | 137/485 (28.3%) | 578/1083 (53.4%) | ||
| ND | 3297 | 11 | 349 | 649 | 28 | 693 | 271 | 1296 | ||
| First qualifying ECG to PCI among patients attended to in a pre-hospital setting | ||||||||||
| Patients attended to in a pre-hospital setting = Type of initial reperfusion therapy = primary AND Admission mode is via ambulance/EMS AND Admission site = direct to PCI centre | Yes | 4353/11 444 (38.0%) | 185/270 (68.5%) | 966/2613 (37.0%) | 2428/3846 (63.1%) | 150/242 (62.0%) | 76/1356 (5.6%) | 402/738 (54.5%) | 146/2379 (6.1%) | |
| No | 7091/11 444 (62.0%) | 85/270 (31.5%) | 1647/2613 (63.0%) | 1418/3846 (36.9%) | 92/242 (38.0%) | 1280/1356 (94.4%) | 336/738 (45.5%) | 2233/2379 (93.9%) | ||
| ND | 18 | 0 | 0 | 0 | 0 | 0 | 18 | 0 | ||
| Time between first qualifying ECG and starting of primary PCI (min) | Number of data (number of missing data) | 4312 (41) | 182 (3) | 966 (0) | 2425 (3) | 150 (0) | 76 (0) | 367 (35) | 146 (0) | |
| Mean (± SD) | 119.0 (±418.0) | 173.9 (±1068.1) | 100.4 (±153.9) | 122.3 (±351.6) | 96.1 (±58.7) | 164.3 (±356.6) | 135.1 (±761.0) | 80.0 (±79.8) | ||
| Median (Q1; Q3) | 74.7 (49.0; 108.0) | 63.5 (50.0; 95.0) | 71.0 (49.0; 105.0) | 78.0 (50.0; 112.0) | 79.5 (59.8; 112.0) | 40.0 (30.0; 75.0) | 66.0 (45.0; 94.0) | 63.5 (34.0; 95.0) | ||
| (Min; Max) | (0.0; 14 457.0) | (5.0; 14 427.0) | (0.0; 1985.6) | (0.0; 9281.0) | (17.0; 422.0) | (5.0; 1530.0) | (4.0; 14 457.0) | (5.0; 680.0) | ||
| Time between First qualifying ECG and Starting of Primary PCI < 90 min | Yes | 2695/4312 (62.5%) | 129/182 (70.9%) | 623/966 (64.5%) | 1433/2425 (59.1%) | 85/150 (56.7%) | 60/76 (79.0%) | 268/367 (73.0%) | 97/146 (66.4%) | |
| No | 1617/4312 (37.5%) | 53/182 (29.1%) | 343/966 (35.5%) | 992/2425 (40.9%) | 65/150 (43.3%) | 16/76 (21.1%) | 99/367 (27.0%) | 49/146 (33.6%) | ||
| ND | 41 | 3 | 0 | 3 | 0 | 0 | 35 | 0 | ||
| First medical contact to PCI among all transferred patients | ||||||||||
| Transferred patients defined as admission site = First hospital not a PCI centre | Yes | 3806/11 462 (33.2%) | 51/270 (18.9%) | 966/2613 (37.0%) | 914/3846 (23.8%) | 72/242 (29.8%) | 570/1356 (42.0%) | 0/756 (0.0%) | 1233/2379 (51.8%) | |
| No | 7656/11 462 (66.8%) | 219/270 (81.1%) | 1647/2613 (63.0%) | 2932/3846 (76.2%) | 170/242 (70.3%) | 786/1356 (58.0%) | 756/756 (100.0%) | 1146/2379 (48.2%) | ||
| ND | 0 | 0 | 0 | 0 | 0 | 0 | 0 | 0 | ||
| Time between first medical contact and Primary PCI (min) | Number of data (Number of missing data) | 1899 (1907) | 50 (1) | 762 (204) | 577 (337) | 52 (20) | 119 (451) | 339 (894) | ||
| Mean (± SD) | 391.1 (±2145.4) | 241.0 (±264.9) | 391.3 (±3315.5) | 425.9 (±709.7) | 560.3 (±667.1) | 306.3 (±334.0) | 357.5 (±328.5) | |||
| Median (Q1; Q3) | 180.0 (111.0; 330.0) | 162.5 (104.0; 270.0) | 140.0 (94.0; 220.0) | 227.0 (120.0; 427.0) | 291.5 (151.0; 807.5) | 180.0 (105.0; 345.0) | 245.0 (165.0; 395.0) | |||
| (Min; Max) | (0.0; 89 452.0) | (58.0; 1708.0) | (0.0; 89 452.0) | (15.0; 8020.0) | (55.0; 3315.0) | (30.0; 1740.0) | (18.0; 2160.0) | |||
| Time between first medical contact and primary PCI < 120 min | Yes | 517/1899 (27.2%) | 16/50 (32.0%) | 290/762 (38.1%) | 137/577 (23.7%) | 8/52 (15.4%) | 35/119 (29.4%) | 31/339 (9.1%) | ||
| No | 1382/1899 (72.8%) | 34/50 (68.0%) | 472/762 (61.9%) | 440/577 (76.3%) | 44/52 (84.6%) | 84/119 (70.6%) | 308/339 (90.9%) | |||
| ND | 1907 | 1 | 204 | 337 | 20 | 451 | 894 | |||
| First medical contact to thrombolysis among all patients | ||||||||||
| Time between first medical contact and thrombolysis (min) | Number of data (number of missing data) | 2154 (9308) | 1 (269) | 115 (2498) | 392 (3454) | 19 (223) | 584 (772) | 12 (744) | 1031 (1348) | |
| Mean (± SD) | 101.7 (±181.2) | 10.0 (±.) | 85.9 (±166.6) | 88.3 (±221.8) | 145.4 (±227.4) | 129.0 (±212.8) | 59.8 (±39.0) | 92.9 (±140.2) | ||
| Median (Q1; Q3) | 60.0 (30.0; 105.0) | 10.0 (10.0; 10.0) | 35.0 (22.0; 90.0) | 55.0 (23.5; 81.0) | 80.0 (46.0; 135.0) | 75.0 (45.0; 125.0) | 51.0 (30.0; 77.5) | 55.0 (30.0; 100.0) | ||
| (Min; Max) | (0.0; 2925.0) | (10.0; 10.0) | (0.0; 1476.0) | (0.0; 2925.0) | (10.0; 1015.0) | (5.0; 1585.0) | (25.0; 163.0) | (2.0; 1725.0) | ||
| Time between first medical contact and Thrombolysis < 30 min | Yes | 436/2154 (20.2%) | 1/1 (100.00%) | 38/115 (33.0%) | 116/392 (29.6%) | 2/19 (10.53%) | 62/584 (10.6%) | 3/12 (25.0%) | 214/1031 (20.8%) | |
| No | 1718/2154 (79.8%) | 0/1 (0.0%) | 77/115 (67.0%) | 276/392 (70.4%) | 17/19 (89.5%) | 522/584 (89.4%) | 9/12 (75.0%) | 817/1031 (79.2%) | ||
| ND | 9308 | 269 | 2498 | 3454 | 223 | 772 | 744 | 1348 |
ECG, electrocardiogram; EMS, emergency medical services; PCI, percutaneous coronary intervention.
For treatment by primary PCI, the overall median time (regardless of admission route) between FMC and PCI was 95 min (IQR 63.0–163.0), with only 20.7% being treated in under 60 min, 44.7% under 90 min, and 61.8% under 120 min. The shortest delays were in North Africa (43.1% in under 60 min) and the longest North Europe (9.4% in under 60 min; Table 2). Note that FMC to PCI includes the journey time for patients diagnosed by paramedic crews, but not for those who self present.
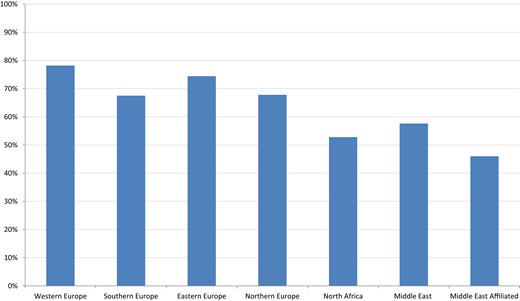
The median delay between arrival at a PCI centre and primary PCI was 40 min (IQR 20–74) with 65.8% receiving PCI within guideline recommendation of 60 min. The median times in all four European regions were rapid, from 30 min (Western Europe) to 36 min (Northern Europe), but longer in North Africa and Middle East at 50 min, and slowest in Middle East Affiliated (61 min). This resulted in the percentage of patients being treated within quality indicator recommendations of 60 min ranging from 78.2% in Western Europe to 46.0% in Middle East Affiliated (see Supplementary material online, Table S3, Figure 2).
PCI centre door to primary PCI < 60 mins.
For patients attended to in a pre-hospital setting (defined as presenting direct to the PCI centre via ambulance/EMS), the median (IQR) time between first qualifying ECG and PCI was 75 min (IQR 49–108 min), with 62.5% receiving PCI within guideline recommendation of 90 min. The breakdown by region is presented in Supplementary material online, Table S4. While only 5.6% of patients were attended to pre-hospital in North Africa, they achieved the shortest delays median 40 min (IQR 30–75 min), while in Northern Europe delays were 80 min (IQR 60–112) with only 56.7% achieving the recommended times.
A third of patients (33.2%) required transfer from their initial hospital to one that could perform emergency PCI. For these patients, the median time from FMC to PCI was 180 min (IQR 111–330 min), meaning that only 27.2% were treated within the quality indicator recommendation of 120 min. Performance varied across regions with the best in Southern Europe (38.1%), and least good in Middle East Affiliated of 9.1% (Figure 3).
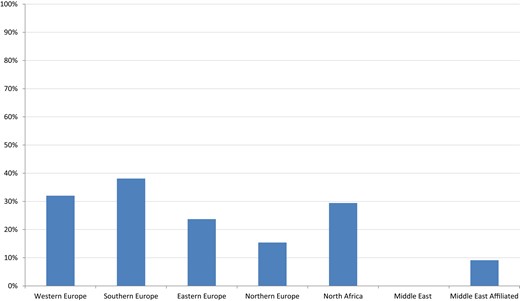
Transferred patients: 1st medical contact to primary PCI < 120 mins.
For patient treated by thrombolysis, the median time between FMC and lytic bolus was 60 min (IQR 30–105 min), only 20.2% receiving therapy within 30 min. The numbers of patients treated by lysis across the European regions were too few to allow helpful comparisons (for example with only one case recorded in West Europe).
Performance of primary PCI: technical aspects
The use of radial artery access and the use of drug-eluting stents during primary PCI were both promoted from Class IIa to Class I level of Evidence A recommendations in the 2017 guidelines (and though were not listed in the quality indicators at the time of this study have subsequently been added to the 2020 quality indicators).23
Radial access occurred in 56.6% of all primary PCI, but with large regional variation, from 76.4 and 72.0% in Middle East and South Europe, respectively, to 21.3 and 9.1% in Middle East Affiliated and North Africa, respectively (see Supplementary material online, Table S5, Figure 4). Stents were used widely in 91.5% of procedures, and 89.4% or more in all regions (see Supplementary material online, Table S6), but the use of drug-eluting stents was more varied. Where a stent was used, this was a drug-eluting stent overall in 77.5%, but ranged from 59.3% in Eastern Europe to 98.8% in Western Europe (see Supplementary material online, Table S7, Figure 5).
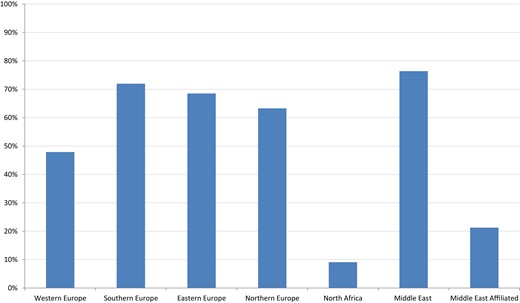
Use of radial artery access.
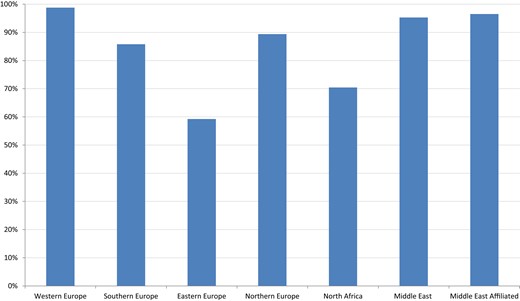
Use of drug eluting stents.
Performance measures for risk assessment in hospital
The proportion of patients with a documented LVEF at discharge was 93.7%, varying from 99.6% in North Europe, to 64.0% in Middle East (see Supplementary material online, Table S8).
Performance measures for discharge medication
Key findings are summarized in Figure 6. Dual antiplatelet therapy was prescribed on discharge in 95.9% of patients. All regions had high levels of appropriate treatment (see Supplementary material online, Table S9).
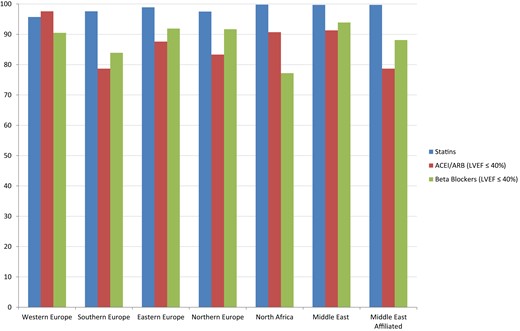
Medical therapy prescribed at discharge.
Statins were prescribed to 98.7% of patients. High levels of prescription were observed in all regions (see Supplementary material online, Table S9). The proportion of all patients discharged on a statin and dual antiplatelet therapy was 95.0%. At discharge the combination of a statin, dual antiplatelet therapy, beta-blocker, and angiotensin-converting enzyme inhibitor/angiotensin receptor blocker (ACEI/ARB), occurred in 74.3% of the primary PCI cohort, and in 69.1% of those treated by lysis. In total a high percentage (46.7%) of all patients (4892 of 10 477) either had a history of heart failure or a documented LVEF of ≤40%. Of these, 84.0% were discharged on an ACEI/ARB (varying from 78.7 to 97.6%), and 88.7% were discharged on beta-blockers (varying from 77.2 to 93.9%), with 71.7% discharged on beta-blockers, ACEI/ARB, statins, and dual antiplatelet therapy (see Supplementary material online, Table S10).
Discussion
This international study of 11 462 patients presenting with STEMI has shown wide geographic variation in clinical practice. This was more evident for the receipt of timely primary PCI than the use of guideline-recommended pharmacotherapies at the time of hospital discharge. The ESC quality indicators for AMI have facilitated a comparison of the performance of centres to reveal marked contrasts and identify areas where care for patients with STEMI could be improved. Primary PCI is the dominant reperfusion strategy but appears under-utilized in the Middle East Affiliated countries. The proportion of patients who presented within 12 h of symptoms who received reperfusion therapy was high in all regions, but the way in which patients presented was quite varied and will determine the optimal ways to organize downstream care. For example, patients use ambulances much more frequently in Europe than in African countries. Time delays to reperfusion therapy were also quite varied, but in all regions, it was particularly long for patients being transferred from a non-PCI to a PCI centre. This applied to a third of all cases with only 27.2% treated within 120 min of FMC. There are many logistic hurdles to overcome to ensure that all patients with STEMI are taken directly to a PCI centre, rather than a hospital that cannot provide this treatment, but these data suggest that this could have a substantial impact on the quality of care received by a large number of patients. Where logistic difficulties prevent timely primary PCI, thrombolysis is still an option, but this registry suggests there is much room for improvement, with only 20.2% receiving lytic bolus within 30 min.
Once PCI was performed, stent use was high, but the use of drug-eluting stents was varied, and this may relate to cost constraints. However, there is evidence of both cost saving and improved survival with radial artery access, yet there was marked geographical variation in the use of radial access, suggesting that education opportunities exist to improve the quality of patient care, particularly in North Africa.
While almost every patient had their LVEF measured before discharge in North Europe, this occurred less frequently in the Middle East. However, there appeared to be high compliance with guidelines in all geographical regions when assessing discharge medication. Patients with contra-indications or side-effects to ACEI/ARB or beta-blockers were not excluded, so to find 84.0 and 88.7% discharged on these agents, respectively, suggests high standards of care.
Limitations
Despite the large number of patients included, the representativeness of the patient population for Europe was somewhat limited. The national sites were selected by the National Societies of Cardiology with the aim of providing a representative sample within the given country. However, since participation was voluntary, a selection bias with participation of ‘better’ centres cannot be excluded and therefore the reality might be less favourable. Although centres were asked to enrol consecutive patients, the requirement of informed consent might mean bias against inclusion of patients who were most unwell and from disadvantaged socioeconomic groups. The larger European countries such as France and the UK did not participate, and Germany only enrolled a small number of patients. For some data points (particularly relating to time delays from FMC), the amount of missing data was high, limiting the accuracy of conclusions of these results.
Actions to be taken
This international assessment of the treatment of patients presenting with STEMI has shown wide variations in practice and revealed opportunities to improve care that vary according to country and geographical region. Increased use of primary PCI requires infrastructural changes, as do strategies to reduce patients requiring inter-hospital transfer to receive primary PCI. The development of improved patient pathways and STEMI networks is recommended where quality indicator targets are not being achieved. The use of appropriate medical therapy appears to be good, but there was marked regional variation in the use of radial artery access. Radial access can reduce cost and improve outcomes, and training and education to increase rates should be encouraged.
Supplementary material
Supplementary material is available at European Heart Journal: Acute Cardiovascular Care online.
Acknowledgements
EORP Oversight Committee, The Registry Executive Committee of the EURObservational Research Programme (EORP): Data collection was conducted by the EORP department from the ESC by Marème Konte and Florian Larras as Data Managers, Elin Folkesson Lefrancq as Project Officer, and Souad Mekhaldi as Clinical Project Manager. Statistical analyses were performed by C.L. Overall activities are coordinated by A.P.M. (Scientific Coordinator EORP). Saudi Heart Association: The Deanship of Scientific Research at King Saud University, Riyadh, Saudi Arabia (research group number: RG-1436-013).
Funding
Since the start of EORP, the following companies have supported the programme: Abbott Vascular Int. (2011–21), Amgen Cardiovascular (2009–18), AstraZeneca (2014–21), Bayer AG (2009–18), Boehringer Ingelheim (2009–19), Boston Scientific (2009–12), The Bristol Myers Squibb and Pfizer Alliance (2011–19), Daiichi Sankyo Europe GmbH (2011–20), The Alliance Daiichi Sankyo Europe GmbH and Eli Lilly and Company (2014–17), Edwards (2016–19), Gedeon Richter Plc. (2014–16), Menarini Int. Op. (2009–12), MSD-Merck & Co. (2011–14), Novartis Pharma AG (2014–20), ResMed (2014–16), Sanofi (2009–11), SERVIER (2009–21), and Vifor (2019–22).
Appendix
ACS STEMI: Investigator Group
Executive Committee
Franz Weidinger AT (Co-Chair), Uwe Zeymer DE (Co-Chair), Nicolas Danchin FR (Co-Chair), Peter Ludman GB (Co-Chair), Peter Sinnaeve, BE, Petr Kala, CZ, Roberto Ferrari, IT, Aldo P. Maggioni, IT.
Steering Committee
Artan Goda, AL; Parounak Zelveian, AM; Franz Weidinger, AT; Kiril Karamfilov, BG; Zuzana Motovska, CZ; Uwe Zeymer, DE; Bent Raungaard, DK; Toomas Marandi, EE; Sameh Mohamed Shaheen, EG; Rosa-Maria Lidon, ES; Pasi Paavo Karjalainen, FI; Zviad Kereselidze, GE; Dimitrios Alexopoulos, GR; David Becker, HU; Martin Quinn, IE; Zaza Iakobishvili, IL; Hasan Al-Farhan, IQ; Masoumeh Sadeghi, IR; Roberto Caporale, IT; Erkin Mirrakhimov, KG; Pranas Serpytis, LT; Andrejs Erglis, LV; Sasko Kedev, MK; Alice May Moore, MT; Dariusz Dudek, PL; Jacek Legutko, PL; Jorge Mimoso, PT; Gabriel Tatu-Chitoiu, RO; Sinisa Stojkovic, RS; Evgeny Shlyakhto, RU; Khalid F AlHabib, SA; Matjaz Bunc, SI; Martin Studencan, SK; Mohamed Sami Mourali, TN; Gani Bajraktari, XK.
EORP Team
Marème Konte, Florian Larras, Elin Folkesson Lefrancq, Souad Mekhaldi, Cécile Laroche, Aldo P. Maggioni.
Investigators
Albania: Tirana: A. Goda, N. Shuka, E. Pavli, E. Tafaj, T. Gishto, A. Dibra, A. Duka, A. Gjana, A. Kristo, G. Knuti, A. Demiraj, E. Dado, E. Hasimi, L. Simoni, M. Siqeca. Armenia: Yerevan: H. Sisakian, Yerevan: H. Hayrapetyan, S. Markosyan, L. Galustyan, N. Arustamyan, H. Kzhdryan, S. Pepoyan. Austria: Graz: A. Zirkik, D. Von Lewinski, S. Paetzold, I. Kienzl, K. Matyas, Krems an der Donau: T. Neunteufl, M. Nikfardjam, U. Neuhold, A. Mihalcz, F. Glaser, Linz: C. Steinwender, C. Reiter, M. Grund, D. Hrncic, Salzburg: U. Hoppe, M. Hammerer, L. Hinterbuchner, Vienna: C. Hengstenberg, Vienna: G. Delle Karth, I. Lang, Vienna: F. Weidinger, W. Winkler, M. Hasun, J. Kastner, C. Havel, M. Derntl, G. Oberegger, J. Hajos, C. Adlbrecht, T. Publig, M.-C. Leitgeb, R. Wilfing, P. Jirak, C.-Y. Ho, L. Puskas, L. Schrutka. Czech Republic: Brno: J. Spinar, J. Parenica, Brno: O. Hlinomaz, V. Fendrychova, J. Semenka, J. Sikora, J. Sitar, L. Groch, M. Rezek, M. Novak, P. Kramarikova, Hradec Kralove: J. Stasek, J. Dusek, P. Zdrahal, Liberec: R. Polasek, J. Karasek, J. Seiner, N. Sukova, Pardubice: I. Varvarovsky, T. Lazarák, V. Novotny, J. Matejka, Plzen: R. Rokyta, S. Volovar, Prague: J. Belohlavek, Prague: Z. Motovska, M. Siranec, M. Kamenik, R. Kralik. Denmark: Aalborg: B. Raungaard, J. Ravkilde, S.E. Jensen, A. Villadsen, K. Villefrance, C. Schmidt Skov, Aarhus: M. Maeng, K. Moeller. Egypt: Assiut: H. Hasan-Ali, T.A. Ahmed, Aswan: M. Hassan, A. ElGuindy, Badr city: M. Farouk Ismail, A. Ibrahim Abd El-Aal, A. El-sayed Gaafar, H. Magdy Hassan, M. Ahmed Shafie, M. Nabil El-khouly, Benha: A. Bendary, M. Darwish, Beni Suef: Y. Ahmed, O. A. Amin, A. AbdElHakim, K. Abosaif, Cairo: H. Kandil, Cairo: M.A.G. Galal, Cairo: E.E. El Hefny, Cairo: M. El-Sayed, K. Aly, M. Mokarrab, Cairo: M. Osman, M. Abdelhamid, S. Mantawy, M.R. Ali, S.D. Kaky, V.A. Khalil, M.E.A. Saraya, A. Talaat, Cairo: M. Nabil, W.M. Mounir, K. Mahmoud A. Aransa, G. Kazamel, S. Anwar, A. Al-Habbaa, M. Abd el Monem, A. Ismael, M. Amin Abu-Sheaishaa, M.M. Abd Rabou, T. M. A. Hammouda, Elkharga: M. Moaaz, Fayoum: K. Elkhashab, T. Ragab, Fayoum: A. Rashwan, A. Rmdan, G. AbdelRazek, H. Ebeid, H. Soliman Ghareeb, Giza: N. Farag, Giza: M. Zaki, M. Seleem, A. Torki, M. Youssef, N.A. AlLah Nasser, A. Rafaat, H. Selim, M.M. Makram, M. Khayyal, K. Malasi, A. Madkour, M. Kolib, H. Alkady, H. Nagah, Mansoura: M. Yossef, A. Wafa, E. Mahfouz, G. Faheem, M. Magdy Moris, Marsa Matruh: A. Ragab, M. Ghazal, A. Mabrouk, M. Hassan, Tanta: M. El-Masry, M. Naseem, S. Samir. Estonia: Tallinn: T. Marandi, J. Reinmets, M. Allvee, A. Saar, T. Ainla, A. Vaide, M. Kisseljova, U. Pakosta, Tartu: J. Eha, K. Lotamois. Finland: Kokkola: J. Sia, J. Myllymaki, T. Pinola, Pori: P.P. Karjalainen, T. Paana, J. Mikkelsson, M. Ampio. Georgia: Tbilisi: J. Tsivilasvili, Tbilisi: P. Zurab, Tbilisi: Z. Kereselidze, R. Agladze, A. Melia, D. Gogoberidze, N. Khubua, L. Totladze, I. Metreveli, A. Chikovani. Germany: Lübeck: I. Eitel, J. Pöss, M. Werner, A. Constantz, C. Ahrens, Ludwigshafen am Rhein: U. Zeymer, H. Tolksdorf, S. Klinger, Munich: S. Sack, T. Heer. Greece: Athens: J. Lekakis, Athens: I. Kanakakis, I. Xenogiannis, K. Ermidou, N. Makris, A. Ntalianis, F. Katsaros, Kerkyra: E. Revi, Chania: K. Kafkala, E. Mihelakis, G. Diakakis, K. Grammatikopoulos, D. Voutsinos, Patras: D. Alexopoulos, I. Xanthopoulou, V. Mplani, Piraeus: S. Foussas, N. Papakonstantinou, N. Patsourakos, A. Dimopoulos, A. Derventzis, K. Athanasiou, Thessaloniki: V.P. Vassilikos, C. Papadopoulos, S. Tzikas, Veroia: I. Vogiatzis, A. Datsios, I. Galitsianos, K. Koutsampasopoulos, S. Grigoriadis, Volos: A. Douras, N. Baka, S. Spathis, T. Kyrlidis, H. Hatzinikolaou. Hungary: Budapest: R.G. Kiss, Budapest: D. Becker, F. Nowotta, K. Tóth, S. Szabó, C. Lakatos, Gyula: Z. Jambrik, J. Ruzsa, Kecskemet: Z. Ruzsa, S. Róna, J. Toth, A. Vargane Kosik, K.S.B. Toth, Miskolc: G.G. Nagy, Z. Ondrejkó, Z. Körömi, B. Botos. Iran: Isfahan: M. Pourmoghadas, Isfahan: A. Salehi, Isfahan: G. Massoumi, M. Sadeghi, A. Soleimani, N. Sarrafzadegan, H. Roohafza, M. Azarm, A. Mirmohammadsadeghi, D. Rajabi, Kermanshah: Y. Rahmani, S. Siabani, F. Najafi, B. Hamzeh, H. Karim, H. Siabani, N. Saleh, H. Charehjoo, L. Zamzam. Iraq: Baghdad: G. Al-Temimi, H. Al-Farhan, A. Al-Yassin, A. Mohammad, A. Ridha, G. Al-Saedi, N. Atabi, O. Sabbar, S. Mahmood, Z. Dakhil, I.F. Yaseen, Nasseria: M. Almyahi, H. Alkenzawi, T. Alkinani, A. Alyacopy. Ireland: Cork: P. Kearney, K. Twomey. Israel: Petah Tikva: Z. Iakobishvili, Ramat Gan: N. Shlomo, R. Beigel. Italy: Bari: P. Caldarola, D. Rutigliano, L. Sublimi Saponetti, N. Locuratolo, V. Palumbo, Benevento: M. Scherillo, D. Formigli, Bergamo: P. Canova, G. Musumeci, F. Roncali, Brescia: M. Metra, C. Lombardi, E. Visco, L. Rossi, Cagliari: L. Meloni, R. Montisci, V. Pippia, M.F. Marchetti, M. Congia, C. Cacace, Caltagirone: G. Luca, G. Boscarelli, Catanzaro: C. Indolfi, G. Ambrosio, A. Mongiardo, C. Spaccarotella, S. De Rosa, G. Canino, C. Critelli, Cosenza: R. Caporale, D. Chiappetta, F. Battista, Fermo: D. Gabrielli, A. Marziali, Genoa: P. Bernabò, Guastalla: A. Navazio, E. Guerri, F. Manca, Lugo: M. Gobbi, Messina: G. Oreto, G. Andò, S. Carerj, F. Saporito, M. Cimmino, Mestre-Venice: F. Rigo, G. Zuin, Naples: B. Tuccillo, F. Scotto di Uccio, L. Irace, Nuoro: G. Lorenzoni, I. Meloni, P. Merella, Partinico: G.M. Polizzi, R. Pino, Pisa: M. Marzilli, D. Morrone, P. Caravelli, E. Orsini, S. Mosa, Rimini: G. Piovaccari, A. Santarelli, C. Cavazza, Rome: F. Romeo, Rome: F. Fedele, M. Mancone, M. Straito, N. Salvi, P. Scarparo, P. Severino, C. Razzini, G. Massaro, A. Cinque, Rome: C. Gaudio, F. Barillà, C. Torromeo, L. Porco, M. Mei, R. Iorio, Saronno: D. Nassiacos, B. Barco, Trieste: G. Sinagra, L. Falco, L. Priolo, A. Perkan. Kosovo: Mitrovica, Pristina: M. Strana, G. Bajraktari, L. Percuku, G. Berisha, B. Mziu. Kyrgyzstan: Bishkek: M. Beishenkulov, T. Abdurashidova, A. Toktosunova, K. Kaliev. Lithuania: Vilnius: P. Serpytis, R. Serpytis, E. Butkute, M. Lizaitis, M. Broslavskyte. Malta: Msida: R.G. Xuereb, A.M. Moore, M. Mercieca Balbi, E. Paris, L. Buttigieg. Poland: Bialystok: W. Musial, S. Dobrzycki, A. Dubicki, E. Kazimierczyk, A. Tycinska, Katowice: W. Wojakowski, B. Kalanska-Lukasik, A. Ochala, W. Wanha, S. Dworowy, Kielce: J. Sielski, M. Janion, A. Janion-Sadowska, Krakow: D. Dudek, J. Wojtasik-Bakalarz, L. Bryniarski, Lodz: J.Z. Peruga, M. Jonczyk, L. Jankowski, Nowy Targ: A. Klecha, J. Legutko, J. Michalowska, M. Brzezinski, T. Kozmik, T. Kowalczyk, J. Adamczuk, Ostrowiec Swietokrzyski: M. Maliszewski, P. Kuziemka, P. Plaza, A. Jaros, A. Pawelec, J. Sledz, Oswiecim: S. Bartus, W. Zmuda, M. Bogusz, M. Wisnicki, G. Szastak, M. Adamczyk, M. Suska, P. Czunko, Warsaw: G. Opolski, J. Kochman, M. Tomaniak, S. Miernik, K. Paczwa, Warsaw: A. Witkowski, M.P. Opolski, A.D. Staruch, Zabrze: Z. Kalarus, G. Honisz, G. Mencel, M. Swierad, T. Podolecki. Portugal: Braga: J. Marques, P. Azevedo, M.A. Pereira, A. Gaspar, Coimbra: S. Monteiro, F. Goncalves, L. Leite, Faro: J. Mimoso, W. Manuel Lopes dos Santos, J. Amado, Funchal: D. Pereira, B. Silva, G. Caires, M. Neto, R. Rodrigues, A. Correia, D. Freitas, Guimaraes: A. Lourenco, F. Ferreira, F. Sousa, J. Portugues, L. Calvo, F. Almeida, Santarem: M. Alves, A. Silva, Setubal: R. Caria, F. Seixo. Romania: Craiova: C. Militaru, E. Ionica, G. Tatu-Chitoiu, O. Istratoaie, M. Florescu. Russian Federation: Astrakhan: E. Lipnitckaia, Belgorod: O. Osipova, Belgorod: S. Konstantinov, V. Bukatov, Cheboksary: T. Vinokur, E. Egorova, E. Nefedova, Chelyabinsk: S. Levashov, A. Gorbunova, M. Redkina, N. Karaulovskaya, Cherkessk: F. Bijieva, Ekaterinburg: N. Babich, O. Smirnova, R. Filyanin, S. Eseva, A. Kutluev, A. Chlopenova, A. Shtanko, E. Kuppar, E. Shaekhmurzina, M. Ibragimova, M. Mullahmetova, M. Chepisova, M. Kuzminykh, Gelendzhik: M. Betkaraeva, A. Namitokov, Kazan: N. Khasanov, Kazan: L. Baleeva, Z. Galeeva, F. Magamedkerimova, E. Ivantsov, Kemerovo: E. Tavlueva, A. Kochergina, D. Sedykh, Krasnodar: E. Kosmachova, Krasnodar: V. Skibitskiy, N. Porodenko, A. Namitokov, K. Litovka, E. Ulbasheva, Krasnoyarsk: S. Niculina, Krasnoyarsk: M. Petrova, E. Harkov, N. Tsybulskaya, A. Lobanova, A. Chernova, A. Kuskaeva, A. Kuskaev, Moscow: M. Ruda, Moscow: D. Zateyshchikov, Moscow: M. Gilarov, E. Konstantinova, O. Koroleva, A. Averkova, N. Zhukova, D. Kalimullin, Nizhny Novgorod: N. Borovkova, A. Tokareva, M. Buyanova, Rostov-on-Don: L. Khaisheva, A. Pirozhenko, Saint Petersburg: T. Novikova, Saint Petersburg: A. Yakovlev, Saint Petersburg: T. Tyurina, K. Lapshin, N. Moroshkina, M. Kiseleva, S. Fedorova, L. Krylova, Samara: D. Duplyakov, Seversk: Y. Semenova, A. Rusina, Tomsk: V. Ryabov, A. Syrkina, S. Demianov, Tyumen: O. Reitblat, A. Artemchuk, Ulyanovsk: E. Efremova, E. Makeeva, M. Menzorov, A. Shutov, N. Klimova, Voronezh: I. Shevchenko, O. Elistratova, O. Kostyuckova, R. Islamov, V. Budyak, E. Ponomareva. Saudi Arabia: Al-Kharj: U. Ullah Jan, Alkhobar: A.M. Alshehri, E. Sedky, Z. Alsihati, Jeddah: L. Mimish, Jeddah: A. Selem, Jeddah: A. Malik, O. Majeed, I. Altnji, Khamis Mushayt: M. AlShehri, Riyadh: A. Aref, Riyadh: K. AlHabib, Riyadh: M. AlDosary, Riyadh: S. Tayel, M. Abd AlRahman, K.N. Asfina, Tabuk: G. Abdin Hussein, Tabuk: M. Butt. Serbia: Belgrade: N. Markovic Nikolic, Belgrade: S. Obradovic, N. Djenic, M. Brajovic, A. Davidovic, R. Romanovic, V. Novakovic, M. Dekleva, M. Spasic, B. Dzudovic, Z. Jovic, D. Cvijanovic, S. Veljkovic, Sremska Kamenica: I. Ivanov, M. Cankovic, M. Jarakovic, M. Kovacevic, M. Trajkovic, Zajecar: V. Mitov, A. Jovic. Slovakia: Banska Bystrica: M. Hudec, M. Gombasky, Bratislava: J. Sumbal, A. Bohm, E. Baranova, Martin: F. Kovar, M. Samos, J. Podoba, Nitra: P. Kurray, T. Obona, A. Remenarikova, B. Kollarik, D. Verebova, G. Kardosova, Presov: M. Studencan, D. Alusik, J. Macakova, M. Kozlej. Spain: Barcelona: A. Bayes-Genis, Barcelona: A. Sionis, C. Garcia Garcia, Barcelona: R.-M. Lidon, A. Duran Cambra, C. Labata Salvador, F. Rueda Sobella, J. Sans Rosello, M. Vila Perales, T. Oliveras Vila, M. Ferrer Massot, J. Bañeras, Galdakao: I. Lekuona, G. Zugazabeitia, Madrid: A. Fernandez-Ortiz, A. Viana Tejedor, C. Ferrera, V. Alvarez, Pontevedra: O. Diaz-Castro, R.M. Agra-Bermejo, C. Gonzalez-Cambeiro, E. Gonzalez-Babarro, J. Domingo-Del Valle, Santander: N. Royuela, V. Burgos, A. Canteli, C. Castrillo, M. Cobo, M. Ruiz, Santiago de Compostela: E. Abu-Assi, J.M. Garcia Acuna.
References
Author notes
Listed in the Appendix.
Conflict of interest: P.L., C.L., M.S., S.M.S., J.L., K.F.A., A.G., E.M., G.B., H.A.F., P.Š., M.S., J.M., D.B, D.A., Z.K., S.S., A.M.M., M.Q., and P.P.K. have nothing to disclose. U.Z. reports: Consulting fees from Amgen, personal fees from Amgen; payment or honoraria for lectures, presentations, speakers’ bureaus, manuscript writing or educational events from Astra Zeneca, Chiesi, Pfizer; participation on a Data Safety Monitoring Board or Advisory Board Astra Zeneca, Chiesi, Bayer, Boehriger Ingelhein, outside the submitted work. R.C. reports participation on a Data Safety Monitoring Board or Advisory Board with personal payments from Daiichi Sankyo, Novartis, Boehringer Ingelheim, Lilly, outside the submitted work. Z.I. reports consulting fees with direct payments to author from Pfizer, Astra Zeneca, Bayer; payment or honoraria for lectures, presentations, speakers bureaus, manuscript writing or educational events from Novartis, Sanofi, Boehringer Ingelheim outside the submitted work. Z.M. reports consulting fees from Amgen; payment or honoraria for lectures, presentations, speakers’ bureaus, manuscript writing or educational events from Astra Zeneca, Chiesi, Pfizer; participation on a Data Safety Monitoring Board or Advisory Board from Astra Zeneca, Chiesi, Bayer, Boehriger Ingelhein outside the submitted work. T.M. reports receipt of funding from Estonian Research Council [PRG435]; payment or honoraria for lectures, presentations, speakers’ bureaus, manuscript writing, or educational events from AstraZeneca, Eesti outside the submitted work. C.P.G. reports grants or contracts from British Heart Foundation, National Institute for Health Research, Horizon 2020, Abbott Diabetes, Bristol Myers Squibb/Pfizer; consulting fees from Amgen, AstraZeneca, Bayer, Bristol Myers Squibb, Boehringer Ingelheim, Chiesi, Daiichi Sankyo, Menarini; payment or honoraria for lectures, presentations, speakers bureaus, manuscript writing or educational events fromBoehringer Ingelheim, Chiesi, Daiichi Sankyo, Menarini; support for attending meetings and/or travel from AstraZeneca, Bayer; patents planned, issued, or pending—FIND-AF; participation on a Data Safety Monitoring Board or Advisory Board—TARGET CTCA DSMB, DANBLOCK DSMB; leadership or fiduciary role in other board, society, committee, or advocacy group, for ESC EuroHeart, NICE IAC, ESC Quality Indicator Committee Chair, outside the submitted work. A.P.M. reports payment or honoraria for lectures, presentations, speakers’ bureaus, manuscript writing or educational events—AstraZeneca, Novartis; participation in study committees—Bayer, Fresenius, outside the present work.

Comments