


Abstract
Type 2 diabetes has reached epidemic proportions in the United States. Large, randomized controlled trials suggest that menopausal hormone therapy (MHT) delays the onset of type 2 diabetes in women. However, the mechanisms and clinical implications of this association are still a matter of controversy. This review provides an up-to-date analysis and integration of epidemiological, clinical, and basic studies, and proposes a mechanistic explanation for the effect of menopause and MHT on type 2 diabetes development and prevention. We discuss the beneficial effects of endogenous estradiol with respect to insulin secretion, insulin sensitivity, and glucose effectiveness; we also discuss energy expenditure and adipose distribution, both of which are affected by menopause and improved by MHT, which thereby decreases the incidence of type 2 diabetes. We reconcile differences among studies that investigated the effect of menopause and MHT formulations on type 2 diabetes. We argue that discrepancies arise from physiological differences in methods used to assess glucose homeostasis, ranging from clinical indices of insulin sensitivity to steady-state methods to assess insulin action. We also discuss the influence of the route of estrogen administration and the addition of progestogens. We conclude that, although MHT is neither approved nor appropriate for the prevention of type 2 diabetes due to its complex balance of risks and benefits, it should not be withheld from women with increased risk of type 2 diabetes who seek treatment for menopausal symptoms.
Large, randomized controlled trials suggest that menopausal hormone therapy (MHT) using estrogens delays the onset of type 2 diabetes in women.
MHT is neither appropriate nor FDA approved for the prevention of type 2 diabetes in women.
Discrepancies in studies assessing the mechanism of MHT antidiabetic actions arise from differences in methods used, ranging from clinical indices of insulin sensitivity (HOMA-IR) to steady-state methods to assess insulin action (euglycemic, hyperinsulinemic clamp).
MHT improves β-cell insulin secretion, glucose effectiveness, and insulin sensitivity, as measured in clinical settings.
New physiological studies designed to unravel the mechanism of action of MHT on glucose homeostasis are warranted.
It is now clear that diabetes has reached epidemic proportions; almost half of the US population has either undiagnosed or diagnosed prediabetes or diabetes (1). In addition, the US population is aging, which will further increase the incidence of type 2 diabetes. In fact, in 2020, more than 50 million women will be in a postmenopausal state, which may predispose them to type 2 diabetes.
Large, randomized controlled trials have suggested that menopausal hormone therapy (MHT) reduces the incidence of type 2 diabetes in women (2,,,–6). Surprisingly, however, the mechanisms and clinical implications of these findings are still a matter of controversy. Since the publication in 2002 of the preliminary findings of the Women’s Health Initiative (WHI), in which an increased risk of cardiovascular events was reported, the use of MHT in US women has decreased by 80% (7), which may aggravate the burden of type 2 diabetes. The WHI, however, was conducted in predominantly older women in their 60s and 70s who were started on high doses of MHT (the conventional doses at that time). In contrast, in younger women, the net effect of MHT on all-cause mortality is neutral or even beneficial (4, 7,–9). In women without a uterus, those in the 50- to 59-year-old group had a generally favorable balance of benefits and risk while receiving conjugated estrogens alone, and a trend toward reduced mortality (4, 7,–9). Unfortunately, the results of the WHI were broadly extrapolated to all women and all MHT regimens (7).
Despite extensive work performed in rodent models on the beneficial effect of estrogen and estrogen receptor (ER) activation on glucose homeostasis and diabetes prevention (10, 11), the exact effect of menopause on glucose homeostasis in women is still unclear. This may be partially a result of the fact that basic researchers use ovariectomy in rodents as a model of menopause, whereas natural menopause in women is a more complex phenomenon that includes a progressive decline in ovarian secretion, a relative increase in androgens, chronological aging of tissues, alteration in body composition, and decreased physical activity (12). The purpose of this review is to provide an up-to-date analysis of epidemiological and clinical evidence regarding the effect of menopause and MHT on type 2 diabetes risk in women. Studies were identified following a PubMed search of reports from 1980 to 2017 using the key words “menopause” and “diabetes.” We analyze the mechanisms by which menopause and MHT affect pancreatic β-cell function and insulin sensitivity, and compare the effect of oral vs transdermal estrogen delivery as well as the influence of progestogens. Although this review focuses on studies in women, we have integrated relevant studies in animal models to better inform mechanisms of estrogen action relevant to postmenopausal women. For further reading on estrogen's molecular mechanisms of action, as derived from studies in genetic animal models, the reader should refer to recent reviews (10, 11, 13, 14). The effect of selective estrogen-receptor modulators on glucose homeostasis and diabetes in postmenopausal women has also recently been reviewed (15, 16).
Effects of Menopause on Body Composition and Energy Balance
In women, it is difficult to separate the cellular effects of the normal aging process (chronological aging) on body composition from those of menopause (ovarian aging). Cross-sectional and longitudinal studies have shown that the transition from pre- to postmenopausal status is associated with an increase in waist circumference and an increased waist-to-hip ratio, suggesting that menopause increases abdominal adiposity independently from chronological aging and total body fat. These studies have been reviewed in detail (8, 17, 18). Cross-sectional studies using more accurate measures of body composition, such as dual-energy X-ray absorptiometry (19,–21), and longitudinal studies using computed tomography scans, have confirmed that postmenopausal status is associated with a preferential increase in intraabdominal fat that is independent of age and total body fat mass (22, 23). The cause of the increased abdominal fat has been suggested to be secondary to decreased basal metabolic rate, without change in food intake. Lovejoy et al. (24) studied longitudinal changes in body composition and energy balance in perimenopausal women over a 4-year period of the menopausal transition. In that study, only women who became postmenopausal had an increase in visceral fat. In addition, physical activity decreased 2 years before menopause, and energy intake was higher before the onset of menopause. Although energy expenditure (from fat oxidation) decreased with age, the decrease in energy expenditure was greater in women who became postmenopausal compared with premenopausal controls. Thus, the onset of menopause in women is characterized by a reduction in fat oxidation and a decrease in energy expenditure, and favors an increase in total body and visceral fat, without changes in energy intake. Mechanistic studies in female rodent models can inform the mechanism of these changes in energy balance and fat distribution. Indeed, as in the case of women during the menopausal transition, the earliest detectable event following ovariectomy in female mice is a decrease in energy expenditure without alteration in energy intake (25). Recent studies derived from genetically modified female mice suggest that the menopausal decrease in energy expenditure results from loss of 17β-estradiol (E2) activation of its main receptor, the estrogen receptor α (ERα, a product of the ESR1 gene) (26). Decreased E2 activation of ERα in neurons of the ventromedial nucleus of the hypothalamus (VMH) impairs the ability of the sympathetic nervous system to regulate adipose tissue distribution, which favors visceral fat accumulation (27). In addition, the menopausal decrease of ERα activation in VMH neurons also decreases sympathetic nervous system activation of brown adipose tissue thermogenesis, thus limiting energy expenditure (27,–29).
Aside from changes in fat mass and fat distribution, menopause is also associated with decreased lean body mass (21). Skeletal muscle mass is a major contributor to whole-body insulin sensitivity (30). Together, increased visceral fat and decreased lean mass contribute to impair insulin sensitivity. Therefore, these changes in body composition that produce insulin resistance are risk factors that predispose women to type 2 diabetes after menopause, independent of E2 deficiency.
Effect of Menopause on Glucose Homeostasis and Diabetes
The exact effect of menopause on glucose homeostasis in women, independent from chronological aging, has been reviewed extensively and is still controversial (18, 31, 32). For example, the Study of Women's Health Across the Nation suggested that the alteration in glucose homeostasis that is observed around menopause is related to chronological aging rather than ovarian menopause itself (33, 34). However, a follow-up of the same study concluded that lower premenopausal E2 levels during the early menopausal transition were associated with 47% higher risk of developing diabetes, which is consistent with a role of ovarian aging (35). In addition, the EPIC-InterAct study, a prospective case-cohort study with a follow-up of 11 years, concluded that early menopause before the age of 40 years (which leads to more prolonged E2 deficiency) is associated with a 32% greater risk of type 2 diabetes compared with menopause that occurs at age 50 to 54 years (36). Similarly, an observational study in 16,299 Chinese women reported that early menopausal age (≤45 years) is associated with a 20% increased risk of diabetes compared with the average menopausal age of 49.5 years (37). In addition, longitudinal studies in women with surgical menopause by ovariectomy (which leads to rapid and severe E2 deficiency) also reported an increased risk of diabetes (38). In the National Health and Nutrition Examination Survey I Epidemiologic Followup Study, women who underwent a bilateral ovariectomy with a follow-up period of 9 years exhibited a 57% increased risk of diabetes compared with women with natural menopause (39). Finally, a recent prospective cohort analysis of 124,379 postmenopausal women from the WHI concluded that cumulative endogenous estrogen exposure (the difference between the age of menarche and the final menstrual period) also influenced the risk of type 2 diabetes. After adjustment for age, women with shortest (<30 years) reproductive periods had a 37% greater risk of developing type 2 diabetes, whereas women with the longest (≥45 years) reproductive periods had a 23% higher risk than women with medium-length reproductive periods (36-40 years) (40). Therefore, the preponderance of evidence argues for a role of menopausal E2 deficiency in the increased risk of type 2 diabetes. However, an increased cumulative E2 exposure may also predispose to type 2 diabetes. Here, we will focus on menopausal alterations that directly alter glucose homeostasis.
Effect of menopause on insulin resistance
Unfortunately, studies using accurate measures of glucose homeostasis to assess the direct effect of menopause on insulin resistance, independent of adiposity, are limited. Using the intravenous glucose tolerance test (IVGTT), a small study found that insulin resistance was present in only half of the postmenopausal women tested compared with premenopausal women (41). This study, however, was not adjusted for age and body mass index (BMI). In contrast, using the IVGTT in a larger cohort and after adjustment for age and BMI, Walton et al. (42) observed a 30% decrease in noninsulin-dependent glucose disposal (glucose effectiveness) in postmenopausal compared with premenopausal women, whereas insulin sensitivity was actually increased by 50%. Plasma C-peptide response and pancreatic insulin secretion were markedly lower in the postmenopausal group. However, the rate of insulin elimination was also lower in these women. As a result, plasma insulin concentrations during the IVGTT were not significantly different between the two groups. Thus, the impact of menopause may relate to changes in insulin metabolism—possibly, changes in insulin clearance in the liver. In two additional studies using the euglycemic, hyperinsulinemic clamp, which is the gold standard to assess insulin action, investigators found no difference in insulin action between pre- and early postmenopausal women of similar age after adjustment for fat-free mass (43, 44). Therefore, available evidence suggests that menopause alters aspects of glucose homeostasis, such as glucose effectiveness (the ability of glucose to promote its own disposal in an insulin-independent manner) during the IVGTT. However, this is not detected in the steady-state conditions of the euglycemic, hyperinsulinemic clamp. This issue, and the limitations of the euglycemic, hyperinsulinemic clamp to detect clinically relevant alterations in glucose homeostasis, will be discussed in detail in the section on MHT improvement in insulin sensitivity.
“The preponderance of the evidence argues for a role of menopausal 17β-estradiol deficiency in the increased risk of type 2 diabetes.”
What can we learn from animal models about the role of menopause in predisposing to insulin resistance? First, insulin resistance is readily detectable in ovariectomized mice (45,,–48). Observations in genetic mouse models are consistent with the concept that decreased E2 action via ERα is the predominant mechanism that produces insulin resistance after menopause (49, 50). In skeletal muscle, decreased ERα action may alter mitochondrial fission, decreasing mitochondrial fatty acid oxidation and oxygen consumption and resulting in oxidative stress and insulin resistance (51). In liver, decreased ERα activation allows hyperinsulinemia (derived from muscle insulin resistance) to promote liver triglyceride deposition, and fails to suppress liver triglyceride export, which results in hepatic steatosis and insulin resistance (47). Finally, the decrease in ERα action in macrophages (52) and adipose tissue (53) also contributes to inflammation, insulin resistance, and atherosclerosis.
Effect of menopause on insulin secretion
Studies of the effect of menopause on insulin secretion in women are scarce. As discussed, data from Walton et al. (42) suggest that menopause alters pancreatic insulin secretion. However, because hepatic insulin clearance was lower in postmenopausal women (less insulin is taken up by the liver), plasma insulin concentrations during the IVGTT were unchanged compared with those in premenopausal women. This suggests that menopause alters insulin secretion in ways that are not detected by standard clinical measurement of glucose and insulin levels and are revealed only during dynamic testing. In rodents, surgical menopause by ovariectomy impairs pancreatic insulin secretion. In various rodent models with genetic defects that primarily affect the insulin-producing islet β cells of the pancreas, ovariectomy aggravates the function of β cells or even precipitates β-cell failure in mice (10, 54,,,–58). The mechanisms of E2 protection of islet β-cell function and insulin secretion in premenopausal women can be extrapolated from genetically modified female mice and have been reviewed recently (10, 14). In postmenopausal women, decreased E2 action via ERα and ERβ impair islet β-cell survival and secretion, respectively. However, the menopausal decrease in E2 action mainly via ERα seems important in predisposing the β cells to metabolic injuries that are exacerbated by aging and menopause (59,–61). Given the importance of pancreatic β-cell function in the regulation of glucose metabolism and the prevention of diabetes, even in the setting of insulin resistance (62,–64), further work is needed to clarify the impact of menopause on islet function in women. Changes in insulin clearance and metabolism make such an assessment particularly difficult to interpret.
“Transdermal 17β-estradiol administration allows for a more physiological delivery of hormone into the circulation.”
Intracrinology of the menopause and glucose homeostasis
As discussed, the diabetogenic effect of menopausal estrogen deficiency in women is not as clinically apparent as would be expected from rodent studies. In postmenopausal women, the main female hormone E2 is synthesized in extragonadal sites such as breast, brain, muscle, bone, and adipose tissue, in which E2 acts locally as a paracrine or intracrine factor (65,–67). Thus, in postmenopausal women, E2 peripheral action depends on its biosynthesis from a circulating source of adrenal androgens. In contrast, in ovariectomized rodents, the circulating source of ovarian androgens is suppressed and, unlike in humans, the adrenal gland does not produce androgens (68), leading to severe cellular estrogen deficiency. This explains why in postmenopausal women, the cellular effect of the loss of ovarian E2 production is less pronounced than that resulting from ovariectomy in rodents. In fact, and consistent with the importance of endogenous E2 in reducing the risk of diabetes in women, the EPIC-InterAct study, a prospective case-cohort study with a follow-up of 11 years, concluded that early menopause, which leads to more prolonged E2 deficiency, is associated with a greater risk of type 2 diabetes (36).
The importance of endogenous estrogens to glucose homeostasis in women can be further inferred from alterations in glucose homeostasis that are induced by total estrogen deficiency in men. Men with inactivating mutations of the CYP19 gene, which codes for the aromatase, have no circulating estrogen and develop insulin resistance, glucose intolerance, and even type 2 diabetes (69,–71). In men, these alterations are reversed by estrogen therapy. Interestingly, studies have reported that in untreated postmenopausal women, higher plasma levels of E2 were strongly and prospectively associated with an increased risk of type 2 diabetes, independent of BMI (72,–74). Given that circulating levels of E2 do not reflect E2 action in target cells in postmenopausal women, the increased E2 may represent an indirect biomarker of a pathological process that predisposes to type 2 diabetes (75). The effect of menopausal estrogen deficiency on type 2 diabetes risk will be further discussed in relation to its reversal by MHT.
Effect of MHT on Diabetic Risk and Glucose Control
Women without diabetes
Available studies have not primarily been designed to address the effect of MHT on diabetes prevention as a primary end point. Therefore, the existing data are not optimal to adequately assess the effect of MHT on type 2 diabetes prevention. In a meta-analysis by Salpeter et al. (6) of 107 randomized trials comparing MHT to placebo or no treatment in women without diabetes, MHT was associated with a reduction in fasting glucose and fasting insulin that led to a 13% drop in insulin resistance, as calculated using the Homeostatic Model Assessment of Insulin Resistance (HOMA-IR) (76). This was associated with an estimated reduction of 30% in new-onset diabetes. If we look more closely at the most relevant trials, the results are also in favor of an antidiabetic effect of MHT (Table 1). Thus, the Postmenopausal Estrogen/Progestin Interventions study was the first large, randomized, placebo-controlled trial (RCT) to evaluate the effect of MHT [conjugated equine estrogens (CEs), with or without progestogen] on diabetes incidence in postmenopausal women. After three years of follow-up, MHT produced a marked decrease in fasting glucose and insulin levels, which suggested improved insulin sensitivity (2). The Heart and Estrogen/Progestin Replacement Study (HERS) further advanced our understanding by examining the incidence of diabetes in postmenopausal women with coronary artery disease assigned to MHT or to placebo (3). Over four years, the incidence of diabetes was reduced by 35% in the MHT group compared with the placebo group. This antidiabetic effect was mainly due to the fact that women receiving MHT maintained a lower fasting glucose level than women in the placebo group. The WHI Estrogen Plus Progestin Trial provides the most recent data from a large RCT of postmenopausal women who were free of diabetes at baseline (5). The WHI looked at self-reports of incident diabetes that was treated with oral agents or insulin. One year into the trial, the active treatment group showed lower fasting glucose and insulin and decreased HOMA-IR compared with the placebo group. After an average of 5.6 years of follow-up, there was a 19% to 21% relative reduction in incident-treated diabetes (4, 5). In HERS and WHI, a postrandom-assignment adjustment revealed that the antidiabetic effects of MHT were independent from the reduction in BMI, suggesting that MHT has a direct beneficial impact on glucose homeostasis, independent from reduction in fat mass (Fig. 1). One would expect the antidiabetic effect of CE alone (without progestogen) to decrease diabetes risk even further, given that in most RCTs, the beneficial effects of estrogen on metabolism were attenuated by the addition of a progestogen (6, 88). However, in the WHI, among women using CE alone, the protective effect of CE on diabetes risk was slightly less pronounced (Table 1) compared with the combination of CE with progestogen [medroxyprogesterone acetate (MPA)] (4, 87), an effect that probably reflects different subject populations between the two studies. In any case, consistent with the efficacy of CE therapy in reducing the risk of diabetes, in the extended postintervention period—a 13-year follow-up of the two WHI trials—the diabetes risk reductions dissipated (4). These RCTs confirm results from large observational studies such as the Nurses’ Health Study, in which current users of MHT showed a 20% reduced incidence of diabetes compared with past users and women who had never used MHT, after adjustment for age and BMI (80) (Table 1). Also of interest is the prospective French cohort of the Étude Épidémiologique de Femmes de la Mutuelle Générale de l’Education Nationale (E3N), one of the largest observational studies in postmenopausal women (81). The overall incidence of self-reported diabetes during a 10-year follow-up was 25% lower among MHT users after adjustment for BMI than among women who had never used MHT. Furthermore, a cohort study of early postmenopausal women revealed a 69% reduction in the incidence of diabetes in women who received MHT, compared with nonusers (82). Studies in female rodents have confirmed that CE and E2 treatment prevent diabetes development following ovariectomy (10, 11, 58). Obviously, a large RCT that addresses the effect of MHT on diabetes prevention as a primary end point would be needed to draw a definitive conclusion.
Effect of MHT on Type 2 Diabetes Risk
| Name | Design | Population | Age (y) | Treatment Length | MHT | Technique | Effecta |
|---|---|---|---|---|---|---|---|
| Women Without Diabetes | |||||||
| PEPI (2) | RCT | 788 | 45–64 | 3 y | CE 0.625 mg ± progestin | FG, fasting insulin | IR ↓ |
| HERS (3) | RCT | 2029 | 67 ± 7 | 4.1 y | CE 0.625 mg/MPA 2.5 mg | Incident diabetes FG | Diabetes ↓ 35% |
| WHI (4, 5, 87) | RCT | 15,641 | 50–79 | 5.6 y | CE 0.625 mg/MPA 2.5 mg | Self-report | Diabetes ↓ 19%–21% |
| 10,739 | 50–79 | 7.1 y | CE 0.625 mg | Self-report | Diabetes ↓ 12%–14% | ||
| KEEPS (77) | RCT | 727 | 42–58 | 4 y | CE 0.45 mg/o-P4 200 mg | HOMA-IR | IR ↓ |
| t-E2 50 µg/o-P4 200 mg | HOMA-IR | IR ↓ (ns) | |||||
| Lobo (78) | RCT | 745 | 40–65 | 1 y | CE 0.625 mg/MPA 2.5 mg | FG, OGTT | FG ↓, PG ↑ |
| CE 0.45 mg/MPA 1.5 mg | FG, OGTT | FG ↓, PG ↑ | |||||
| CE 0.3 mg/MPA 1.5 mg | FG, OGTT | FG ←→ PG ←→ | |||||
| Hodis (79) | RCT | 222 | 45+ | 2 y | o-E2 1 mg | HbA1c | HbA1c ↓ 2.4% |
| Salpeter (6) | Meta-analysis | 33,315 | 60 ± 6 | 0.15–5 y | Variable | IR ↓ 13% | |
| RCTs | HOMA-IR | Diabetes ↓ 30% | |||||
| NHS (80) | OS | 21,028 | 30–55 | 12 y | Variable | Self report record | Diabetes ↓ 20% |
| E3N (81) | OS | 63,624 | 40–65 | 10 y | Variable | Self report record | Diabetes ↓ 25% |
| RBS (31) | OS | 785 | 50–97 | 8 y | Variable | FG | FG ↓ |
| Pentti (82) | OS | 8483 | 52–62 | 5 y | Variable | Record | Diabetes ↓ 69% |
| Xu (83) | Meta-analysis | 16,807 | 49–70 | 5–12 y | Variable | HbA1c, FG | FG ↓, HbA1c ↓ |
| Women With Type 2 Diabetes | |||||||
| Friday (84) | RCT | 25 | 50–77 | 8 wk | CE 0.625 mg | HbA1c | HbA1c ↓ |
| FG and insulin | IR ↓ | ||||||
| Anderson (85) | RCT | 27 | 40–65 | 3 mo | o-E2 2 mg | HbA1c | HbA1c ↓ |
| FG and insulin | IR ↓ | ||||||
| Brussaard (86) | RCT | 40 | 61 ± 5 | 6 wk | o-E2 2 mg | HbA1c, euglycemic, hyperinsulinemic clamp | HbA1c ↓ |
| HGP ↓ | |||||||
| Salpeter (6) | Meta-analysis RCTs | 33,315 | 60 ± 6 | 0.15–5 y | Variable | HOMA-IR | IR ↓ 33% |
Abbreviations: FG, fasting glucose; GTT, glucose tolerance test; IR, insulin resistance; NHS, Nurses’ Health Study; ns, nonsignificant; o-E2, oral micronized E2; o-P4, oral micronized progesterone; OS, observational study; PEPI, Postmenopausal Estrogen/Progestin Interventions study; PG, postchallenge glucose; RBS, Rancho Bernardo Study; t-E2, transdermal E2.
In the Effect column, up and down arrows indicate increase and decrease, respectively.
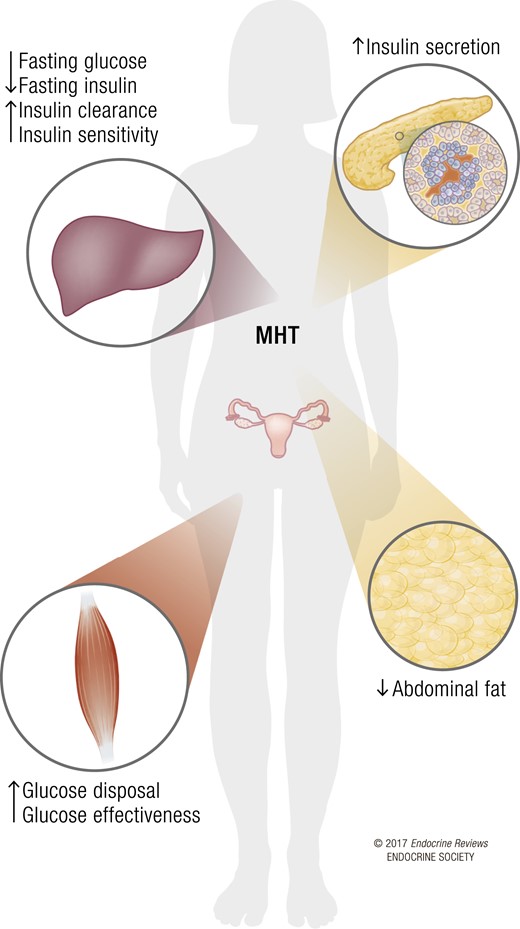
Effects of MHT on glucose homeostasis. The weight of evidence argues for a beneficial role of MHT on pancreatic β cells, skeletal muscle, liver, and adipose tissue in postmenopausal women. This is associated with decreased abdominal fat, decreased fasting glucose and insulin, improved glucose effectiveness and insulin sensitivity, and a reduced incidence of diabetes.
In the Postmenopausal Estrogen/Progestin Interventions trial, MHT decreased fasting glucose but also increased postchallenge glucose concentrations (2). The association of MHT with increased postchallenge glucose concentrations despite decreased fasting glucose was also observed in healthy postmenopausal women in a substudy of the Women’s Health, Osteoporosis, Progestin, Estrogen RCT trial (78), and cross-sectionally in nondiabetic women of the Rancho Bernardo Study (89). Because this effect on postchallenge glucose is observed whether or not a progestogen is taken, it is likely due to CE. However, this slight impairment in glucose tolerance does not seem to alter chronic glycemic control, given that the major RCTs have reported that MHT was associated with both a decreased incidence of self-reported, treated diabetes (3, 5, 6) and a decrease in glycosylated hemoglobin (HbA1c) (79, 83). Table 1 summarizes studies that have investigated the effect of MHT on diabetes risk in women without diabetes.
Women with diabetes
MHT has also been shown to improve glycemic control in diabetic postmenopausal women (Table 1). In the meta-analysis by Salpeter et al. (6), MHT reduced the HOMA-IR in women with diabetes by an average of 36%, a greater reduction than that observed in postmenopausal women without known diabetes. However, the meta-analysis did not take into account changes in diabetes treatment, making the evaluation of change in HOMA-IR unreliable. In HERS, 27% of women were classified as diabetic, and although the study was not powered to detect significant differences, the trend was consistent with a beneficial effect of MHT on fasting glucose in diabetic women (3). In two placebo-controlled, randomized, cross-over trials of oral CE or E2 treatment in postmenopausal women with type 2 diabetes, estrogens reduced fasting glucose, HbA1c, and insulin resistance without affecting postprandial glycemia (84, 85). Similarly, in an RCT of oral E2 in postmenopausal women with type 2 diabetes, E2 produced a decrease in HbA1c (86) and significantly increased insulin suppression of hepatic glucose production (HGP). A small trial also reported a beneficial effect of several MHT regimens on glucose homeostasis in diabetic postmenopausal women (90). It should be noted, however, that these studies in diabetic postmenopausal women had fewer subjects, used estrogens alone, and were performed over a shorter duration of time than studies in women without diabetes. Results of studies in rodents are in agreement with the concept that therapeutic doses of estrogens improve glycemic control; this was observed in diabetic female rodents following ovariectomy (11). Therefore, the evidence is consistent with a beneficial effect of MHT on glycemic control in diabetic women, as summarized in Table 1.
Comparison of Oral and Transdermal Estrogen Delivery
Large RCTs relating to MHT and diabetes risk have primarily assessed CE with MPA, and only limited data are available for other forms of MHT. CE is prepared from the urine of pregnant mares and is composed of at least 10 different estrogens with unique estrogen-receptor affinities and potencies, among which E2 represents less than 1% (91). Although CE is only available in oral tablets, E2 is available for either oral or transdermal delivery. Therapeutic equivalence between estrogens has been established with respect to suppression of follicle-stimulating hormone (0.625 mg CE = 1 mg micronized E2 = 50 μg transdermal E2 = 5 μg ethinyl estradiol) (92). In contrast to orally administered estrogens, transdermal E2 delivery avoids first-pass liver metabolism, thereby resulting in more stable systemic E2 levels without supraphysiological liver exposure to estrogens (93, 94). Treatment with transdermal E2 also results in higher systemic E2 levels than corresponding doses of oral CE, thereby allowing for higher exposure of nonhepatic tissues. Thus, transdermal E2 administration allows for a more physiological delivery of hormone into the circulation (95), without the side effects of oral CE therapy on hepatic synthesis of triglycerides, clotting factors, and inflammatory markers (96). In contrast, because of first-pass liver metabolism, oral CE promotes a stronger reduction in the ratio of low-density to high-density lipoprotein cholesterol (6, 8, 97). In addition, oral estrogen therapy and CE, in particular, results in a stronger beneficial effect on insulin resistance (as assessed by HOMA-IR) than does transdermal E2 delivery (6). The stronger effect of oral therapy on blood glucose probably results from the first-pass liver metabolism leading to a better suppression of HGP (11). Similarly, in the French E3N cohort, the decreased risk of new-onset diabetes was stronger for estrogen administered orally rather than through the skin, even after adjustment for BMI (81). Surprisingly, in the Kronos Early Estrogen Prevention Study (KEEPS), an RCT to assess the effects of early initiation of oral or transdermal MHT vs placebo on rates of progression of atherosclerosis in postmenopausal women, serum insulin and the HOMA-IR score decreased significantly with transdermal E2 (50 μg), but not with oral CE (0.45 mg) (77). Although KEEPS is the largest and longest trial to compare oral vs transdermal estrogen delivery and placebo, lower doses of oral CE (0.45 mg) were used compared with the doses used in the HERS and WHI studies (0.625 mg). Because the beneficial effects of estrogen (and CE, in particular) on metabolism are dose dependent (6), one potential explanation is that in KEEPS, the CE dose was too low to produce an effect on insulin resistance. A closer look at the data reveals that HOMA-IR results were not different between the transdermal E2 and oral CE treatment groups, and that oral CE had a slight effect on HOMA-IR that did not reach significance because of insufficient power. In fact, in a substudy of the Women’s Health, Osteoporosis, Progestin, Estrogen RCT trial, the authors reported improved fasting glucose and insulin with a CE dose similar to that used in KEEPS (0.45 mg) (78). Moreover, there seems to be a bimodal effect of CE on blood glucose; the lower dose of 0.3 to 0.625 mg showed improvement, but deterioration of glucose homeostasis was observed with the higher dose of 1.25 mg (98). In summary, both oral and transdermal E2 can lower blood glucose and improve insulin sensitivity, although oral CE demonstrates the more powerful effect at equivalent doses. Figure 2 summarizes the effect of oral compared with transdermal estrogen delivery on metabolism.
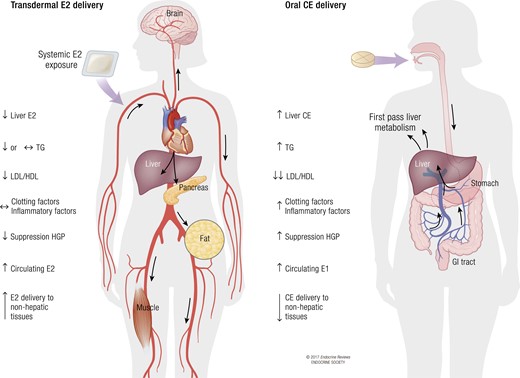
Comparison of transdermal E2 and oral CE delivery. Transdermal E2 delivery provides the ability to administer unmetabolized E2, at lower doses, directly to the blood stream, with enhanced delivery to nonhepatic tissues and with minimal stimulation of hepatic protein production, but lower suppression of HGP and the low-density lipoprotein (LDL)/high-density lipoprotein (HDL) cholesterol ratio compared with oral estrogen delivery. In contrast, oral estrogen (CE or E2) delivery leads to first-pass hepatic metabolism and necessitates higher doses of estrogen to achieve efficient delivery to nonhepatic tissues. Oral estrogen delivery also leads to increased hepatic production of coagulation and inflammatory factors, but better suppression of HGP and the LDL/HDL cholesterol ratio than oral delivery. TG, triglycerides.
Effect of Progestogens on Glucose and Insulin Metabolism
Progestogens have historically been associated with the development of insulin resistance in nonhuman primates (99). In most RCTs of MHT, the beneficial effects of estrogen on metabolism were attenuated by the addition of a progestogen (6). MPA is known to have glucocorticoid activity, and blunts the beneficial effect of oral or transdermal E2 on insulin resistance (88, 100). Testosterone-derived progestogens such as levonorgestrel may also increase insulin resistance (101). In contrast, nonandrogenic progestogens are more neutral for glucose homeostasis. For example, transdermal therapy with norethisterone acetate (NETA) in combination with E2 seems to be neutral (101). Oral administration of low doses of NETA (0.5 mg) does not impair insulin sensitivity in healthy postmenopausal women (102). However, NETA given orally at higher doses (1 mg) may reverse the improved insulin sensitivity that is provided by oral E2 (103). Dydrogesterone shows a neutral effect when added to CE (104) or E2 (105). Thus, MPA and levonorgestrel are more likely to be associated with attenuation of the beneficial effect of estrogen on glucose homeostasis, whereas NETA and dydrogesterone are more likely to be neutral. With most progestogens, the reversal of the beneficial effect of E2 or CE is dose dependent.
Mechanisms of Antidiabetic Actions of MHT
Most studies suggest that MHT decreases abdominal fat deposition (8) and that this contributes to MHT’s antidiabetic action. However, in the HERS and WHI trials, the diabetes prevention observed in women assigned to MHT was independent from the observed reduction in BMI and waist circumference (3, 5). Similar observations were made in large observational studies such as the Nurses’ Health Study and E3N (80, 81). Therefore, available evidence suggests that estrogens improve glucose homeostasis by acting directly on ERs in liver and skeletal muscle (or adipose tissue) to improve insulin sensitivity, or on ERs in pancreatic islets to improve insulin secretion (Fig. 1), as can be observed in rodent models (10, 14). It should be emphasized that the oral or transdermal administration of CE or E2 does not mimic the cyclical ovariansecretion of E2. Thus, the antidiabetic effect of MHT may involve mechanisms that are similar to or different than those of endogenous E2 and are not necessarily mirroring the defects observed during menopause.
Effect of MHT on energy balance and adipose tissue mass
Most long-term studies concluded that MHT increases lean body mass and reduces abdominal fat deposition (6, 8). Most importantly, large RCTs conducted over a three-year period confirmed that MHT decreases total and intraabdominal fat in women assigned to CE alone or CE/MPA (106, 107). The exact mechanism by which MHT decreases abdominal fat is still unclear. Observations from studies in ovariectomized female mice are consistent with the concept that therapeutic doses of E2 or CE decrease fat mass mainly by increasing lipid oxidation and enhancing energy expenditure, without effect on food intake (48). This is consistent with the role of ERα in VMH neurons (described previously) in increasing energy expenditure (27,–29). Unfortunately, mechanistic studies exploring the effect of estrogens on energy expenditure in postmenopausal women are scarce. Studies investigating the effect of transdermal E2 (50 µg with or without a progestogen) for a duration of three months to one year are consistent with rodent studies and reported an E2-induced increase in lipid oxidation along with enhanced energy expenditure and thermogenesis (108, 109). In contrast, and surprisingly, studies addressing the effect of unopposed CE (0.625 to 1.25 mg) in postmenopausal women reported a decrease in lipid oxidation and energy expenditure associated with an increased fat mass (110, 111). This short-term effect of CE on lipid oxidation is in contrast with the long-term RCTs described previously that have shown that CE decreases fat mass (6, 8, 106, 107). The dose of oral CE was too high in one of these studies, and first-pass liver metabolism could have suppressed lipid oxidation and resulted in an increase in total body fat (110, 112). Alternatively, the acute lipogenic effects of oral CE may be offset over time by beneficial effects of CE on energy expenditure, as has been observed in animal models. Further studies are needed to understand both the acute and chronic effects of MHT on substrate partitioning and fat distribution.
MHT improvement in insulin sensitivity
The meta-analysis by Salpeter (6) suggested that MHT leads to an improvement in insulin sensitivity on the basis of the HOMA-IR in women with and without diabetes. However, in contrast with this finding, studies that have assessed the effect of MHT using an accurate measure of insulin action during a euglycemic, hyperinsulinemic clamp have, surprisingly, provided conflicting results (Table 2). For example, in a small RCT of healthy women with surgically induced menopause, transdermal E2 and oral NETA had no effect on systemic insulin action (113). Similarly, in an RCT of healthy postmenopausal women who were randomly assigned to treatment with either oral E2 or placebo, MHT provided no improvement in insulin action (114). Furthermore, an RCT of normal-weight postmenopausal women showed that a two-year MHT with CE/MPA decreased peripheral insulin sensitivity with no change in endogenous glucose production at 6 months and 24 months (115). Systemic insulin action was restored after discontinuation of treatment. Therefore, most studies using the euglycemic, hyperinsulinemic clamp show no beneficial effect on systemic insulin action, and as a result, an executive summary for the Endocrine Society concluded that MHT-related improvement in glucose homeostasis is independent from improvement in insulin sensitivity (8). However, the observation that RCTs studying the effect of MHT show no improvement in systemic insulin action using the euglycemic, hyperinsulinemic clamp are in striking contrast with large RCTs showing an improvement in HOMA-IR and a prevention of diabetes (Table 2). There are several potential explanations to reconcile these discrepancies.
“It is likely that estrogen therapy also has beneficial effects of islet β-cell function and insulin secretion in postmenopausal women.”
Mechanism of MHT Antidiabetic Actions
| Name | Design | Size (n) | Age (y) | Length | MHT | Technique | Effect |
|---|---|---|---|---|---|---|---|
| Insulin Sensitivity | |||||||
| Salpeter (6) | Meta- analysis | 33,315 | 60 ± 6 | 0.15–5 y | Variable | HOMA-IR | IR ↓ 13% |
| Duncan (113) | RCT | 22 | 35–50 | 6 wk | t-E2 50 µg | Euglycemic, hyperinsulinemic clamp | GDR ←→ |
| Mattiasson (114) | RCT | 51 | 52–53 | 3 mo | o-E2 2 mg | Euglycemic, hyperinsulinemic clamp | GDR ←→ |
| Sites (115) | RCT | 76 | 52 ± 4 | 1 y | CE 0.625 mg/MPA 2.5 mg | Euglycemic, hyperinsulinemic clamp | GDR ↓ |
| HGP ←→ | |||||||
| Pereira (117) | RCT | 22 | 56 ± 4 | 1 wk | t-E2 50 µg | Euglycemic, hyperinsulinemic clamp | GDR ↑ |
| 24 | 63 ± 3 | 1 wk | t-E2 50 µg | Euglycemic, hyperinsulinemic clamp | GDR ↓ | ||
| Cucinelli (118) | NRT | 21 | 46–58 | 24 wk | t-E2 50 µg/dydrogesterone 10 mg | Euglycemic, hyperinsulinemic clamp, OGTT | GDR ←→ |
| IR ↓ | |||||||
| Li (119) | RCT | 120 | 45–65 | 1 y | o-E2 1 mg/NETA 0.5 mg | OGTT, fasting glucose, insulin | R ↓, AUC ↓ |
| Van Pelt (116) | NRT | 11 | 50–62 | 24 h | t-E2 150 µg | Hyperglycemic clamp | GDR ↑ |
| Insulin Secretion | |||||||
| Godsland (101) | RT | 30 | 56 ± 5 | 18 mo | CE 0.625 mg/levonorgestrel 75 µg | IVGTT | GSIS ↑, HIC ↑ |
| 31 | 56 ± 5 | 18 mo | t-E2 50 µg/NETA 0.25 mg (seq) | IVGTT | GSI ←→ HIC ←→ | ||
| Spencer (103) | RT | 19 | 57 ± 5 | 48 wk | o-E2 2 mg/NETA 1 mg (seq) | IVGTT | ↑ GSIS, ↑ HIC |
| 23 | 56 ± 4 | 48 wk | t-E2 50 µg/NETA 1 mg (seq) | IVGTT | ↑ GSIS, ↑ HIC | ||
| Cagnacci (120) | NRT | 15 | 53 ± 2 | 3 mo | t-E2 50 µg | OGTT | ↑ GSIS, ↑ HIC |
| 15 | 53 ± 2 | 3 mo | CE 0.625 mg | OGTT | ←→ GSIS ←→ HIC | ||
| Godsland (121) | RT | 15 | 40–65 | 24 mo | o-E2 1 mg/dydrogesterone 5–10 mg (seq) | IVGTT | ↑ GSIS,↑ HIC |
| 9 | 40–65 | 24 mo | o-E2 2 mg/dydrogesterone 10–20 mg (seq) | IVGTT | ↑ GSIS, ↑ HIC | ||
| Paoletti (122) | RT | 10 | 53 ± 2 | 12 mo | o-E2 2 mg /levonorgestrel 75 µg | OGTT | ←→ GSIS, ←→ HIC |
| 10 | 53 ± 2 | 12 mo | t-E2 50 µg /levonorgestrel 20 µg | OGTT | GSIS, ↑ HIC | ||
| Cucinelli (118) | NRT | 21 | 46-58 | 24 wk | t-E2 50 µg/dydrogesterone 10 mg (seq) | OGTT | GSIS ↑, HIC ↑ |
Abbreviations: AUC, area under the curve for glucose during OGTT; GDR, glucose disposal rate; GSIS, glucose-stimulated insulin secretion; HIC, hepatic insulin clearance; NRT, nonrandomized trial; RT, randomized trial; Seq, sequential.
In the Effect column, up and down arrows indicate increase and decrease, respectively.
First, euglycemic, hyperinsulinemic clamp studies were not designed to assess the “window of opportunity” of MHT, and there was large age variability in most studies. For example, in the WHI, a large RCT, the incidence of diabetes tended to be lower in younger, early postmenopausal women (50 to 69 years old) and higher in older, late postmenopausal women (70 to 79 years old) who were randomly assigned to MHT compared with placebo (6). Consistent with this possibility, in one study using a hyperglycemic clamp, a longer time since menopause was associated with a reduced effect of E2 on glucose uptake (116). Recently, Pereira et al. (117) addressed the issue of a window of opportunity in a randomized crossover study comparing the effect of one week of transdermal E2 vs placebo in early postmenopausal women (<6 years since final menses) compared with late postmenopausal (>10 years since last menses), using the euglycemic, hyperinsulinemic clamp. They observed that E2 increased insulin action in early postmenopausal women but decreased it in late postmenopausal women. This suggests that the beneficial effect of E2 on insulin sensitivity is dependent on time since the onset of menopause.
Second, and more importantly, estrogens may improve glucose homeostasis independently of systemic insulin action, as measured by the euglycemic, hyperinsulinemic clamp. An important paradigm to consider is that under the hyperinsulinemic conditions of the clamp, the infused glucose is driven preferentially into skeletal muscle, and only the insulin-dependent fraction of glucose uptake is explored (123,,–126). Therefore, the clamp explores a limited component of glucose homeostasis. Noninsulin-dependent glucose uptake or glucose effectiveness is critical to glucose homeostasis and is not detected by euglycemic, hyperinsulinemic clamp studies. When comparing the oral glucose tolerance test (OGTT), a less accurate but more physiological measure of glucose homeostasis and insulin sensitivity, to the euglycemic, hyperinsulinemic clamp, Cucinelli et al. (118) observed that treatment with transdermal E2 ameliorated the hyperinsulinemia during the OGTT, suggesting improved insulin sensitivity. In contrast, the use of the clamp in the same study of the same women showed no effect on systemic insulin action. In addition, an RCT of women assigned to oral E2/NETA vs placebo showed that MHT decreased fasting glucose and fasting insulin and improved the response to an oral glucose load (119). The improvement of glucose homeostasis during a glucose load without an increase in insulin secretion suggests an improvement in glucose effectiveness (127). Furthermore, in one study using the hyperglycemic clamp—a technique that involves controlled hyperglycemia without steady-state insulin infusion (128)—E2 was shown to increase glucose uptake in the absence of changes in insulin secretion (116). An increase in glucose uptake during the hyperglycemic clamp is also compatible with an effect of E2 in increasing glucose effectiveness (127). Taken together, these observations may explain why Walton et al. (42) observed a 30% decrease in noninsulin-dependent glucose disposal (glucose effectiveness) in postmenopausal women, whereas systemic insulin action was increased (probably as a compensation). This is also consistent with the decreased systemic insulin action measured by clamp that was observed in postmenopausal women assigned to MHT (69).
Finally, large RCTs suggest that MHT reduces the incidence of diabetes by preventing the increase in fasting glucose and insulin levels. Because fasting hyperglycemia is believed to result from unsuppressed HGP (129), this suggests that MHT promotes a better suppression of HGP. Results of studies performed in ovariectomized female mice in nonsteady-state conditions are also consistent with the concept that CE decreases HGP (48). Studies assessing the effect of E2 or CE on insulin sensitivity using the euglycemic clamp in ovariectomized female mice have been more consistent than clinical studies in showing an improvement in systemic insulin action (45,,–48) due to an increase in insulin-stimulated glucose uptake in skeletal muscle and a better insulin suppression of HGP (48). Study results derived from genetically modified mice argue that MHT with CE and E2 prevents insulin resistance in postmenopausal women mainly via ERα activation in liver, skeletal muscle, and adipose tissue (45, 47,–49).
In summary, evidence suggests that estrogen therapy improves glucose homeostasis and reduces the risk of type 2 diabetes in women by enhancing noninsulin-dependent glucose disposal or glucose effectiveness and promoting a better suppression of HGP in ways that are not detected using the steady-state condition of the euglycemic, hyperinsulinemic clamp. However, such an improvement in glucose effectiveness improves insulin sensitivity, as assessed using clinically relevant indices like the HOMA-IR and the OGTT. New studies are needed to unravel the insulin-dependent and independent mechanisms of action of MHT in women.
MHT improvement in insulin secretion
The beneficial effect of estrogen therapy on pancreatic β-cell function is of great interest (10, 14, 130). In rodents, estrogens promote islet survival and maintain islet function in the presence of multiple proapoptotic insults (10, 14). Importantly, treatment with estrogens protects cultured human islet survival and function in the presence of diabetic injuries such as proinflammatory cytokines, oxidative stress, high glucose, and lipotoxicity (59, 131, 132). E2 and agonists for ERβ can also enhance glucose-stimulated insulin secretion from cultured human islets (133). Estrogens also maintain the survival and function of human islets transplanted into immunodeficient diabetic mice in vivo (134). Given this background, it is likely that estrogen therapy also has beneficial effects on islet β-cell function and insulin secretion in postmenopausal women, a notion supported by several studies. These studies have assessed β-cell function using the IVGTT or OGTT followed by mathematical modeling of plasma glucose, insulin, and C-peptide concentrations. The measurement of plasma insulin concentrations alone is insufficient to assess pancreatic insulin secretion, because of the uptake of newly secreted insulin in the portal vein by the liver. In contrast, C-peptide is secreted with insulin in equimolar quantities but is not extracted by the liver. It is therefore possible to measure prehepatic pancreatic insulin secretion from simultaneous analysis of plasma C-peptide and insulin concentrations (135, 136). This allows quantification of the fraction of newly secreted insulin passing through the liver and not extracted. Overall, studies of β-cell function in postmenopausal women consistently show a beneficial effect of MHT that (1) increases glucose-stimulated insulin secretion, as assessed by the increased secretion of C-peptide, and (2) enhances hepatic insulin clearance (C-peptide:insulin ratio) so that the insulin levels are unchanged but liver insulin action is enhanced by insulin extraction (101, 103, 120,–122). Interestingly, in some of these studies, despite the increased insulin secretion induced by MHT, glucose tolerance was also slightly impaired (101, 121, 137). However, because the increase in insulin secretion was proportionately larger than the accompanying increase in glucose levels, this may reflect an enhancement of the β-cell sensitivity to glucose (121).
In summary, estrogen has a favorable influence in enhancing β-cell insulin secretion and in hepatic insulin clearance, which compensate for each other so that glucose homeostasis is unchanged. These effects are lost at menopause and can be restored by MHT, and transdermal E2 and oral estrogens have comparable benefits.
Conclusions, Clinical Implications, Limitations, and Future Directions
Although the underlying physiology remains unclear, RCTs suggest that MHT with estrogens may be effective in reducing the risk of type 2 diabetes in postmenopausal women. However, because of its complex balance of risks and benefits, and because the effect of MHT on diabetes prevention was not examined as a primary outcome in RCTs, MHT is neither appropriate nor FDA approved for the prevention of type 2 diabetes in women. The task force for the treatment of symptoms of menopause was appointed by the Clinical Guideline Subcommittee of the Endocrine Society and concluded that there is inadequate evidence to make a firm recommendation regarding MHT and diabetes (9). We agree, but we also believe that the risks and benefits of MHT for management of menopausal symptoms in recently menopausal women have never been more clear. The depth of knowledge of the clinical benefits and risks of estrogens, accumulated from decades of studies in preclinical models and in women, is matched for few other FDA-approved drugs. In addition, the North American Menopause Society has established a decision-making algorithm for menopause management (138) that integrates the American College of Cardiology/American Heart Association atherosclerotic cardiovascular disease (ASCVD) risk prediction score (139). Therefore, given the available evidence, our perspective regarding MHT and type 2 diabetes is the following: First, in young women without diabetes (age 50 to 59 years, and within 10 years after menopause onset) who have undergone a hysterectomy, MHT with estrogens alone may be beneficial for the prevention of coronary disease and may also reduce the incidence of type 2 diabetes. Second, in young women without diabetes who have not undergone hysterectomy, MHT using estrogens with a progestogen has neutral or beneficial coronary effects (4, 7). The available evidence argues that in these young women, MHT may reduce the incidence of type 2 diabetes. Oral or transdermal routes of estrogen delivery may be used if the 10-year risk of ASCVD is low (<5%) (9), but a nonoral route of estrogen delivery may be preferred if the 10-year risk of ASCVD is moderate (5% to 10%) (9), or in obese women, due to an increased risk of venous thromboembolic events (VTEs) (9). Third, in young women with type 2 diabetes, MHT improves glycemic control, and oral estrogens provide a stronger improvement in insulin sensitivity than does transdermal E2 at equivalent doses (6). However, type 2 diabetes is considered an ASCVD risk factor in women (140). Therefore, in normal-weight women with diabetes, an oral route of estrogen delivery should be used only if the 10-year ASCVD risk is low (9). Oral estrogens have beneficial effects on high-density and low-density lipoprotein cholesterol and may be prescribed in normal-weight women with type 2 diabetes, because they produce a stronger improvement in insulin sensitivity (6). In women with diabetes and a moderate 10-year risk of ASCVD, or/and in obese women with diabetes, transdermal E2 is preferred, along with a progestogen that is neutral on coagulation and insulin sensitivity. Transdermal E2 has more beneficial effects on inflammatory markers and triglycerides than does CE and may not increase the risk of VTEs (9). Finally, in older women (60 years of age or more than 10 years past menopause onset), MHT should only be initiated on an individual basis and after careful consideration of other risk factors.
The use of MHT improves β-cell insulin secretion, glucose effectiveness, and insulin sensitivity, as measured using clinically relevant indices like the HOMA-IR and the IVGTT/OGTT. These beneficial effects of MHT, however, are undetectable in the steady-state condition of the euglycemic, hyperinsulinemic clamp. Therefore, new physiological studies that are designed to unravel the mechanism of action of MHT on glucose homeostasis are warranted.
The challenge with estrogens is their narrow therapeutic index when used long term or for chronic disease prevention. Future therapeutic avenues lie in molecules that will provide the beneficial effect of estrogen in selected tissues (brain, bone, cardiovascular system, metabolic tissues), without the deleterious effects of estrogen on breast and uterus, without the risk of VTEs, and without the use of a progestin (16). These are critical future directions that will lay the foundation for improved therapies for menopause and diabetes.
Abbreviations:
- ASCVD
atherosclerotic cardiovascular disease
- BMI
body mass index
- CE
conjugated equine estrogen
- E2
17β-estradiol
- E3N
Étude Épidémiologique de Femmes de la Mutuelle Générale de l’Education Nationale
- ER
estrogen receptor
- ERα
estrogen receptor α
- ERβ
estrogen receptor β
- FDA
US Food and Drug Administration
- HbA1c
glycosylated hemoglobin
- HERS
Heart and Estrogen/Progestin Replacement Study
- HGP
hepatic glucose production
- HOMA-IR
Homeostatic Model Assessment of Insulin Resistance
- IVGTT
intravenous glucose tolerance test
- KEEPS
Kronos Early Estrogen Prevention Study
- MHT
menopausal hormone therapy
- MPA
medroxyprogesterone acetate
- NETA
norethisterone acetate
- OGTT
oral glucose tolerance test
- RCT
randomized, placebo-controlled trial
- VMH
ventromedial nucleus of the hypothalamus
- VTE
venous thromboembolic event
- WHI
Women’s Health Initiative.
Acknowledgments
This work was supported by grants from the National Institutes of Health (NIH) (DK074970, DK107444) and the American Diabetes Association (7-13-BS-101) as well as the Price Goldsmith-Endowed Chair at Tulane University Health Sciences Center to F.M.-J. J.E.M. is supported by funding from NIH (grants HL34594, CA138962, and HHSN268201100001C).
Author contributions: F.M.-J. researched data and wrote and reviewed the manuscript. J.E.M., J.C.S., and V.A.F. reviewed the manuscript and contributed to the discussion.
Disclosure Summary: F.M.-J. currently receives grant support from Pfizer. J.C.S. currently receives grant support from Abbott Laboratories. The remaining authors have nothing to disclose.
References
Author notes
Address all correspondence and requests for reprints to: Franck Mauvais-Jarvis, MD, PhD, Division of Endocrinology and Metabolism, Tulane University Health Sciences Center, 1430 Tulane Avenue, SL-53, New Orleans, Louisiana 70112; E-mail: [email protected].
