


Abstract
Imperfect detection in field studies on animal abundance, including birds, is common and can be corrected for in various ways. The binomial N-mixture (hereafter binmix) model developed for this task is widely used in ecological studies owing to its simplicity: it requires replicated count results as the input. However, it may overestimate abundance and be sensitive to even small violations of its assumptions. We used a 33-year dataset on the Marsh Tit (Poecile palustris), a sedentary forest passerine, from Białowieża Forest, Poland, to validate inference from binmix models by comparing model-estimated abundances to the true number of breeding pairs within the plots, determined by exhaustive population study. The abundance estimates, derived from 6 springtime (April and May) counts of males on each plot in each year, were highly reliable: 116 out of 132 year-plot estimates (88%) included the true number of pairs within the 95% confidence intervals. Over- and under-estimations were thus rare and similarly frequent (9 and 12 cases, respectively), with a tendency to overestimate at low densities and underestimate at high densities. Marsh Tits sing rarely but the frequency of countersinging increases with abundance, leading to nonindependence in detections. When accounted for in a submodel for detection, the per-survey number of countersinging events positively affected detection probability but only weakly affected abundance estimates. Simulations further demonstrate that this property, overestimation at low densities and underestimation at high densities, may be a systematic bias of binmix model even if density-dependent detection is absent. While the behavior of binmix models in specific situations requires more study, we conclude that these models are a valid tool to estimate abundance reliably when intensive population monitoring is not feasible.
Resumen
La detección imperfecta en los estudios de campo de la abundancia de animales, incluidas las aves, es común y puede corregirse de varias formas. El modelo binomial de N mezclas (en adelante binmix) desarrollado para esta tarea se usa ampliamente en estudios ecológicos debido a su simplicidad: requiere como entrada resultados de conteo replicados. Sin embargo, puede sobrestimar la abundancia y ser sensible incluso a pequeñas violaciones de sus supuestos. Usamos un conjunto de datos de 33 años de Poecile palustris, un paseriforme sedentario de bosque, del Bosque de Białowieża, Polonia, para validar la inferencia de los modelos binmix comparando las abundancias estimadas por el modelo con el número real de parejas reproductoras dentro de las parcelas, determinado por un exhaustivo estudio poblacional. Las estimaciones de abundancia, derivadas de 6 conteos de machos en primavera (abril-mayo) en cada parcela en cada año, fueron altamente confiables: 116 (88%) de 132 estimaciones en las parcelas a lo largo de los años incluyeron el número real de parejas dentro del intervalo de confianza del 95%. Las sobreestimaciones y subestimaciones fueron, por tanto, raras e igualmente frecuentes (9 y 12 casos, respectivamente), con una tendencia a sobreestimar en densidades bajas y subestimar en densidades altas. Los individuos de P. palustris rara vez cantan, pero la frecuencia de contra-canto aumenta con la abundancia, lo que lleva a la falta de independencia en las detecciones. Cuando se tuvo esto en cuenta en un sub-modelo de detección, el número de eventos de contra-canto por censo afectó positivamente la probabilidad de detección, pero solo afectó débilmente las estimaciones de abundancia. Las simulaciones demuestran además que esta propiedad, la sobreestimación a bajas densidades y la subestimación a altas densidades, puede ser un sesgo sistemático del modelo binmix incluso aunque no exista una denso-dependencia de la detección. Si bien el comportamiento de los modelos binmix en situaciones específicas requiere más estudio, llegamos a la conclusión de que estos modelos son una herramienta válida para estimar la abundancia de manera confiable cuando el monitoreo intensivo de la población no es factible.

Lay Summary
• We performed a field test of binomial N-mixture models using a 33-year dataset of a Marsh Tit (Poecile palustris) counts in Białowieża Forest, Poland, by comparing abundance estimates from the model to the true number of breeding pairs.
• The models produced highly reliable estimates: 88% of 132 comparisons included the true number of pairs within confidence intervals but showed a clear tendency to overestimate abundance at low densities and underestimate it at high densities.
• Countersinging increased with abundance and violated independence in detections—one of the model’s assumptions. Despite this violation, simulations indicated that even if density dependence was not accounted for in the submodel for detection, model estimates showed high agreement with abundances at particular sites, except for extreme situations (low detection probability coupled with low or high abundance).
• While our study validates the performance of binmix models, future studies are needed to understand why and how the possible biases can arise.
INTRODUCTION
Field studies of the occurrence and abundance of animals commonly suffer from non-detections despite organisms’ actual presence, so-called false negatives (MacKenzie et al. 2006, Nichols et al. 2009, Kéry and Schaub 2012, Kéry and Royle 2016). Several methods have been developed to mitigate non-detection error, reviewed by Dénes et al. (2015). Binomial N-mixture models (hereafter “binmix models”; Royle 2004) have become a standard tool in studies of abundance when detection probability is imperfect. N-mixture models use multiple surveys across multiple sites to estimate detection probability and abundance and, provided that the assumptions of binmix models are not violated, abundance is estimated properly (Kéry 2010, Kéry and Royle 2016). The ease of obtaining such data during simple counts of unmarked individuals has resulted in the increasing popularity of these models. However, the relatively cheap data requirements of the binmix model do not come for free. Binmix models have been shown by Link et al. (2018) to be sensitive to violations of assumptions, including those individuals that are not double counted and that there is no unmodeled heterogeneity in detection probability. Being rarely investigated, the latter deserves particular attention, because one of the binmix model assumptions is that individuals at a site are detected independently—that is, detecting one individual does not affect detecting another one. Warren et al. (2013) demonstrated that per capita song rates and detectability of Golden-cheeked Warblers (Setophaga chrysopharia) increased with abundance, which violates the assumption of independence of detection and can lead to biased abundance estimates. However, no other studies have been performed to investigate how density-dependent song rates, possibly common in passerines, affect abundance estimates.
Furthermore, Barker et al. (2017) reported that abundance and detection parameters in binmix models may not be separately estimable if there is temporal variation in detection probability across repeated surveys. Without auxiliary data that help to explain variation in detection probability, counts of unmarked individuals may not have sufficient information to separate abundance from imperfect detection (unlike in capture–recapture data). However, a large-scale screening test by Kéry (2018) showed that model parameters were mostly estimable. Heavy biases in abundance estimates are also reported when the closure assumption is violated (Kéry and Royle 2016, Fogarty and Fleishman 2021). Violations of binmix model assumptions can be assessed by simulations, and Kéry and Royle (2016) offer an example of such an exercise (pp. 248–250 in Kéry and Royle 2016), with a few types of violations studied and discussed. Given the reported sensitivity of binmix models to violations of assumptions, it is of primary importance to understand the sources of variation in the data to obtain realistic abundance estimates and to choose the appropriate underlying distributions, as stressed by Joseph et al. (2009). In a recent study, Bötsch et al. (2019) used territory mapping data and nest box-occupancy data to test the performance of binmix and multinomial N-mixture models, the latter based on individual detection–non-detection histories within territories. Binmix performed well in estimating abundance, although the estimates were higher than the minimum number of territories assessed from the nest-box scheme. In view of doubts regarding the validity of abundance estimates from binmix models, further field tests of these models are necessary.
Here, we report a field test of binmix models, performed on a common forest passerine, the Marsh Tit (Poecile palustris). The rare opportunity to test binmix models by comparing estimates to the true abundance (hereafter “true state”) comes from our long-term (33 years) data, collected annually on permanent study plots in Białowieża Forest (eastern Poland). Marsh Tits are sedentary (Wesołowski 2015) and breed in natural tree holes in the Białowieża Forest (no nest boxes are present; Wesołowski 2001, 2007, Wesołowski and Martin 2018). We compiled the number of singing males from combined spot (territory) mapping surveys as the input for binmix models. The number of breeding pairs on study plots was obtained from the intensive population study on the same plots added to, and independent from, spot mapping surveys. During this study, Marsh Tit territories were nearly always identified and the majority of occupied nesting holes on our plots were found in most years, providing a reliable measure of the “true state” in each year. Our study was designed to test 2 hypotheses: (1) binmix abundance estimates—reported as too high in some studies—agree with the “true state,” known from a population study, and (2) the density-dependent detection probability expected in Marsh Tits biases abundance estimates negatively, if this portion of heterogeneity in detection is not modeled.
METHODS
Study Area
The study was conducted in the Białowieża Forest, located on the border between Poland and Belarus (Figure 1). Białowieża Forest is a mixed, deciduous-coniferous temperate forest and covers ~1,600 km2, of which ~625 km2 belong to Poland (including a 47 km2 fragment protected within the Białowieża National Park [BNP]; approximate central point: 52.7431°N, 23.8774°E) and the remaining part to Belarus. BNP conserves the last and best-preserved lowland primeval forest in Europe. Its high diversity stems from the well-preserved, diverse, multilayered structure of the primary forest, manifested in the full variability of the size and age of trees, a large amount of deadwood, and a superabundance of tree holes (e.g., Tomiałojć et al. 1984, Tomiałojć and Wesołowski 2004, Wesołowski et al. 2006, 2018).
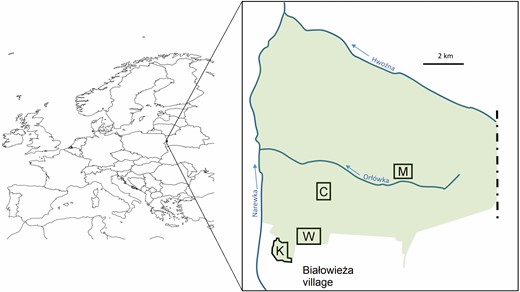
Map of Europe with the study area marked. Green area is the strict reserve of the Białowieża National Park; polygons labeled with letters (K, W, C, and M) are the 4 study plots.
Study Plots
The plots used in the study were established in 1975 to assess bird densities in the central part of the Białowieża Forest, within the BNP reserve (Tomiałojć et al. 1977, 1984). The monitoring has continued to the present (Wesołowski et al. 2015). The long-term population study on Marsh Tits, started in 1987, is conducted in parallel on 4 of these plots: 1 riverine (K) and 3 lime-hornbeam (C, M, and W) plots (Figure 1). Plots differ in areas (24 to 33 ha) and their descriptions can be found elsewhere (Tomiałojć and Wesołowski 2004, Wesołowski et al. 2015).
Territory Mapping: Field Methods
Bird monitoring based on spot mapping started in 1975 (Tomiałojć et al. 1984). Each year in the spring, from early April to late June, experienced observers visited 7 plots (including 4 used in the current study) 9 times during morning hours. Observations followed the recommendations of a combined territory (spot) mapping method (Tomiałojć 1980). During the survey, observers walked slowly through the plot to visit the whole area and mapped all birds heard or seen, with details on behavior or movements on field maps of 1:1,000 scale, allowing records to be mapped with a precision of a few meters. Surveys started at sunrise and took 4 to 6 hr. On average, 1.5 to 3 hr of time was spent on observations per 10 ha of forest, making the field effort quite intensive. Successive surveys were separated by 8- to 11-day intervals.
Data Preparation from Spot Mapping Surveys
A.W. and G.N. extracted records of Marsh Tit singing males from the field maps and counted their number for the analyses. We considered only records of singing males since female Marsh Tits sing rarely (Broughton 2008); females are detectable either by alarm calls or by visual cues and, thus, have a strikingly lower detection probability than males. During the surveys, observers noted all the birds detected, so the same individual birds might be, and frequently were, noted multiple times, which helped in delimiting territory boundaries later on by the presence of clusters of records. To reduce the effect of multiple detections of the same individuals, we adopted a conservative approach when counting the number of singing males from a given survey. Countersinging males during a survey made up the minimal number. Most commonly 2 neighboring males were recorded this way, but several records of 3 or even 4 singing males heard by the observer at the same time also occurred. Since Marsh Tit territories can be large, without countersinging, a male recorded singing in close proximity to another record of a singing male is likely to be the same individual, which has moved within its territory and vocalized again. Therefore, if no countersinging was recorded, we treated a male as a different one only when it sang at a distance of 300 m or more from the other males. While the limit of 300 m is somewhat arbitrary, may seem too large, and could underestimate male numbers (by removing some singing males recorded closer than a 300 m distance from other males), we based it on our experience, given the average territory size of the species. We used these criteria to determine the number of singing males from each survey in each plot in each year. We used data from surveys 1 to 6 (early April to late May with dates variable and dependent on the onset of spring each year; ranges for successive surveys 1 to 6 across years: April 4 to 19, April 7 to 27, April 12 to May 5, April 19 to May 13, April 28 to May 21, and May 9 to 30). Later in the season, males cease singing, young Marsh Tits leave nesting holes, and family groups disperse in the area, with little or no singing.
Marsh Tit Population Study
We determined the actual number of breeding pairs of Marsh Tit on a given plot in a given year within a detailed population study, starting in 1987 (Wesołowski 1996). This study was independent from the spot mapping surveys in the sense that we performed separate visits (15 to 25 per plot each year, late March to early May) dedicated to delimiting Marsh Tit territories and finding nesting tree holes (Wesołowski 2001). The Marsh Tit is a sedentary species once settled during the first year, and many birds reused nesting holes, the majority of which persist from previous years (Wesołowski 2006), making it easy to locate some of the pairs. Marsh Tits form permanent pairs that breed in exclusive territories ~5 ha in size (Amann 1997, Broughton et al. 2006, 2012) and rear 1 brood per year (Wesołowski 1998, 2000, 2002). Every year, we attempted color marking of all breeding adults with a unique combination of a metal and 3 color rings when nestlings were 10 to 15 days old, whenever the nesting hole was accessible. The majority of breeding adults were color ringed at the end of the season. The presence of individually marked individuals was helpful in delimiting and counting territories the next spring (Wesołowski 2006).
Marsh Tit distribution in the Białowieża Forest is more or less continuous in suitable habitats, and some territories only partly overlap with study plots. However, males (and pairs) from these territories were also recorded at study plots. Frequently, a nesting hole was found outside the plot (for instance, 50 m, 100 m, or even further away from the plot boundary), when observers followed birds first detected within a plot. Obviously, such males may be recorded during surveys. The presence of territories partly outside plot boundaries led to the so-called “sunflower effect” (Kéry and Royle 2016): the area effectively covered by surveys is larger than the plot since it includes some (unknown in size) areas adjacent to the plot. At the same time, because birds from these “boundary pairs” visited the plot (although most probably spent less their time there than individuals from within-plot pairs), we included them in plot-and-year-specific abundance estimates. Therefore, the basic Marsh Tit abundance (i.e. the annual number of pairs [territories] per plot, the “true state”) included all the pairs with territories wholly within the plot, which was a lower value than when boundary pairs were included. To delimit the maximum number of males that could occur on our plots during surveys, we added “boundary pairs” (creating a min-max range for the “true state”) to allow direct comparison with estimates from binmix models.
Binmix Model
Because we wanted to perform a model test, we estimated abundance (i.e. annual numbers of pairs territories–1 per plot) with a binmix model using counts of singing males. Binmix models assume that the population is closed during the course of the study, and this assumption seems to be generally met for Marsh Tits: the species is sedentary and territorial during breeding and nest failures (resulting in earlier cessation in singing or possibly leaving the plot by birds) happened very rarely before hatching (Wesołowski 2006, 2015). Since our surveys were spread over 2 months, however, violations of closure assumption could still happen: some individuals might have died, emigrated outside the plot following an early brood failure, or an immigrant or floater male could have passed through the plot and be detected during surveys. In fact, the binmix model using our survey data estimates the superpopulation size (the total number of males using the plot over the season) that can be different from the actual number of breeding pairs. Among other assumptions, binmix also requires that individuals are not counted multiple times so that false positives are absent (which we reduced by the minimal distance criterion), that all individuals have the same probability of detection, and that detections are independent (i.e. detection of a given individual is independent from detection of another individual; Royle and Nichols 2003, Kéry and Royle 2016). The latter assumption is likely to be violated in Marsh Tits, because males frequently respond to singing neighbors, which seems to be particularly evident in years with higher numbers. Obviously, this can lead to positive density dependence in detection probability (Royle and Nichols 2003, Warren et al. 2013). To investigate this more, we first verified whether the number of these interactions (where male activity is induced by a neighbor’s song, so that both sing at the same time) and the number of males involved were related to true abundance (see below). Second, we used countersinging cases extracted from the same maps for each performed survey and included them as a survey-dependent covariate in the submodel for detection to capture the effect of countersinging on detection probability directly. We used the time-for-space substitution (TSS) approach (Kéry and Royle 2016), in which, although the data are collected on the same plots for several years in a row, they are treated as independent (as if they were collected on different plots). In our case, we had data collected on 4 plots for 33 years, but they were treated as if there were 132 plots (4 × 33), each surveyed in one year. TSS approaches perform well (Yamaura et al. 2011) and have been proven to do so also in dynamic settings (Costa et al. 2019, 2021). Nonindependence was likely not problematic, since first-order autocorrelation was absent or weak in the 33-year time series of true abundance for plots C, K, and M (correlation coefficients of 0, 0.20, and 0.27 with P = 0.99, P = 0.28, and P = 0.14, respectively); only on plot W was it moderate and significant (r = 0.53, P = 0.01).
We fitted 12 models to the whole dataset. In the submodel for detection, we treated detection as dependent on survey (to address a decline in singing activity as the season progresses), dependent on the number of countersinging events during a particular survey, and dependent on both survey and countersinging. Abundance was modeled as either (1) constant (independent of the year and plot); (2) year dependent (and the same on all plots); (3) plot dependent (and the same for all years); or (4) year and plot dependent, producing separate abundance estimates for all plots in all years. Differences in plot areas were accounted for by using offset of log(area). Therefore, our most complex model had the form:
where the first line describes abundance, with Ni being abundance at the plot i, and the second line describes detection (observation) process, with Cij being the count at plot i during survey j and Pij being detection probability at plot i during survey j. Models that assumed abundance followed a Poisson distribution were preferred over negative-binomial and zero-inflated Poisson options based on Akaike Information Criterion (AIC, Supplementary Material Table S1). We ran models with several values of K, the upper limit of integration, to ensure insensitivity of estimates to the K value (eventually, K = 62, 2 × maximal count + 50 was sufficient). We fitted the models to the data in unmarked package (Fiske and Chandler 2011) in R 3.6.1 (R Core Team 2019). We obtained plot-and-year-specific, mean conditional estimates of abundance—best unbiased predictions (hereafter BUPs)—with their 95% confidence intervals (CIs), given observed data and model parameters (Kéry and Royle 2016) with the function ranef() in unmarked. We selected the model best suited to the data using AIC (Burnham and Anderson 2002). A goodness-of-fit test by parametric bootstrapping based on Tukey–Freeman discrepancy indicated underdispersion (i.e. that the data were actually less variable than assumed under the Poisson distribution; χ 2 = 0.55, P = 0.96). While this might also indicate a lack of fit, we took no action, as recommended by Burnham and Anderson (2002).
Binmix Estimates of Abundance and the “True State”
We used plot-and-year-specific BUPs to assess the magnitude of a difference between the binmix estimates and the “true state,” measured as a ratio of these 2 quantities (Warren et al. 2013): mean BUP/“true state.” A value of 1 indicated no difference between BUP and “true state,” while values below or above 1 indicated higher or lower BUPs than the “true state,” respectively. We obtained CIs of this difference by substituting lower and upper 95% confidence limits for a mean BUP, while “true state” was a fixed quantity. The difference can be considered significant, where the CIs excluded a value of 1. Furthermore, we tested for a relationship between the magnitude of a difference described above and the “true state” using a linear model (LM). The relationship was better described with a squared term of “true state” included as a predictor than ordinary LM (AIC: LM with squared term: –18.36 vs. ordinary LM: –13.07), deviance (32.6% vs. 29.2%), and adjusted R2 (0.32 vs. 0.29). BUPs and their precision are given by posterior abundance distributions provided by the function ranef(), applied to a binmix model object in unmarked. Here, any possible abundance at a site (0, 1, 2,... up to K, the upper limit of integration in binmix models) occurs with a defined probability and peaks at the most likely abundance, given the data and model estimates. To fully propagate uncertainties associated with BUPs, instead of using the single, most likely value per plot-and-year combination (like the mean or median BUP) and ignoring its uncertainty, we drew abundance estimates from posterior abundance distributions with appropriate probabilities. We repeated this procedure 500 times, each time creating a sample of BUPs for our 132 plot-and-year combinations and fitting an LM to this sample, which allowed us to include the uncertainty of the abundance estimate to be propagated into LM estimates.
Density-dependent Countersinging
To directly verify whether the number of countersinging interactions and the number of males involved in these interactions were related to true abundance, we used Poisson GLMMs in lme4 package (Bates et al. 2015) in R (R Core Team 2019). We used the number of countersinging cases recorded during a single survey and the total number of males involved as the (unbounded) responses (i.e. 2 countersinging males noted twice during a survey give a response value of 4), while the “true state” (the number of breeding pairs) and a factor identifying the survey (6 levels) represented predictors. We included the latter to address seasonal variation since Marsh Tits singing activity declines with date. To control for correlated responses (outcomes of 6 surveys at a single plot in a single season), we included plot-and-year combinations as a random effect with 132 levels.
Simulation Study
To further explore accuracy of binmix abundance estimates with and without density-dependent detection, we conducted simulations. In simulation 1, we generated 5 hypothetical sets of count data similar to our study system (150 sites, mean λ = 5, 6 surveys), where detection probability was either constant across all surveys and set to 0.2, 0.5, and0.8 (3 sets), varied randomly (random heterogeneity in detection) within 0.1 to 0.9 range, independently for each jth survey (fourth set), or declining across season and set to 0.6, 0.5, 0.4, 0.3, 0.2, and 0.2 (fifth set). Each set consisted of 500 simulation runs with binmix models assuming constant λ and survey-specific detection P fitted to each run. With λ = 5, the range of true (realized) abundance Ni within a single simulation run varied between 0 and 18 at individual sites. Simulation 2 followed simulation 1 (5 sets, 500 runs each), but our “basal” detection probability Pb (values from simulation 1) increased as a function of abundance at site i multiplied by logit-scale beta, b = 0.5, and had the values described by the equation: Pi = plogis(Pb + b × Ni). This resulted in an increase of P with N, which had a sigmoid shape (see Supplementary Material Figure S1). We used a simpler form of dependence of detection on abundance than Warren et al. (2013), but the resulting sigmoid increase was identical. Binmix models fitted to the entire simulation 2 were mis-specified: they did not account for the increase in detection with N so that this portion of heterogeneity in detection remained unmodeled. We summarized abundance estimates with raw BUPs from each simulation run (Supplementary Material Figures S2 and S3) and with coverage rates across all runs—the proportion of times CIs of BUPs include true (simulated) abundance for a given site (Supplementary Material Table S2). Simulations were conducted in R 3.6.1 (R Core Team 2019), using unmarked (Fiske and Chandler 2011) function pcount() to fit models, and parts of code provided by Kéry and Royle (2016).
RESULTS
During the territory mapping surveys, observers recorded between 0 and 6 Marsh Tit males per survey, rarely reaching the “true state”—the actual number of pairs breeding in the plot (Figure 2). Using the maximal count per site and per year, the number of males recorded equaled the “true state” in just 9 out of 132 year-and-plot combinations (~7%). Thus, even if the highest count out of 6 effort-intensive surveys performed per spring is chosen, it is still lower than the true population state.
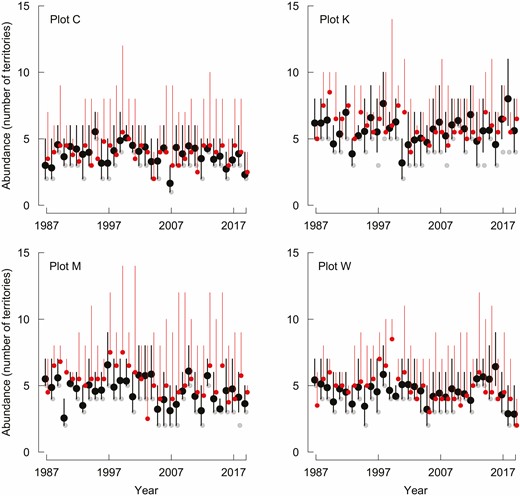
Binmix models of the 4 study plots estimate abundance reliably: model-estimated abundances shown by black dots (error bars: 95% CI) include true numbers shown by red dots (error bars: min–max range) in ~88% of comparisons. Binmix abundance (number of pairs/territories) estimated from counts of singing males Marsh Tits by the top-supported model, Białowieża Forest, 1987–2019. The highest count of singing males each year is shown with small, gray circles and is almost always lower than the true numbers.
The binmix models including both the seasonal decline and the countersinging effects in the submodel for detection had the most support (Akaike weight [wi] = 1; Table 1). The top-supported model had constant abundance (wi = 0.80; Tables 1 and 2). BUPs from this model were in most cases close to the “true state”: on average, 88% of estimates (plot-specific ranges: 85% to 94%, 33 comparisons for each plot) contained the “true state” within their 95% CI (Figure 2). Over- and under-estimates (“true state” not included within 95% CI) occurred with similar frequency: binmix underestimated abundance 12 times and overestimated 9 times (Figure 3A). Furthermore, when the “true state” included boundary pairs (creating a min–max range), CIs around BUPs and min–max ranges for the “true state” (within plot pairs + boundary pairs) overlapped in all except 7 cases, illustrating very high (~95%) agreement between binmix estimates and the true abundance. Remarkably, all of these cases were in fact underestimated by binmix relative to actual abundance, contrary to the widely reported tendency of this model to overestimate numbers.
Binmix models fitted to count data of singing male Marsh Tits from Białowieża Forest, eastern Poland, 1987–2019. λ is abundance, and P is detection probability. In the submodel for abundance, λ was modeled as: (.) = constant, year = year dependent, plot = plot dependent, and plot + year = plot and year dependent. The detection probability P was modeled as survey dependent, countersinging dependent, or both. k is the number of parameters, ΔAIC is the difference between the top-supported model and a given model in AIC units, and wi is the model weight. Models ranked according to AIC. The top-supported model is indicated in bold. Symbol (+) in the last column indicates wi < 2e-13.
| Model | k | ΔAIC | wi |
|---|---|---|---|
| λ(.)Psurvey + countersinging | 8 | 0.00 | 0.800 |
| λ plotPsurvey + countersinging | 11 | 2.72 | 0.200 |
| λ yearPsurvey + countersinging | 40 | 54.98 | + |
| λ year+plotPsurvey + countersinging | 43 | 57.68 | + |
| λ (.)Psurvey | 7 | 66.86 | + |
| λ plotPsurvey | 10 | 68.03 | + |
| λ yearPsurvey | 39 | 113.80 | + |
| λ year+plotPsurvey | 42 | 114.69 | + |
| λ (.)Pcountersinging | 3 | 178.00 | + |
| λ plotPcountersinging | 6 | 179.80 | + |
| λ year+plotPcountersinging | 38 | 223.90 | + |
| λ yearPcountersinging | 35 | 228.12 | + |
Coefficients from the top-supported binmix model used to estimate abundance of Marsh Tits, Białowieża Forest, Poland, 1987–2019. Coefficients are given on the link function scale (log for abundance and logit for detection; ± SE) and on real scale (with 95% CIs). Abundance estimate is expressed as numbers per area unit (1 ha) due to offset being included in the submodel for abundance. For subsequent surveys, detection probability coefficients are given as survey-specific estimates (means parametrization).
| Coefficient | Estimate | |
|---|---|---|
| Link function scale | Normal scale | |
| Abundance | ||
| λ | –1.790 ± 0.067 | 0.167 (0.146–0.190) |
| Detection probability P | ||
| Survey 1 | –0.204 ± 0.144 | 0.449 (0.381–0.520) |
| Survey 2 | 0.083 ± 0.146 | 0.521 (0.449–0.591) |
| Survey 3 | –0.132 ± 0.132 | 0.467 (0.404–0.532) |
| Survey 4 | –0.668 ± 0.116 | 0.339 (0.290–0.392) |
| Survey 5 | –0.961 ± 0.115 | 0.277 (0.234–0.324) |
| Survey 6 | –1.449 ± 0.120 | 0.190 (0.157–0.229) |
| Countersinging | 0.465 ± 0.068 | – |
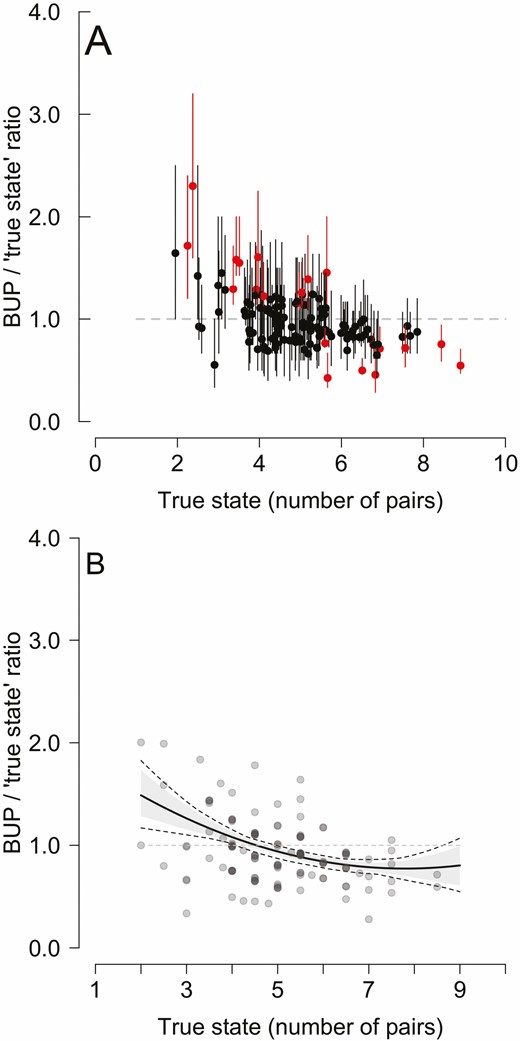
Binmix models tend to overestimate abundance at low densities and underestimate it at high densities: the magnitude of differences between binmix abundance estimates (BUPs) and the true state expressed as a ratio (BUP/true numbers; the value of 1.0 means no difference between the estimate and the true state, shown by a horizontal, dashed gray line) and plotted against the true state for the Marsh Tits in Białowieża Forest, 1987–2019. (A) Individual 132 year-and-plot-specific BUPs from binmix model (dots with error bars showing 95% CI, jittered slightly to reduce overlay). Red marks 21 binmix estimates that do not include true state within CIs. (B) Data from (A) generalized: relationship estimated with linear model, with uncertainty associated with binmix model abundance estimates considered (see Methods). Solid black line shows the relationship; gray shading is its 95% CI; dashed lines mark its min–max range. Gray dots show year-and-plot-specific BUPs (same as on the upper panel but without error bars to improve clarity).
The magnitude of difference between binmix BUPs and the “true state” declined with abundance (Table 3, Figure 3B). With low abundance (2 pairs on the plot), binmix overestimated 1.49 times (95% CI: 1.28–1.73) on average, while a tendency to underestimate was clear at high abundances (0.80 times [95% CI: 0.61–0.99] on average with 9 pairs breeding on the plot).
Coefficients from the LM used to explain variance in the magnitude of a difference between binmix abundance estimates and the “true state” (BUP/true state ratio) for the Marsh Tits in Białowieża Forest, 1987–2019. The LM relates the BUP/true state ratio to actual abundance (True state) and its squared effect (True state2).
| Coefficient | Estimate ± SE | t | P |
|---|---|---|---|
| Intercept | 2.066 ± 0.223 | 9.268 | <0.001 |
| True state | −0.332 ± 0.009 | –3.774 | <0.001 |
| True state2 | 0.021 ± 0.008 | 2.529 | 0.013 |
| Coefficient | Estimate ± SE | t | P |
|---|---|---|---|
| Intercept | 2.066 ± 0.223 | 9.268 | <0.001 |
| True state | −0.332 ± 0.009 | –3.774 | <0.001 |
| True state2 | 0.021 ± 0.008 | 2.529 | 0.013 |
Detection probability of a singing male Marsh Tit was significantly affected by the number of countersinging events (Table 2). It was highest early in the spring and declined as the season progressed. With no countersinging, detection probability was estimated at 0.45 and 0.52 during the first 2 surveys in April and declined to ~0.19 in late May. With 2 countersinging events per survey, respective values were 0.67, 0.73, and 0.37 (Table 2).
The number of countersinging cases recorded during the surveys was strongly, positively related to abundance (the “true state”) and declined during successive surveys (Table 4, Figure 4, top row). The same was true for the number of males involved in countersinging events (Figure 4, bottom row). Irrespective of seasonal decline, and not unexpectedly, this indicates that countersinging happens more frequently and involves more males when Marsh Tits are more abundant.
Coefficients from the generalized linear mixed models used to explain variance in the number of countersinging cases and number of males involved during surveys of singing male Marsh Tits, Białowieża Forest, Poland, 1987–2019. Coefficients are given on the log scale.
| Estimate ± SE | z | P | |
|---|---|---|---|
| Number of countersinging cases | |||
| Intercept | –2.054 ± 0.366 | –5.605 | <0.001 |
| True abundance | 0.364 ± 0.065 | 5.583 | <0.001 |
| Survey 2 | –0.679 ± 0.146 | –4.660 | <0.001 |
| Survey 3 | –1.030 ± 0.165 | –6.250 | <0.001 |
| Survey 4 | –1.415 ± 0.191 | –7.402 | <0.001 |
| Survey 5 | –1.415 ± 0.191 | –7.402 | <0.001 |
| Survey 6 | –2.544 ± 0.313 | –8.124 | <0.001 |
| Random effect variance | 0.4034 | ||
| Number of males involved | |||
| Intercept | –1.513 ± 0.373 | –4.057 | <0.001 |
| True abundance | 0.393 ± 0.069 | 5.707 | <0.001 |
| Survey 2 | –0.696 ± 0.096 | –7.252 | <0.001 |
| Survey 3 | –1.105 ± 0.111 | –9.953 | <0.001 |
| Survey 4 | –1.535 ± 0.132 | –11.670 | <0.001 |
| Survey 5 | –2.051 ± 0.164 | –12.501 | <0.001 |
| Survey 6 | –2.744 ± 0.225 | –12.179 | <0.001 |
| Random effect variance | 0.6850 |
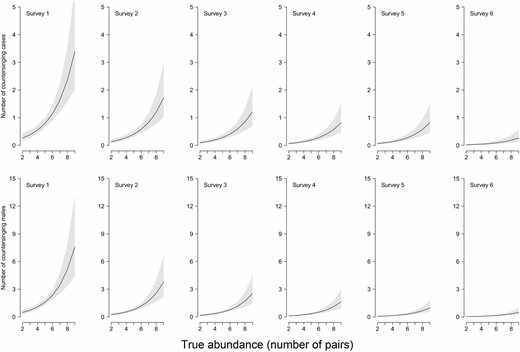
Marsh Tits countersinging increases with abundance and decreases with the progress of the breeding season: model-predicted relationships. (Top row) Number of countersinging cases per survey. (Bottom row) Number of males involved in countersinging cases, in relation to both true abundance (number of pairs, x axes on each panel) and season advancement (surveys 1–6, early April to late May). Lines show means, and gray shadings are 95% CIs.
Simulations showed that with no density-dependent detection, binmix tended to overestimate abundance at low densities and underestimate at high densities (Supplementary Material Figures S2A–E). The bias was stronger at sites with high abundance and low (P = 0.2) detection (Supplementary Material Figure S2A), became weaker at higher detection probabilities (Supplementary Material Figures S2B–D), and was still present in simulation results closely mimicking our study system, with detection declining across season and not accounted for in the models (Supplementary Material Figure S2E). Despite the presence of bias, high (≥95%) coverage rates illustrate that under most simulated scenarios, binmix models performed well. Density-dependent detection coupled with low (P = 0.2) basal detection and unaccounted for in the models led to regular overestimation of abundance at sites where there are more pairs/males (Supplementary Material Figure 3A). This effect disappeared for higher detection probabilities (basal P = 0.5 and 0.8); abundance estimates were then more accurate (Supplementary Material Figures S3B–D) but overestimation occurred again when a decline in detection across the season was simulated (Supplementary Material Figure S3E). For both simulations, coverage rates were the highest (≥95% of sites with CIs of abundance including true value) at sites with abundances centered around 5 (the simulated mean λ, roughly within the 1 to 10 range) and moderate to high detection probabilities. They were below this level when detection was low (P = 0.2) and systematically declined with abundance of 10 or more (Supplementary Material Table S2). This indicates that if density dependence in detection is not accounted for, binmix models still work well if detection probability is constant across surveys and moderate to high, except for sites with high abundance. The models tended to under- and over-estimate abundance when abundance was low and high, respectively, and detection probabilities were low (P = 0.2). While this might indicate a systematic problem with abundance estimates from binmix models, coverage rates, illustrating whether CIs included the true values, were ≥95% most of the time, except for extreme cases (Supplementary Material Table S2).
DISCUSSION
There are 3 main findings of this study. First, binmix models estimated abundance correctly: most estimates agreed with true population numbers, which is in line with Bötsch et al. (2019) conclusions. The rarity of comparisons like the one by Bötsch et al. (2019) or the one reported in this paper is most likely because true (or even approximate) states are rarely known. However, the quantity we use here as the “true state” (i.e. number of pairs from detailed population study) might still differ from both the actual number of pairs breeding on the plots. This is because even in territorial and sedentary species as the Marsh Tit, an unknown degree of population openness can occur over ~2 months. Both emigrations (e.g., following nest failures) or deaths and immigrations make local populations open, so that quantities estimated with binmix from counts repeated over such a long time represent the superpopulation size—the total number of individuals using the plots over the course of the study. Perhaps one can always expect some degree of openness of the population even in strictly sedentary and territorial species, which can bias abundance estimates severely (Link et al. 2018, Fogarty and Fleischman 2021; see also the latter work for the discussion on definitions of abundance). Possible solutions to this issue include shortening the course of the study that should help to reduce the degree of openness (there is less chance that anything changes over a short time window than over a longer window). However, repeated count results seem to suffer mainly from missing individuals during field surveys, provided that the population is closed. Only in a minority of cases did the highest number of males recorded during 6 surveys approach the “true state” and never exceeded it when boundary pairs were considered (Figure 2), illustrating that non-detection is common and should be corrected for.
So far, few studies have compared binmix abundance estimates to numbers that have been estimated by other means, notably by spot- (territory-) mapping (Chandler et al. 2011, Hunt et al. 2012, Warren et al. 2013), and these comparisons included point-count results as the input for binmix models. However, binmix models applied to point-count results, as is commonly done, have been shown to overestimate abundance if temporary emigration is high, so that either models accounting for this (Chandler et al. 2011) or distance sampling models are better used in such cases (Neubauer and Sikora 2020). Spot-mapped estimates of abundance, on the other hand, are derived with a set of more or less conservative criteria, and their quality is species-specific and depends on field effort. Thus, these estimates should be compared with model-based ones with great care. They usually provide only approximate (or minimal, when criteria are set conservative) abundance and, in most cases, it remains unknown how well they reflect true population states. Among European forest passerine species that have been intensively studied in the Białowieża Forest, including individual marked populations (like in the Marsh Tit example reported here), there are a few species for which combined mapping techniques provide accurate estimates: Eurasian Wren (Troglodytes troglodytes), Wood Warbler (Phylloscopus sibilatrix), and Common Chiffchaff (P. collybita) (Tomiałojć 1980). However, there are also species where labor-intensive mapping techniques are known to underestimate true abundance by 20% to 35%: Collared Flycatcher (Ficedula albicollis), Walankiewicz et al. (1997); Song Thrush (Turdus philomelos), Tomiałojć and Lontkowski (1989); and Hawfinch (Coccothraustes coccothraustes), Tomiałojć (2004). Therefore, using spot-mapping estimates as a surrogate for known abundance is not necessarily always justified before it is known how close they are to the true population state. In this study, we fitted binmix models to data extracted from spot-mapping surveys and compared model-estimated abundances to true numbers known from exhaustive population study, which is different than previous comparisons. Only a single recent study used a similar quantity; for the 2 species of tits (Blue Tit [Cyanistes caeruleus] and Great Tit [Parus major]), nest box-occupancy data provided approximate (or minimal, because some pairs could use natural nesting tree holes) abundances compared with binmix model estimates (Bötsch et al. 2019). There is a need for more comparisons using true, known abundances.
A second important finding is that binmix abundance estimates tended to be too high when density was low, and too low when density was high, similar to what was found for Golden-cheeked Warblers (Warren et al. 2013). This pattern is also present in simulation results with no density dependence in detection in the simulated data (Supplementary Material Figure S2). It seems that over- and under-estimating abundance at low and high densities, respectively, might be a regular feature of binmix wherever detection is low. Obviously, this cannot be the other way: if there is a single individual at a site, and it is recorded at least once during surveys, this must result in an overestimation if this is corrected for imperfect detection (abundance is estimated >1 for such a site). While this suggests a systematic bias of binmix model estimates under certain circumstances, in our study, they worked well; the high agreement of abundance estimates with the true numbers allows us to conclude that they remain a valid tool when abundance must be estimated without intensive population study.
Third, thanks to using direct observations from spot-mapping surveys, we were able to record the number of countersinging cases and the number of males involved, which were significantly related to true abundance (Figure 4) and affected detection probability, which increased with the number of countersinging cases and males involved (Table 2). This indicates that density-dependent detection probability was present, which violates one of the basic binmix model assumptions. While one may argue that if there are more birds, there are more songs but males sing independently (i.e. do not respond to each other), and in the case of the Marsh Tit, our observations are direct records of countersinging events. This is evident to any field ornithologist; territorial birds commonly respond to singing or displaying neighbors, which increases song rate and makes detection probability non-independent, and related to abundance. Countersinging is frequently motivated by the activity of neighbors and has been widely documented (e.g., Horn and Falls 1988, Eason and Stamps 1993, Penteriani 2003, McGregor 2005, Naguib and Kipper 2006, Hałupka 2014). Also, commonly used behavioral experiments using playback rely on this rule; playback represents a substantial interference by alien individuals into the population so that the response of the territory owners is reinforced. To some degree, the phenomenon is present in natural, undisturbed populations, where vocalizations are spontaneous (i.e. not induced by playback). Therefore, if records of singing or displaying males are used as the input for binmix models, it seems possible that this can be a common violation of the model assumptions. Simulations showed that even in the presence of density-dependent detection that is not accounted for, binmix models produced abundance estimates which agreed with true (simulated) values at a similar rate to when there was no density dependence in detection (Supplementary Material Table S2), but the patterns of under- and over-estimations were opposite. For low detection probabilities, abundance tended to be underestimated at low densities and overestimated at high densities, and estimates became accurate for higher detection probabilities, similarly to when there was no density dependence. Unfortunately, the behavior of binmix models in this respect cannot be tested on real-world data until the “true state” is known. Binmix models are widely used to estimate abundance, including vocalization-based detections in non-avian groups (like amphibians, e.g., Crovetto et al. 2019). Density dependence in detections can be less problematic when detections are visual like for shorebirds (Lyons et al. 2012) or for reptiles and salamanders (Ficetola et al. 2018), or another, non-singing segment of a population is counted, such that detections do not influence each other.
Conclusion
We conclude that binmix models are a valid alternative to intensive population monitoring for estimating abundance. While systematic over- and under-estimations occur in binmix abundance estimates, the direction and strength of these biases seem to depend on the presence of unmodeled heterogeneity in detection probability (like seasonal decline or density dependence), being more severe if detection is low. In this study, most abundance estimates contained true values within 95% CIs, both in real-world data (~88%) and in simulated data (90% to 100% in most scenarios). Whether countersinging, common in passerines, and leading to non-independence in detections, poses a widespread issue, requires more tests of binmix models.
ACKNOWLEDGMENTS
The authors thank all who participated in the fieldwork over many years. In particular, we thank L. Tomiałojć, W. Walankiewicz, D. Czeszczewik, C. Mitrus, G. Hebda, M. Maziarz, M. Czuchra, M. Cholewa, B. Orłowska, T. Kliś, and many others. We also thank T. S. Osiejuk, K. Hałupka and anonymous Reviewers for their valuable comments and suggestions. Daniel O′Connell and Julian Jurec kindly improved our English. One of our coauthors, T.W., unexpectedly passed away while working with us on this manuscript. The authors want to dedicate this paper (one of the many that originated from the Marsh Tit study, Tomasz’s favorite bird species) to his memory.
Funding statement: The financial aid of the ALA, Schweizerische Gesellschaft für Vogelkunde und Vogelschutz, Schweizerische Vogelwarte Sempach, the Ministry of Environmental Protection and Natural Resources (Poland), and the National Fund for Environmental Protection and Water Management (Poland) helped to partially cover the costs of fieldwork in various periods.
Ethics statement: The study was conducted in compliance with the permissions from the Białowieża National Park.
Author contributions: G.N. and A.W. formulated the question; T.W., G.N., and P.R. collected data; G.N., A.W., T.W., and P.R. wrote the paper; and G.N. and A.W. analyzed the data.
Data availability: Analyses reported in this article can be reproduced using the data provided by Neubauer et al. (2021).
