


Abstract
Populations of many vertebrates are declining and geographic ranges contracting, largely as a consequence of anthropogenic threats. Many reports of such decline, however, lack the breadth and detail to narrow down its causes. Here we describe population decline in the Common Loon (Gavia immer), a charismatic aquatic bird, based on systematic resighting and measurement of a marked population. During our 27-year investigation, age-adjusted chick mass has fallen by 11%, mortality among young and old chicks has increased by 31% and 82%, respectively, and fledging success has declined by 26%. Meanwhile, the return rate of marked nonbreeders (“floaters”) has plunged by 53%, and the adult population overall has declined by 22%. Consistent with the thinning ranks of floaters, the rate of territory eviction has decreased by 52% during the study. Despite the decline in floaters, territory occupancy remains unchanged. However, a matrix model, updated with recent estimates for breeding success, juvenile survival, and senescence, yields a recalculated deterministic population growth rate (λ) of 0.94 for our study population, which suggests that declines in vital rates could lead to a loss of 52% of the current population and a decline of 37% in territory occupancy by 2031. Lack of data on floaters in other upper Midwest and New England loon populations leaves their status in doubt.
Resumen
Las poblaciones de muchos vertebrados están disminuyendo y los rangos geográficos se están contrayendo, principalmente como consecuencia de las amenazas antropogénicas. Muchos reportes de esta disminución, sin embargo, no tienen la amplitud y el detalle como para acotar sus causas. Aquí describimos la disminución poblacional de Gavia immer, un ave acuática carismática, basados en re-avistamiento sistemático y medición de una población marcada. Durante nuestra investigación de 27 años, la masa ajustada por edad de los polluelos ha caído un 11%; la mortalidad entre juveniles y polluelos viejos ha aumentado un 31% y 82%, respectivamente; y el éxito de emplumamiento ha disminuido un 26%. Mientras tanto, la tasa de retorno de los individuos no reproductivos marcados (“flotantes”) se ha derrumbado un 53%, y la población adulta global ha disminuido un 22%. En consonancia con la disminución de las filas de los flotantes, la tasa de desalojo territorial ha disminuido un 52% durante el estudio. A pesar de la disminución de flotantes, la ocupación del territorio permanece sin cambios. Sin embargo, un modelo matricial, actualizado con estimaciones recientes del éxito reproductivo, la supervivencia de juveniles y la senescencia, arroja una tasa de crecimiento poblacional determinístico recalculada (λ) de 0.94 para nuestra población de estudio, lo que sugiere que las disminuciones en las tasas vitales podrían llevar a la pérdida del 52% de la población actual y una disminución del 37% en la ocupación del territorio para 2031. La falta de datos de flotantes en otras poblaciones de G. immer del Medio Oeste superior y de Nueva Inglaterra deja en duda su estatus.
Lay Summary
• The adult loon population in northern Wisconsin has declined by 22% over the past 27 years.
• Numbers of chicks and chick mass have declined significantly.
• The population of young nonbreeders (floaters) has plummeted by 46%.
• Despite these steep declines, there has been no measurable drop in the number of territorial pairs.
• The hidden nature of the Wisconsin decline points out that floater populations can mask major drops in breeding populations and throws into question population trends in other loon populations, whose floater populations are largely unknown.
INTRODUCTION
Across all major groups, habitats, and continents, vertebrate populations are decreasing, with many such declines caused directly or indirectly by anthropogenic factors (Allan et al. 2019, Powers and Jetz 2019). The number of North American birds, for example, has decreased by 29% during the past half-century (Rosenberg et al. 2019). The situation is expected to worsen; 53% of all North American breeding birds are projected to lose over half of their breeding ranges in coming decades and shift northwards because of climate change (Langham et al. 2015).
The global nature of current population trends and forecasts obscures an important point: population declines occur within species, each of which confronts a unique set of ecological stressors. Thus, careful measurement of populations through time is required to reveal causes leading to decline (Both et al. 2006). Such longitudinal studies offer the best hope for pinpointing specific life-history stages where declines occur and identifying measures to reverse them (Balbontín 2005).
Floaters, young adults that lack breeding territories, are an important constituent of breeding populations (Riechert 1981, Bondrup-Nielsen 1985, Jaeger et al. 1995, Gołąb et al. 2013). These birds are often difficult to detect and count owing to their furtive behavior and wandering habits (Penteriani et al. 2011). To understand the relationship of floaters to population dynamics, these birds must be marked and monitored over time. Floaters can reduce breeding success of breeders by increasing the cost of territory defense, increasing competition for food, and shortening territorial tenure, but they also fill territory vacancies and thus enhance population stability (Brown 1969, Penteriani et al. 2011). Indeed, in species where floaters are conspicuous (Watson 1985), they might serve as an early-warning system for conservationists, because a decline in their numbers presages a decrease in the capacity of the population to occupy breeding habitat (Franklin 1992, Penteriani et al. 2011).
The Common Loon (Gavia immer) is a charismatic diving bird whose population status is of concern, especially along the southern edge of its breeding range. While this species currently breeds across Canada and 14 northern United States, a recent study projects that the Common Loon will lose 80% of its U.S. breeding range by 2050 and 56% of its entire breeding range by 2080 owing to climate change (Langham et al. 2015). Loon populations face numerous anthropogenic impacts, including shoreline development (Newbrey et al. 2005); ingestion of fishing tackle (Sidor et al. 2003, Grade et al. 2018); boat collisions (Sidor et al. 2003); and human-assisted recovery of Bald Eagle (Haliaeetus leucocephalus) populations, which has led to increased predation (Cooley et al. 2019).
Long-term marking of loon chicks together with short-range natal dispersal has produced a large population of marked floaters in northern Wisconsin whose movements and territory settlements are recorded routinely (Piper et al. 2015). Floaters intrude into breeding territories to look for chicks as an indicator of territory quality, and often return the subsequent year to evict the pair member of their sex and claim its breeding position (Piper et al. 2000, Piper et al. 2006). Pair members hide chicks from floaters and leave chicks alone while attempting to draw floaters to neighboring lakes (Piper et al. 2006). However, the importance of floaters to population stability is not well understood.
Here we report results from a longitudinal investigation of loon survival during the chick and early floater stages in our study population, which has been under study since 1993. We examined longitudinally the survival of both young ( < 5 weeks) and old chicks ( ≥ 5 weeks), as well as brood size and body mass of chicks. To these analyses of juveniles, we added longitudinal investigations of (1) the return rate of young loons as floaters, (2) territorial intrusions by floaters and (3) territory evictions, which are almost always carried out by floaters (Piper et al. 2015). Finally, we used the newly estimated parameters of chick and floater survival reported herein, and two additional parameters also measured recently, adult female survival and senescence, to update an existing model originally developed for Wisconsin and New Hampshire populations to determine whether they were increasing, stable, or in decline (Grear et al. 2009).
METHODS
Study Species
Common Loons are medium-distance migrants that winter along both Atlantic and Pacific coasts of North America. The species is sexually monomorphic, but males (mean mass ± SD = 4,500 ± 310 g, n = 1070) are 24% larger than females (3,630 ± 250 g, n = 914). Pairs together defend breeding territories, and females lay two eggs, which are incubated jointly by the pair for 28 days (Evers et al. 2020). Chicks hatch asynchronously, and the first hatchling is typically larger than the second (Piper et al. 2012). Parents provide the majority of food items for the chick(s) through 6 weeks: small fishes, crustaceans, insect larvae, leeches, snails, and other aquatic invertebrates (Merrill et al. 2005, Piper et al. 2013). Parental provisioning decreases through week 11, at which point chicks can feed themselves (Merrill et al. 2005, Evers et al. 2020).
The survival rate is high in chicks, but they face a number of threats, including large fishes, Bald Eagles, and intruding loons that kill them opportunistically (McIntyre 1988, Merrill et al. 2005). Chicks may perish owing to lack of food, especially on small lakes; smaller chicks in two-chick broods are especially vulnerable (Piper et al. 2012). Mortality is infrequent among chicks older than five weeks (McIntyre 1988).
Study Area
We study territorial breeders and floaters within a roughly 3,500 km2 study area in northern Wisconsin, USA, which is centered at 45°42’N, 89°36′W and comprises most of Oneida County and adjacent portions of Lincoln and Vilas counties (Figure 1). From April, when lakes become ice-free, through October, loons defend breeding territories on glacial lakes in this region, which are used also by humans for boating and fishing. Territories consist either of entire small- to medium-sized lakes (0 to 200 ha; mean area ± SD: 56 ± 48 ha; 97 pairs in 2019) or portions of large lakes ( > 200 ha; mean = 523 ± 448 ha; 12 pairs in 2019) that may support multiple pairs.
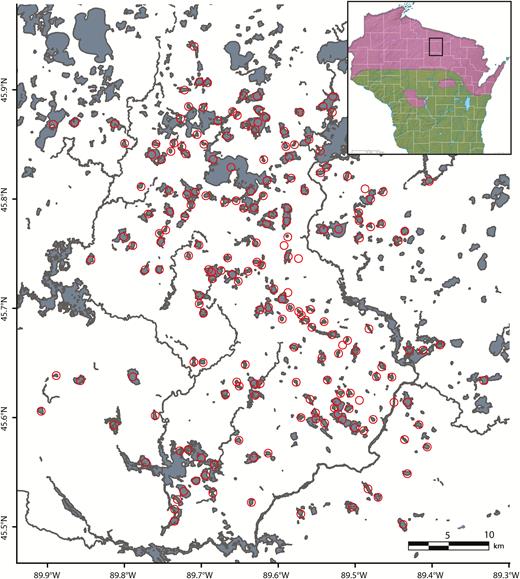
Study area in northern Wisconsin, showing its location in the state (inset) relative to the breeding range of Common Loons (purple). Circles indicate loon territories.
The number of breeding territories covered during the study has grown steadily from 15 in 1993 to a high of 119 in 2015, as new pairs have been captured and marked; this number also fluctuates annually (e.g., 113 in 2018, 109 in 2019) as new territories are occupied and old ones become vacant. According to estimates by LoonWatch (Gostomski and Rasmussen 2001; E. LeMoine, pers. comm.), our study animals comprised 9.8%, 7.1%, and 8.6% of the statewide loon population in 2005, 2010, and 2015, respectively.
Capture, Marking, and Field Observation
Adults and chicks are spotlighted at night and netted from a 3.7-m motorboat, brought to shore, and fitted with a single USGS metal band and three colored plastic leg bands for identification (Gravoglas 2-Plex: GravoTech, Inc., Duluth, GA, USA). Each captured loon is weighed to the nearest 10 g with a digital hanging scale (Salter-Brecknell SA3N253; Fairmont, MN, USA) and released in its territory with at least one family member. While adults have been individually marked since 1993, chicks have been marked individually only since 1998.
Single observers in canoes make weekly visits of at least 1 hr (e.g., mean in 2019 of 68 ± 25 min SD, n = 741) between 1 May and 7 August to all focal breeding territories. Timing of lake visits and observers are rotated systematically to minimize bias. During May and July of each year, observers visit lakes within the study area that are suitable for loons but were not occupied during the previous year to locate new territories founded by floaters. Hours of observation time varied annually during the course of the study, increasing in the mid-1990s and reaching a plateau in the early 2000s, which we have maintained up to the present.
On each visit to a focal territory, most of which occur between 500 and 1300 hours, observers identify males and females from leg bands and record breeding activity. (Most individuals permit canoes to approach within 10 m without alarm.) In addition, we record intrusions and identify all territorial intruders that land in the territory (e.g., 745 landings in 2015), if banded, and record their interactions with breeding pair members. Intruders fall into four categories: 84% are young floaters that have never held a territory; this includes 35% of all intruders marked as chicks in the study area (hereafter “young marked floaters”), and 49% of all intruders, which are unmarked and have dispersed into our study area from adjacent populations (Piper et al. 2015). An additional 6% of all intruders are older floaters that have been evicted from a territory, and the final 10% are breeders decoying intruders away from their chicks and territory (Piper et al. 1997).
Nesting attempts are conspicuous, because nests are always within 1 m of the lake’s edge and are placed on islands, emergent vegetation, muddy hummocks or along open shorelines (Piper et al. 2008a). We inspect each nest to assess nesting outcome, if nesting adults are later found without chicks (Piper et al. 2008a). Nests that hatched one or both eggs contain dozens of angular eggshell fragments 0.5 to 5 cm in diameter and large pieces ( ≥ 10 cm diameter) of the outer eggshell membrane. Depredated nests typically contain no eggs or eggshell fragments, although large ( > 10 cm diameter) eggshell fragments are often found within 10 m. Nests abandoned owing to black fly (Simulium annulus) infestation or loss of a pair member contain intact but cold eggs and have no adult loon in attendance (Piper et al. 2018).
Distinguishing Territorial Eviction from Passive Replacement
Disappearance of marked loons from their territories and their replacement by floaters is a regular occurrence among both sexes (n = 272 males; n = 210 females from 1993 to 2019). Observers are usually not present on territory to record such turnovers, but we conduct systematic searches on surrounding lakes to locate missing breeders. Turnovers have three causes: territorial eviction of a healthy breeder; passive replacement of a dead or injured pair member; and (rarely) territory abandonment (Piper et al. 2000).
Of 482 territorial turnovers since 1993, we classified 145 (30%) as either known or likely passive replacements because they occurred at the beginning of the season, and the missing loon was either known to be dead or never re-sighted. We classified another 197 turnovers (41% of 482 total turnovers) as known evictions, if observed in progress (16.8% of all cases: 33 of 197 total evictions) or likely evictions (83.2%: 164 of 197 evictions), if displaced breeders suddenly became floaters or exhibited lacerations on the head or neck consistent with a recent territorial battle, or we never re-sighted them following their disappearance but had observed them to be healthy less than a week beforehand (Piper et al. 2000). We excluded 140 turnovers (29%) from analyses, because we could not identify them as either evictions or passive replacements with certainty.
Statistical Analyses
We examined several of measures of reproductive success. Because all analyses were longitudinal, consisting of breeding measurements within a fixed set of study lakes from 1993 to 2019, we used generalized linear mixed models (STATA 15.1, StataCorp, College Station, TX), with territory as a random effect, to account for the repetition of lake data across years. In addition, all analyses included year as a fixed effect to detect longitudinal trends. If the dependent variable was a count, as with nesting attempts, chicks surviving, or chicks lost, we used a model suited to the variable (either Poisson or negative binomial; model fit assessed with countfit program in STATA). In cases of binary dependent variables (e.g., brood size: either one or two chicks), we employed logistic regression. Finally, when the dependent variable fell into more than two classes that could be ordered meaningfully (e.g., “no hatch”, “one hatch but at least one failure” and “one hatch”), we used ordered logistic regression.
We employed additional mixed models to look for trends in chick mass and adult mass over the course of the study. For chick mass, three known covariates were included: chick age (estimated by interpolating between last known date of incubation and first date with a chick), lake size (Piper et al. 2012), and mean mass of parents (Piper et al. 2012), while territory was treated as a random effect. In the analysis of adult mass, we used day of year and lake size as known covariates (Piper et al. 2015) and used identity as a random effect (to account for multiple captures across years).
We measured the number of floaters in the study area, and its change over the course of the study, in two ways. Both analyses began in 1998, the first year in which we began to mark all chicks. Our first analysis used as dependent variable the proportion of all young marked floaters that returned to the study area from each yearly cohort, while including as a covariate the hours of observation during the two to four years after banding (we have never observed a loon to return in the its first year; Piper et al. 2015). The use of this covariate accounted for inevitable annual differences in observation time.
Our second analysis used as dependent variable the number of young marked floaters that intruded during a given territory visit of 1 hr or more. The “per visit” approach of this analysis seemed likely to account better than the first analysis for possible bias caused by differences in hours of field observation across years, because the probability of observing a young marked floater on a given visit does not depend upon annual field effort, but rather upon a variety of situational and temporal covariates that we can measure and add to the model. Known situational and temporal covariates included in the model were (1) presence/absence of chicks in the territory the previous year (Piper et al. 2006); (2) presence/absence of chicks currently in the territory (Jukkala and Piper 2015); (3) days between the date of the observation and 25 July, when intrusions peak (Piper et al. 2006); (4) hour during which the observations began (intrusions peak at daybreak; Piper et al. 2006); (5) lake size; (6) duration of observation period; (7) number of chicks banded in the study area in the 2 to 4 years before the observation; and (8) distance from the observation lake to the center of the study area (since central lakes receive more visits by young marked floaters; Piper et al. 2015).
We also investigated possible impacts of floaters on the breeding population. First, we determined the proportion of all marked breeders evicted each year. Second, we measured the number of territories in which a male and female behaved as a breeding pair on at least two visits in April through June. Third, we used estimates of breeding success and floater survival reported herein and estimates of survival and senescence of adult females from a recent study (Piper et al 2017) to update a population model (Grear et al. 2009).
Statistics that we report below are means ± standard errors (SE).
RESULTS
Longitudinal Changes in Breeding Success
Loons in northern Wisconsin have experienced a gradual decline in breeding success over the past 27 years (Figure 2). The incidence of chicks reaching five weeks of age has fallen by 1.1% a year from 1993 to 2019 (Wald χ 2 = 12.7, df = 2, year: z = –2.6, P < 0.01; lake size: z = 2.7, P < 0.01; n = 1741 attempts on 176 territories; Figure 2). This cumulative decrease in chick production of 26% from 1993 to 2019 occurred despite no significant change in the number of nesting attempts during the study (Wald χ 2 = 0.36, df = 1, year: z = 0.60, P = 0.55, n = 2,087 attempts on 183 territories) and no change in hatch rate (Wald χ 2 = 0.54, df = 1, year: z = –0.73, P = 0.46; n = 1,738 nests on 176 territories).
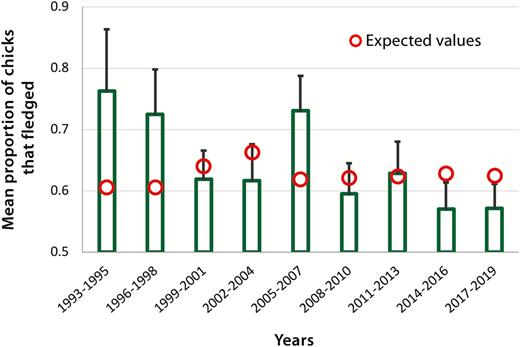
Observed proportions of chicks that survived to five weeks ( ± SE) from 1993 to 2019. Expected values were generated from a mixed Poisson model that used survival to five weeks of age as the dependent variable and lake size as a predictor.
Chicks were lost both before and after five weeks of age. One hundred forty-two of 541 chicks aged less than 5 weeks were lost from 1993 to 2006 (26%; n = 848 nest attempts), whereas 258 of 756 (34%; n = 1,324 attempts) were lost from 2007 to 2019 (Wald χ 2 = 16.2, df = 2, year: z = 2.1, P = 0.04; n = 1277 hatches on 179 territories). The likelihood of loss of chicks 5 weeks or older increased at a greater rate, as 15 of 517 (2.9%) and 46 of 752 (6.1%) older chicks were lost from 1993 to 2006 and from 2007 and 2019, respectively (Wald χ 2 = 17.9, df = 2, year: z = 3.0, P = 0.003; n = 772 older chicks on 158 territories). The odds of producing a 2-chick brood also decreased by 3.4% annually during this period (Wald χ 2 = 22, year: df = 2, z = 3.8, P < 0.001; n = 1046 broods on 171 territories; Figure 3). For example, 53% of all broods comprised a single chick between 1993 and 1998 (n = 90), whereas 73% of all broods were singletons from 2014 to 2019 (n = 278).

Observed mean proportions of two-chick broods ( ± SE) from 1993- to 2019. Expected values were generated from mixed logistic model that used brood size as the dependent variable and lake size as a predictor.
Chick mass declined by 9.5 g annually over the course of the study (Figure 4; Table 1). For example, the mean predicted chick mass fell from 2,120 g ± 32 during 1998–2002 (n = 117) to 1,890 g ± 25 from 2015 to 2019 (n = 248; Wald χ 2 = 1,689, df = 4; n = 916 chicks on 165 territories; Table 1). In contrast, no significant longitudinal change occurred in masses of male or female breeders (Table 1).
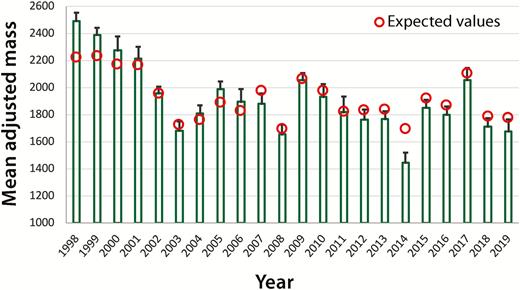
Observed values of chick mass ( ± SE) from 1998 to 2019. Expected values were generated from mixed model that used chick mass as the dependent variable and included lake size, mean parental mass, and chick age as predictors.
Regression coefficients ± SE for GLM regressions that used chick mass, male parent’s mass, or female parent’s mass as dependent variables.
| Predictor | Chick | Male | Female |
|---|---|---|---|
| Year | –9.5 ± 2.1** | 0.11 ± 1.5 (ns) | 0.57 ± 1.0 (ns) |
| Mean parent mass | 0.18 ± 0.04** | – | – |
| Day of year | – | –5.0 ± 0.50** | –2.6 ± 0.50** |
| Lake size | 58 ± 15** | 74 ± 11** | 39 ± 8.4** |
| Days post-hatch | 55 ± 1.4** | – | – |
| Wald χ2 | 1,689 (df = 4) | 163 (df = 3) | 42 (df = 3) |
| Total masses Birds Lakes | 916 916 165 | 878 482 321 | 763 449 319 |
** P < 0.001.
Longitudinal Changes in Floater Population and Floater Impacts
Floater abundance has fallen to a greater degree than chick survival. Indeed, the percentage of young marked floaters identified decreased from 51% in hatch years 1998 through 2000 (n = 91) to 24% in hatch years 2012 to 2014, an overall 53% decline (n = 185; adjusted R2= 0.62; t = –5.4; P < 0.001; n = 18 years; Figure 5). Moreover, intrusions by young marked floaters as a group fell by a mean of 4.4% each year (by a cumulative 61%) from 1998 through 2019 (Wald χ 2 = 864, df = 9; n = 21629 visits to 178 territories; Table 2).

Observed proportions of chicks banded in each year that returned as marked floaters from 1998 to 2015 ( ± 95% confidence intervals). Expected values generated from mixed regression that used proportion of young marked floaters resighted as the dependent variable and included sum of observation hours two to four years after banding as a predictor.
Incidence rate ratios from mixed negative binomial model that used probability that a young marked floater was observed as dependent variable and the following predictors: (1) year, (2) presence or absence of chicks in current year, (3) presence or absence of chicks in the previous year, (4) number of chicks banded 2 to 6 years before, (5) lake size, (6) difference between date of observation and 25 July, (7) hour of observation, (8) duration of observation period, and (9) distance between lake of observation and center of study area.
| Predictor | Impact on intrusion rate | Z | P |
|---|---|---|---|
| Year | ↓4.4% per year | –3.43 | 0.001 |
| Chick(s) now? | ↓16% if chicks now | –4.48 | < 0.001 |
| Chick(s) last year? | ↑10% if chicks last year | 2.93 | 0.003 |
| # chicks banded 2–6 yr ago | ↑0.4% per chick banded | 3.89 | < 0.001 |
| Lake size | ↑14% per ln (ha) | 2.60 | 0.009 |
| Days away from 25 July | ↓1.3% per day | –9.26 | < 0.001 |
| Hour of observation | ↓19% per hr after 5 am | –15.09 | < 0.001 |
| Duration of obs. period | ↑1.4% per min | 18.35 | < 0.001 |
| Centrality | ↓3.1% per km from center | –4.04 | < 0.001 |
The sharp decline in the number of young marked floaters in the population did not appear to come about because of increased emigration. Indeed, natal dispersal distance showed no longitudinal increase in either males (R2 = 0; t = 0.1; P = 0.9; n = 107; W. H. Piper personal observation) or females (R2 = 0.03; t = 1.12; P = 0.27; n = 46; W. H. Piper personal observation).
Consistent with the drops in the floater population and intrusion rate, the likelihood of territorial eviction fell by 3.4% a year, and by a cumulative 52%, between 1998 and 2019 (Wald χ 2 = 29, df = 2; n = 2,041 territory-years on 178 territories). However, the number of territories occupied during May showed only a nonsignificant decline from 1998 to 2019 (r = –0.29, t25 = –1.5, P = 0.13; Figure 6).
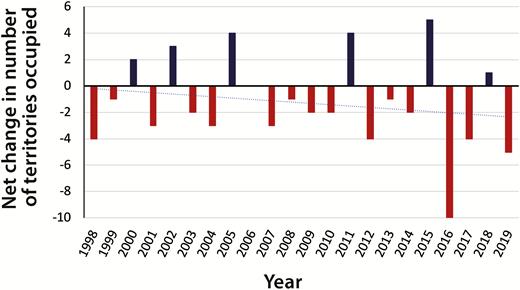
Net change in number of territories occupied during May of each year from 1998 to 2019.
Impacts of Changes in Reproductive and Survival Parameters on the Loon Population
The density-independent matrix population model developed by Grear et al. (2009) served as a baseline to assess changes in population growth rate and was:
where Pj is survival within the juvenile stage, Gj is the rate at which juveniles survive to breeding age, Pa is annual adult survival from Mitro et al. (2008), and Fa is the annual number of chicks reared to mid-August per female. More specifically, Fa is the product of adult female survival probability from mid-August to the following breeding season (Pa10/12), the probability that a surviving female forms a breeding pair (b), the number of chicks she and her mate successfully rear to mid-August (m), and the probability of each chicks being female (r, measured at 0.5):
Thus configured, the model produced an estimate of λ of 0.99, indicating a rate of population decline of 1% annually.
The fertility term (m2004) estimated by Grear et al. (2009) relied upon data from 2002 to 2004. Substituting our new estimate of 1.1% annual decline in the survival rate of chicks for the period 2004 to 2019 yields:
which, after further substitution into Equation (1) and applying the matrix construction steps in Grear et al. (2009), produces λ = 0.98.
Updating further with our new estimate of 2.28% annual decline in juvenile survival from 2000 through 2019, Sj becomes:
Substitution into the calculations of Grear et al. (2009) to obtain Pj and Gj for Equation (1) yields λ = 0.96.
Continuing our cumulative updating, we use Pa = 0.927 for adult female survival (Piper et al. 2017), which yields λ = 0.97. If female senescence is included and a lifespan of 30 years is assumed (see Piper et al. 2017), then Pa = 0.77 for females older than 25. Taking Pa as the geometric average of the 23 annual transitions from age 3 to 26 and the four between 26 and 30 (i.e. ), the matrix becomes:
and λ = 0.94.
We can use known parameters and field observations to estimate the floater population and entire adult population during the study. Based on field observations, 42% of floaters are young marked floaters, and the remaining 58% are unmarked immigrants; the estimated annual resighting rate is 70% among floaters (Piper et al. 2017). These values can be used to convert the number of floaters resighted each year into an estimated total annual floater population. Thus, floaters comprised 47% of all adults from 2002 to 2004, but only 32% from 2017 to 2019. Because the breeder population exhibited no statistically significant change, we presume that only floater abundance has declined. If so, the floater population has fallen by 46%, and the entire adult population by 22%, from 2002–2004 to 2017–2019.
We can use the new estimate of λ = 0.94 to project the future size of our study population. A 6% annual decline in the adult population reduces the population to 48% of its current size in 12 years. Presuming that the percentage of adults that are floaters continues to fall from its current 32% but bottoms out at 10% (because some floaters will be 2- to 4-year-olds, which never or seldom breed; Piper et al. 2015), such a decline would reduce territory occupancy in 2031 to an estimate of 63% of its 2019 value (75 of 119 current territories).
DISCUSSION
Common Loons have experienced a sustained downturn in breeding success in northern Wisconsin over the past quarter century. While tendency to nest and hatching rate have not changed during this period, chicks have significantly lower mass now than they did 20 years ago and are dying in greater numbers both before and after five weeks of age. More striking than the steady reproductive decline, however, is the return rate of young marked floaters, which has fallen to less than half of its original value during our study.
Broadly speaking, vertebrate populations can decline because of (1) low adult survival (Weimerskirch and Jouventin 1987), (2) low breeding success (Peery et al. 2004), (3) poor recruitment of juveniles into the adult population (Szostek and Becker 2012), or some combination of these factors (Grüebler et al. 2008). Decline of the adult population is, in general, highly visible, as it results in loss of breeding adults, while declines owing to a decrease in breeding success are less visible, because young are only conspicuous during a limited period, and temporal and spatial fluctuations obscure overall trends. Population decline resulting from reduced survival during the juvenile or floater phase is most cryptic, because such individuals are often difficult to count.
Numerous authors have emphasized the importance of floater populations in maintaining healthy breeding populations (Brown 1969; Hunt 1998; Penteriani et al. 2005, 2011). Penteriani et al. (2005) show that increased floater mortality can lead to extinction, especially with delayed breeding, as in loons. Furthermore, declines of floaters, which are hard to track, might be detected long after they have begun, and possibly too late to reverse them (Franklin 1992, Penteriani et al. 2011). In fact, our detection of a cryptic decline in a loon population thought to be increasing 20 years ago (Gostomski and Rasmussen 2001) illustrates this danger.
At first glance, the stability in territory occupancy we recorded is puzzling in light of the sharp decline in floaters. The apparent contradiction must occur because (1) loons live into their teens or twenties (Piper et al. 2017), so territory vacancies accumulate slowly; (2) loons do not claim territories until they are 5 to 11 years old (Piper et al. 2015), so a decline in chick production does not impact the breeding population quickly; and (3) above all, most floaters never settle, so losses of floaters might still leave a sufficient number to fill territory vacancies. Indeed, we have little data that might allow us to estimate the tipping point beyond which a floater population becomes too small to fill vacancies in the breeding population. Thus, it is possible that our floater population could fall still further, yet still be sufficient to sustain the breeding population.
The strong decline in rate of territory eviction reported herein illustrates the short-term, positive, density-dependent impacts that a downturn in floater numbers can have on breeding success. A fall in the eviction rate might boost breeding success slightly, because young, evicting males are initially unfamiliar with safe nesting sites, must locate them by trial and error, and thus produce fewer young than the males they evicted (Piper et al. 2008a). In addition, a fall in floater numbers can increase breeding success by reducing infanticide by evicting loons (Piper et al. 2000) and by floaters, which sometimes kill small chicks opportunistically during territorial intrusions (McIntyre 1988). However, the reproductive benefits to the population of fewer evictions and less interference in breeding are clearly swamped by the reproductive decline itself, which has continued unabated throughout the study period.
The rate of chick production has declined by an estimated 26% over the course of the study, about half the trend in the floater decline of 53%. We propose two possible explanations for this disparity. First, high mortality might continue beyond the chick stage and into the fall, when juvenile loons are preparing for their initial migration and when our lake coverage is limited. Second, mortality might have increased both during chick-rearing and at a second as yet unspecified stage between the juvenile and floater periods, such as during migration or on the wintering ground.
Despite acute public interest in the status of the Common Loon and numerous reports concerning human impacts on survival and breeding success (e.g., Daoust et al. 1998, Cooley et al. 2019), few studies have examined population dynamics in this species. To date, estimates of λ are 1.02 (1989–2012: Grade et al. 2018) and 1.01 (Grear et al. 2009) for New England; 0.99 (Grear et al. 2009) for northern Wisconsin; and 1.02 (1999–2007; Schoch et al. 2014), for New York. Thus, southerly loon populations appeared stable or were increasing slightly a decade ago. The sudden decline in floaters documented here for what had been a stable or rising Wisconsin population (Gostomski and Rasmussen 2001) throws into question the status of other populations of this charismatic species along the southern edge of the breeding range.
A practical problem in assessing the status of loon populations is acquiring long-term data. While the population decline we found was most pronounced within floaters, and hence largely hidden from view, the decline in breeding success we noted is more obvious. Indeed, data from citizen scientists were used to detect a similar drop in loon chick production over a 37-year period in southern Ontario, Canada (Bianchini et al. 2020). A decline in brood size, which can be measured in unmarked populations and which seems to be a sensitive indicator of overall breeding success (Evers et al. 2020), might provide an early indication of overall breeding decline.
A fundamental question posed by our findings is the cause of the long-term declines in survival of chicks and young loons. The possibilities are many, but two hypotheses seem most plausible at present. First, a surge in Bald Eagle populations has been linked to precipitous declines in Ospreys (Pandion haliaetus) and Great Blue Herons (Ardea herodias) in Minnesota (Cruz et al. 2019). Indeed, a recent study concluded that Bald Eagles, which attack both adult loons and chicks (Piper et al. 2008b), reduce loon nesting success in New England (Cooley et al. 2019). However, eagle attacks on adults and chicks would not seem a logical cause of the lower chick mass we detected, unless the increased abundance of eagles reduced the amount of time that adult loons could devote to feeding chicks. Furthermore, the rate of eagle flyovers in our study area has not increased during our study (r = –0.016, P = 0.94 between eagle flyovers per hour and year; n = 406 flyovers in 22 years), so preliminary data do not support the eagle hypothesis. A second and more plausible cause of the declines in mass and survival of young loons might be a drop in food availability. While the two fish most consumed by adult loons and chicks, bluegill (Lepomis macrochirus) and yellow perch (Perca flavescens), have not decreased in abundance in northern Wisconsin in recent decades (Rypel et al. 2016), a fine-grained, lake-specific analysis of fish populations will be required to test the food hypothesis robustly.
ACKNOWLEDGMENTS
We thank K. Tischler, M. Klich, F. Spilker, N. Banfield, L. Furey, K. Brunk, G. Jukkala, E. Harrington, A. Reinke, A. Dolsen, M. Schwabenlander, J. Flory, and E. Andrews for field work.
Funding Statement: This research was supported by the National Science Foundation (IBN-0316442 and DEB-0717055); National Geographic Society, Disney Conservation Fund, and Chapman University. In addition, J. Grear was supported by the US Environmental Protection Agency (EPA). The views expressed in this article, which was submitted with EPA tracking number ORD-037154, are those of the authors and do not necessarily reflect the views or policies of EPA.
Ethics statement: We adhered to the protocols administered by the Chapman University Animal Care and Use Committee.
Author contributions: W.P. conceived of the study design, collected and analyzed data, and wrote the manuscript. J.G. developed and updated the population model, wrote the pertinent part of the manuscript, and edited the manuscript. B.H. collected data and edited the manuscript. L.G. collected a massive amount of field data. E.L. collected extensive field data and edited the manuscript.
Conflict of interest statement: The authors declare that they have no conflict of interest.
Data depository: The datasets generated during and/or analyzed during the current study are available in the “Loon Project Database” repository through Chapman University
Digital Commons (https://digitalcommons.chapman.edu/sees_data/3/) and available from Dryad (doi:10.5061/dryad.m905qftzf).
