


Abstract
Evaluating population-level responses to conservation action following large-scale disturbance can improve the efficacy of future habitat conservation measures. In October 2012, Hurricane Sandy storm surges cleared vegetation and opened inlets through the barrier islands, Fire Island and Westhampton Island, New York, creating Piping Plover (Charadrius melodus) habitat. Storm effects prompted an island-wide stabilization project, which had the potential to negatively affect novel Piping Plover habitat. Certain sections of Fire Island were designed to create and/or improve habitat (hereafter, restoration areas) to mitigate possible habitat loss or degradation. Since Piping Plovers in New York appear to be habitat-limited, we anticipated positive population growth following habitat creation. From 2013 to 2018, we captured and banded 152 adults and 353 chicks, and monitored 279 nests and 160 broods. We developed an integrated population model to assess demographic processes in response to hurricane created-habitat (2013–2018) and the creation of restoration areas (2015–2018). We observed positive population growth in 3 of 5 yr, and overall growth throughout the period ( = 1.13). Immigration and reproductive output were correlated with population growth (r = 0.92 [95% CI: 0.22 to 0.98] and 0.84 [95% CI: –0.47 to 0.95], respectively). Compared with the rest of the study area, restoration areas had higher chick survival, and lower nest survival and after second-year site fidelity. The result was population growth in restoration areas (1.14) similar to the whole study area. In the short term, restoration areas seemed to mimic natural Piping Plover habitat. Vegetation removal, an important process in renewing natural Piping Plover habitat, likely will be necessary to maintain habitat suitability. Efforts to increase immigration of new breeding adults into the system, and to improve reproductive output, primarily by habitat creation or maintenance, are likely to have the greatest local effect on population growth.
Resumen
La evaluación de las respuestas a nivel poblacional a las acciones de conservación luego de disturbios a gran escala puede mejorar la eficacia de las futuras medidas de conservación de hábitat. En octubre de 2012, las marejadas provocadas por el Huracán Sandy despejaron la vegetación y abrieron entradas a través de las islas de barrera Fire y Westhampton, Nueva York, creando hábitat para Charadrius melodus. Los efectos de la tormenta promovieron un proyecto de estabilización en toda la isla, que tenían el potencial de afectar negativamente el nuevo hábitat de C. melodus. Algunas secciones de la Isla Fire fueron designados para crear y/o mejorar el hábitat (de aquí en adelante, áreas de restauración) para mitigar posibles pérdidas o degradación de hábitat. Debido a que C. melodus parecía estar limitado por el hábitat en Nueva York, anticipamos un crecimiento poblacional positivo luego de la creación de hábitat. Desde 2013 a 2018, capturamos y anillamos 152 adultos y 353 polluelos, y seguimos 279 nidos y 160 nidadas. Desarrollamos un modelo poblacional integrado para evaluar los procesos demográficos en respuesta al hábitat creado por el huracán (2013–2018) y a la creación de áreas restauradas (2015–2018). Observamos un crecimiento poblacional positivo en tres de los cinco años, y un crecimiento global a lo largo del período ( = 1.13). La inmigración y el rendimiento reproductivo estuvieron correlacionados con el crecimiento poblacional (r = 0.92 [95% IC: 0.22 a 0.98], y 0.84 [95% IC: –0.47 a 0.95], respectivamente). Comparadas con el resto del área de estudio, las áreas restauradas tuvieron una supervivencia del polluelo más alta, y menores supervivencia del nido y fidelidad al sitio luego del segundo año. El resultado fue un crecimiento poblacional en las áreas restauradas ( = 1.14) similar al de toda el área de estudio. En el corto plazo, las áreas restauradas parecieron imitar el hábitat natural de C. melodus. La remoción de la vegetación, un proceso importante en la renovación del hábitat natural de C. melodus, probablemente será necesaria para mantener la disponibilidad de hábitat. Los esfuerzos para aumentar la inmigración de nuevos adultos reproductivos al sistema, y para mejorar el rendimiento reproductivo, principalmente por creación o mantenimiento de hábitat, es probable que tengan el mayor efecto local en el crecimiento poblacional.
Lay Summary
• Despite being listed under the Endangered Species Act for more than 30 yr, and intensive management, Piping Plovers on the Atlantic Coast have not met population recovery goals across much of their breeding range.
• Hurricane Sandy increased available nesting habitat (dry sand) by over 150%. Following Hurricane Sandy, we monitored a population of individually marked birds on Fire Island and West Hampton Island, New York, for 6 yr. The area monitored included restored habitat, to evaluate the effectiveness of Piping Plover targeted habitat management.
• The population increased 90% in the 6 yr following Hurricane Sandy, primarily because of immigrant adults, and local reproductive success. The reproductive output and population growth in restoration areas were similar to the rest of the study area.
• Overall, Hurricane Sandy habitat creation was positive for this local plover population.
• Efforts to allow future hurricane storm surges to create habitat, along with continued management, will improve long-term population persistence.
INTRODUCTION
Understanding the contribution of each demographic parameter to population change, particularly in the face of changing environments, is essential for knowing where and how to focus ever-dwindling conservation resources. Population change is an outcome of numerous, often correlated, demographic processes that respond to various environmental stimuli (Newton 1998). Most commonly, conservation-modeling strategies focus on a single demographic parameter (e.g., nest success, adult survival, and reproductive output; Botkin and Miller 1974, Martin 1988, Annett and Pierotti 1999). However, estimating population parameters separately makes it challenging to compare and understand the relative contributions to population change of individual parameters (Schaub and Abadi 2011, Koons et al. 2016). Thus, analytical approaches that consider multiple demographic inputs into population growth allow for a more holistic assessment of population change (e.g., Beissinger et al. 2006, Calvert et al. 2006, Schaub and Abadi 2011, Tempel et al. 2014). With a more thorough understanding of population change, we also can better understand how species respond to environmental variation, and efficiently target conservation funding towards the specific vital rate(s) contributing most to population change.
Changes in local population size can result from fine-scale effects, such as area-restricted habitat change or management, or regional changes, which can be detected through population synchrony or correlated changes in multiple populations (Mortelliti et al. 2015). Such synchronous changes could be explained by regional climate or weather patterns, high levels of immigration and emigration, or regional synchrony in predator populations (Liebhold et al. 2004). Habitat-altering disturbances, both at fine and broad scales, can also lead to population change through these mechanisms and can affect each individual demographic process. At the local scale, an increase in habitat through disturbance events, such as storms or habitat modification, can lead to a release from density-dependent processes such as crowding (Rodenhouse et al. 1997, Catlin et al. 2019). Changes in habitat amount or quality at fine scales likewise can affect broader scales, particularly if a population is a source following disturbance, or part of a metapopulation (Pulliam 1988). Alternatively, disturbances can negatively affect populations, such as if a disturbance event occurred simultaneously with animal presence on the landscape and resulted in increased mortality, lowered reproductive output, or movement away from the site (Wunderle and Wiley 1996, Hunt et al. 2018).
A species that responds to disturbance, both positively and negatively, is the Piping Plover (Charadrius melodus; Saunders et al. 2014, Hunt et al. 2018). Piping Plovers are temperate breeding shorebirds listed under the United States Endangered Species Act (1973) due to habitat loss, human disturbance, and predation (USFWS 1985). Piping Plovers are ground nesters, preferring sparsely vegetated, dry sand (Wiltermuth et al. 2015, Walker et al. 2019, Elliott-Smith and Haig 2020), typically laying 4 egg clutches in scrapes in the sand, and hatching precocial young. The adults and chicks are reliant on moist or saturated shoreline for foraging habitat (Elias et al. 2000). Preferred sites generally have low wave energy and gradually sloping shorelines such as bayside intertidal habitats in coastal systems or backwater areas in riverine systems (Patterson et al. 1991, Elias et al. 2000, Fraser et al. 2005, Goodale et al. 2007, Le Fer et al. 2008). Piping Plovers arrive on the breeding grounds after mid-March, and they initiate southward migration from July to September to sites between North Carolina, the Bahamas, the Caribbean islands, and on the Gulf of Mexico coast (Gratto-Trevor et al. 2012, Elliott-Smith and Haig 2020). Throughout the range, each Piping Plover population faces threats and challenges to recovery, such as flow modification in the Great Plains’ rivers, beach modification and human recreation on the Atlantic Coast (Catlin et al. 2015, DeRose-Wilson et al. 2018, Gibson et al. 2018, Walker et al. 2019), and predation throughout (Saunders et al. 2018). Piping Plovers generally are found in systems that are sensitive to habitat-altering disturbance events such as storms or floods, disturbances that create open, sparsely vegetated sand on the breeding grounds where they often are habitat-limited (Cohen et al. 2009, Hunt et al. 2018, Maslo et al. 2018, Robinson et al. 2019).
Storm or flood surges that bury or remove vegetation can have positive effects on breeding Piping Plover population size (Wilcox et al. 1959, Boettcher et al. 2007, Cohen et al. 2009, Schupp et al. 2013, Catlin et al. 2015). Maintenance of Piping Plover habitat requires relatively frequent disturbance to remove vegetation or deposit sand (e.g., ~4 yr on the Missouri River; Zeigler et al. 2017). However, human intervention has modified the frequency of possible disturbance through the disruption of natural processes (Catlin et al. 2015, Walker et al. 2019). Furthermore, human use of the shoreline further reduces functionally available habitat for Piping Plovers (Maslo et al. 2018, 2019, Walker et al. 2019) and can have negative effects on specific vital rates such as adult and chick survival (DeRose-Wilson et al. 2018, Gibson et al. 2018).
In October 2012, Hurricane Sandy intersected the Atlantic Coast, causing widespread damage to infrastructure and extensive sand movement in beach systems (Smallegan et al. 2016). Two barrier islands and Piping Plover nesting sites in New York, Fire Island and Westhampton Island, experienced considerable movements of sand and ocean water across the islands, forming several areas of open sand extending from ocean beach to bay shorelines. Barrier islands are narrow, low-lying strips of sand that lie parallel to the mainland in some coastal systems (Leatherman 1988, Stutz and Pilkey 2011). Three breaches in the islands (i.e. areas where the ocean water was able to connect and flow continuously to the bay) also resulted from the storm (Hapke et al. 2013). The United States Army Corps of Engineers (USACE) subsequently filled 2 of the breaches (USFWS 2014, Walker et al. 2019). Due to concerns about the ability of the island to protect mainland Long Island from future storm impacts, the Fire Island to Moriches Inlet Stabilization project was initiated to prevent future overwashes (USACE 2014). The project involved the creation of dunes, which were stabilized by planting American beachgrass (Ammophila breviligulata). However, the stabilization project had the potential to negate some positive demographic effects for Piping Plovers of Hurricane Sandy by interrupting nesting areas of flat, sparsely vegetated dry sand and access to bayside low-energy intertidal habitats. The United States Fish and Wildlife Service (USFWS) wrote a biological opinion following a biological assessment of the stabilization project to determine whether the project had the potential to jeopardize the continued existence of breeding Piping Plovers (USFWS 2014). The biological opinion resulted in a non-jeopardy decision but contained several measures to reduce potential negative effects of the stabilization project on local breeding Piping Plovers. One of the conservation measures was that 2 mitigation areas on the island were built to create nesting habitat, which were about twice the size of the total area of stabilized dunes (hereafter, restoration areas; Bellman 2018, Walker et al. 2019, Zeigler et al. 2019). Following conservation initiatives such as habitat restoration, it is helpful to understand how those actions influence the population to inform future management or conservation actions (Stem et al. 2005, Catlin et al. 2011).
The Piping Plovers in the Fire Island study area make up ~11% of the New York population, and 2% of the Atlantic Coast population, thus there were ample individuals to move into the population, and many breeding sites to which Fire Island individuals could emigrate. Piping Plover dispersal has been documented among management units and states (Haig and Oring 1988a, Cohen et al. 2009, Hillman et al. 2012, Amirault-Langlais et al. 2014, Catlin et al. 2016). This observed dispersal suggests that emigration and immigration are influential to Piping Plover population dynamics at both local and regional scales, thus, there is interest in understanding site-specific population drivers. Models that explicitly incorporate immigration and emigration can be used to estimate site-specific vital rates, to understand the relationship of those rates to population change, and to evaluate the effects of disturbance or specific management actions.
Piping Plovers are habitat-limited across much of their range (Cohen et al. 2009, Hunt et al. 2018, Robinson et al. 2019), and thus we hypothesized that an increase in nesting habitat, both from Hurricane Sandy and the creation of the restoration areas, should lead to an increase in the population size on Fire Island and Westhampton Island (Robinson et al. 2019). We were interested in demographic drivers of population change in a small, hurricane-affected Piping Plover population and understanding the relationship of USACE-built restoration areas to annual population growth through reproductive output and site fidelity. Our objectives were (1) to determine how various demographic rates (i.e. nest survival, chick survival, and immigration) contributed to population change on Fire Island and Westhampton Island (hereafter, Fire Island) following widespread habitat creation, and (2) to evaluate the effect of Piping Plover habitat built by the USACE on demographic rates and overall population change at this site and in the context of the regional population.
METHODS
Study Area
We studied Piping Plovers on a 27-km stretch of Fire Island and Westhampton Island, during April to August, 2013–2018 (Figure 1). The study area consisted of Fire Island National Seashore, managed by the National Park Service, Smith Point and Cupsogue Beach County Parks, managed by Suffolk County Parks, and Robert Moses State Park, managed by New York Parks, Recreation, and Historic Preservation. The portions of Fire Island that we did not monitor had low nesting densities (0–3 pairs per year) and were monitored by National Park Service and USFWS staff. Fire Island and Westhampton Island have the Atlantic Ocean to the south, and several bays to the north (Figure 1). Habitat types in the study area consisted of ocean-front sandy beaches, dunes, overwashes (areas where storm water carried sand landward over the island), bayside sandy beaches, ephemeral pools, and filled island breaches originally formed by Hurricane Sandy (Walker et al. 2019). The study area also included 3 inlets, Fire Island Inlet, Old Inlet, and Moriches Inlet. Old Inlet was formed by Hurricane Sandy and left open, and Fire Island Inlet and Moriches Inlet are dredged inlets, stabilized with jetties to the east and west. Human use varied among the management areas and comprised pedestrian and off-road vehicle use on various portions of the beach with boat access along the bayside shoreline (DeRose-Wilson et al. 2018).
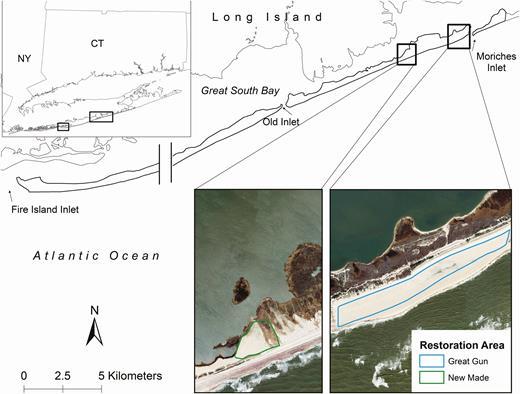
Study area on Fire Island and Westhampton Island, New York, in which Piping Plovers were studied, 2013–2018. The break represented an ~25-km area that we did not regularly survey for Piping Plovers. Nesting Piping Plover density was low to zero in this area from 2013 to 2018. Two restoration areas were created between the 2014 and 2015 breeding seasons to mitigate for potential effects of barrier island stabilization to Piping Plovers. Restoration areas are labeled as bold black boxes over the island. The restoration areas can also be viewed on an outset; the Great Gun restoration area was 34.8 ha and the New Made restoration area was 6.6 ha (areas calculated in 2015). Outlines are overlaid on imagery flown on March 3, 2016. Scale for the 2 images is the same for direct comparison. The 2 restoration areas are ~2.5 km apart.
Potential Piping Plover predators in the study area include red fox (Vulpes vulpes), domestic cat (Felis catus), raccoon (Procyon lotor), Common Raven (Corvus corax), American Crow (Corvus brachyrhynchos), Peregrine Falcon (Falco peregrinus), Merlin (Falco columbarius), Great Black-backed Gull (Larus marinus), Herring Gull (Larus argentatus), and Atlantic ghost crab (Ocypode quadrata). Early in the study there were high densities of red fox in the study area; however, mange outbreaks occurred in 2015 and 2017, significantly reducing the local red fox densities (Robertson et al. 2019).
The USACE created 2 restoration areas on Fire Island between the 2014 and 2015 Piping Plover breeding seasons (Figure 1). The restoration areas were designed to mimic natural Piping Plover nesting habitat and were created to mitigate for the potential loss of habitat caused by the Fire Island to Moriches Inlet Stabilization Project. The Great Gun restoration area nominally was 34.8 ha, ~1,500 m long and 160 m wide, and was constructed by flattening topography, removing vegetation and sand from some areas, and adding sand in other areas. The New Made restoration area was 6.6 ha, ~375 m long and 240 m wide, and was originally a deposit site for dredged material. New Made was constructed by flattening and burying vegetation with added sand (USFWS 2014, Bellman 2018). Since the creation of the restoration areas, revegetation occurred more rapidly at New Made than in Great Gun (Bellman 2018). New Made restoration area, in addition to being smaller, was situated north of a sand road and had little to no access to bayside foraging habitat after vegetation succession, primarily in the form of Phragmites australis, within about a year. Great Gun restoration area, alternatively, had ample access to ocean intertidal foraging habitat and associated wrack but no access to bayside habitats.
Field Methods
Nest monitoring
We searched for nests by surveying areas while closely watching the ground and by observing adult Piping Plover behavior. When a nest was found, we collected the location using a Garmin (Garmin International, Olathe, Kansas, USA) or Trimble GPS unit (Trimble, Sunnyvale, California, USA). If a nest was found with fewer than 4 eggs, we backdated to an estimated initiation date assuming 1.5 days to lay each egg (Wilcox 1959, Haig and Oring 1988b). If a nest was found with 4 eggs or it did not increase to 4 eggs after 4 days, we floated eggs to estimate the initiation date (Westerskov 1950). We monitored all nests every 1 to 3 days until they hatched or failed and classed nests that hatched at least one chick as “successful.”
Adult monitoring
Prior to 2013, all individuals in the study were unmarked. During each year, we trapped unbanded adults on nests using walk-in drop traps (Wilcox 1959) and banded adults using either a uniquely coded, field-readable ultraviolet-stable Darvic flag (Roche et al. 2014) or a unique combination of 4 color bands on the tibiotarsus (2013 only). We surveyed for adult Piping Plovers beginning in the spring of 2013–2018 (range: April 1–May 14), concluding in the late summer of each year (range: August 23–September 26). We surveyed all of the study area, including the restoration areas, every 2 to 3 days using linear transects ~100–300 m apart. We resighted marked birds using 20–60x spotting scopes. We associated adult Piping Plovers with a nest either by confirming the incubation of banded birds using a spotting scope or by catching the adult on the nest.
Chick monitoring
We banded all chicks as soon as possible after hatch (age range: 0–13 days), following the same banding scheme as for adults. We conducted brood surveys for each brood every 1 to 3 days until chicks reached 30 days old. We considered a bird fledged at 25 days post-hatch for consistency with past Piping Plover studies (Hunt et al. 2013, Catlin et al. 2015). We also collected auxiliary resightings of banded Piping Plovers outside of our study area but within the Atlantic Coast breeding range (North Carolina to Atlantic Canada; Catlin et al. 2015).
Integrated Population Model
As population growth is the outcome of multiple nonindependent demographic processes, population models that incorporate information from interconnected demographic processes often allow for more robust inference about the importance of particular vital rates to population growth (Schaub and Abadi 2011). Here, we adapted integrated population models (IPMs) initially developed by Kéry and Schaub (2012) and Saunders et al. (2018), which explicitly integrated population growth, nest survival, chick survival, and adult survival (Figure 2). The IPM was based on a 2-stage matrix population model; the 2 stages were birds from hatch to their first breeding season (second year [SY]) and after second-year birds (ASY; 2+ breeding seasons). Stage nomenclature was associated with age of breeding individuals, but demographic parameters apply to the time step prior to the breeding season. Although SY Piping Plovers can skip breeding (Saunders et al. 2014), in our study area the majority of SY individuals bred in their first year after hatch and rarely skipped breeding, thus we assumed all SY birds bred in their first year (Saunders et al. 2018). Throughout, we refer to true survival, which is apparent survival corrected for birds permanently emigrating from the study site (Sandercock 2006).
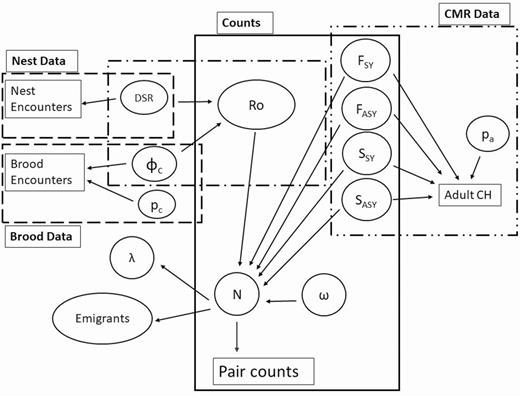
Integrated population model. Large boxes specify a specific model, ovals indicate parameters, arrows indicate a parameter that is informed by the data to which it points. Adult CH indicates adult capture histories for the Barker model, CMR indicates capture-mark-recapture data for the Barker model. Piping Plovers are not hunted and generally are not recovered dead, thus recovery parameters were set to zero and not shown here. Abbreviations: number of immigrants = ω, F = fidelity, S = true survival, p = detection probability, φ = survival, DSR = daily nest survival rate, Ro = reproductive output, N = population size, and λ = population growth rate. The “c” subscript indicates chicks, and an “a” subscript indicates adults.
Population size
We used a hierarchical, state-space model to estimate breeding population size for each year, where the latent estimate of population size was drawn from a Poisson distribution based on counts of breeding pairs with high detection probability (Taylor et al. 2018, Weithman et al. 2019; Equation (1)). Piping Plovers are socially monogamous (Eberhart-Phillips 2019); therefore, the data input for breeding population size was twice our estimated annual pair counts, which we calculated from known banded individuals. If a pair divorced in a given year and the male re-mated, we counted that as the same pair. If the female re-mated, we counted that as a separate pair if it was the male’s first nest, as male Piping Plovers are the primary territory holders (Haig and Oring 1988b). For unbanded pairs or early failing nests (<10% annually), we used nest proximity and initiation and failure dates to determine whether a nest could belong to an existing pair (Walker et al. 2019). The first population count in 2013 was a random variable with an informed prior of 64 individuals, from our pair count of 32, but without estimates of population structure due to lack of information regarding the population structure prior to the start of our study. Our state space model estimated the number of SY and ASY individuals using stage-specific survival estimates and estimates of either the number of fledglings in the year prior or the total number of breeding adults in the year prior, respectively. The immigration component (NImm), modeled as a latent parameter representing the true process of immigration into the breeding population and an unknown amount of model assumption violation sampling error (Riecke et al. 2019), was estimated from a Poisson distribution with a mean value, ω. Ntott is the total number of individuals in year t and is composed of ASY individuals (NASY), SY individuals (NSY), and immigrants (NImm). SAge, t–1 is the stage-specific survival probability, FAge, t–1 is a product of site fidelity and breeding propensity, and Fledglingst–1 is the estimated number of fledglings produced in the previous year, t–1. We used the following equations to estimate the number of birds in each year, t.
Model specifications for S, F, and fledglings parameters are in the following sections.
Adult survival
To estimate adult survival rates, we developed an age-specific Barker model (Barker 1997), which allowed for independent estimates of age-specific true survival and site fidelity in a Bayesian framework. The age-specific Barker model was represented by a multistate model with 6 states, which jointly described the state process transition model Equation (2) and state observation model Equation (3). Here, the states represent (1) juveniles (local individuals captured as chicks on their natal habitat during occasion t); (2) breeding individuals (adults available for detection on the breeding grounds during occasion t); (3) emigrants (adults that have permanently left the breeding population between occasions t–1 and t); (4) harvested or recovered individuals (individuals that were recovered and reported dead between occasions t–1 and t); (5) undetected mortality (individuals that died or were harvested and not recovered/reported between occasions t–1 and t); and (6) final or absorbing death (died prior to occasion t).
Two states were partially observable, breeding and emigrating Equation (2). True survival is represented by SSY and SASY, and breeding fidelity is represented by FSY and FASY for SY and ASY birds, respectively. Our design also represented several detection parameters. Detection of individuals within the spatial confines of the study system as breeders is represented by p whereas detections of individuals outside of the study system are represented by R. Within a year, both breeding individuals and emigrants can be seen within and outside the study system, but breeding individuals must have been confirmed incubating a nest or brooding chicks within the study area. The probability of being resighted during an off-site period, given a bird died in that period is . Finally, the model contains a recovery parameter (f). Barker models assume that all individuals are available for capture and that observation occurs throughout the area at risk of capture (Barker 1997). Piping Plovers are heavily monitored throughout the breeding range, thus have a high likelihood of being encountered throughout. Piping Plovers are not harvested and band recoveries from dead individuals within our study system are rare; thus, we fixed f to zero in Equation (3), but describe the full model to allow for broader use in other systems.
In Barker models, entry into the study system is conditioned on first capture. Therefore, transitions to the juvenile state, as well as juvenile detection are implicit, and estimation of these parameters is not needed. Similarly, because primary occasions in our application of the model represent breeding seasons, juveniles that survive the winter must transition into adulthood (i.e. breeders or emigrants) and cannot remain as juveniles. For this model, entry into the first age class was conditioned on a chick fledging, and transitions into the second age class occurred during the nesting period of each breeding season. Thus, the survival period for SY was from fledging to the following nesting season (~8 mo), whereas the survival period for ASY represented the entire year between nesting periods.
We defined “on-site” as an individual that was confirmed nesting in a given year. Because site-faithful individuals were all confirmed as breeders, our estimate of fidelity also incorporated breeding propensity, which otherwise would need to be estimated in the population model (Weithman et al. 2017, Catlin et al. 2019). We defined “off-site” as all individuals that were hatched from, or at one time nested in our study area, that were seen anywhere on the Atlantic Coast breeding grounds (North Carolina to Atlantic Canada) during the breeding season (April to September).
We did not allow either of the detection parameters (i.e. p, R) to vary by year or age to reduce model complexity and based on evidence from past estimation of these rates in another study (Weithman et al. 2019). We modeled hatch-year and adult survival as varying by stage, but not year. We did not include individuals newly captured in the final year of the study (2018) in encounter histories.
Nest survival
For nest survival, we used the following logistic exposure model (Equation (4); Rotella et al. 2004, Shaffer 2004, Kozma et al. 2017) to estimate daily nest survival. Logistic exposure models are more flexible in that they allow variation in nest survival compared with the Mayfield method (Shaffer 2004).
In this model, i represents a day, j represents covariates, and β j is the coefficient of covariate j (Rotella et al. 2004). We then raised the daily survival rate to the 34th power to estimate the probability of surviving to hatch (Annual.Nest). We used 34 days because it is the average time from the first laid egg to hatch in Piping Plover nests (Catlin et al. 2015). We included a fixed effect of year as Fire Island nest survival has been shown to vary by year (Weithman et al. 2019). We also calculated the mean clutch size of successful nests (Mean.Clutch), using only clutches that reached a complete clutch, which we defined as at least 4 nest visits (~8 days) with the same egg count.
Pre-fledging chick survival
We estimated chick survival with an adaptation of the Dail-Madsen model, a dynamic N-mixture model, which was originally developed to estimate abundance in open populations (Dail and Madsen 2011). Our adaptation of the model is analogous to the young survival model that has historically been implemented in program MARK (Lukacs et al. 2004), but for a Bayesian framework. The Lukacs model has several assumptions that must be met, and our primary concern was the assumption of no movement of chicks between broods; such movement has been observed in our study (Weithman et al. 2019). Brood mixture, if substantial and unaccounted for, can lead to bias in traditional young survival models (Lukacs et al. 2004). To account for undetected between-brood movement, we included an immigration term to represent undetected mixing among broods. This model assumes that brood immigration is random and the probability of entering a brood is identical to the probability of leaving a brood. Each encounter history was brood-specific and represents the maximum chick count over a 5-day encounter occasion. The resulting estimate from the model is the probability of a single chick surviving each 5-day interval. We then took the product of the 5-day intervals as the probability of surviving to fledge, or 25 days (Annual.Chick). We constrained Nchick,j,1 to be a known quantity, which assumed that we knew how many chicks hatched from a brood either by catching them all in the nest bowl or by observing how many eggs were left in the nest at termination (Equation (5)). Most Piping Plover nests (90%) in our study that hatched had been protected from many predators by encircling with wire fencing topped with blueberry netting (exclosed), so there was little opportunity for partial clutch depredation. The number of individuals in subsequent periods (Nchick,t + 1) was the sum of the number of individuals that survived and were observed from the previous period (Cj,t) and the change in the number of individuals observed between periods (Gj,t; Equation (6)). The model also produced an estimate of the number of chicks alive at any given time, yj,t, which is drawn from a binomial distribution with a mean of the expected number of chicks (N.chickj,t) and the detection probability (count.p.).
We then used the logit of to include fixed effects of year and occasion, where is the probability of survival for brood w at occasion v, the are brood, year, or occasion-specific fixed effects (Equation (7)).
Reproductive output
We estimated annual reproductive output as the product of the average clutch size (Mean.Clutch), nest survival to hatch from the logistic exposure model (Annual.Nest), and chick survival to fledge from the Dail and Madsen (2011) model (Annual.Chick, Equation (8)). The number of fledglings (Fledglingst) then was drawn from a Poisson distribution, with a mean of the number of individuals in the population (), multiplied by 0.5 and reproductive output (). We multiplied the number of individuals by 0.5 as we were estimating population size in the state-space model, but reproductive output was on a per-pair basis.
Immigration, emigration, and lambda
We estimated the number of emigrants of each class, using the number of individuals in the year prior, age-specific survival, and age-specific fidelity estimates (Equations (9) and (10)).
We estimated annual immigration rate (Equation (11)) and natal recruitment rate (Equation (12)), using the total number of individuals in the year prior and the current year’s estimated number of immigrants or number of natal recruits, respectively.
We estimated population growth rate from one year to the next (λ) by summing the number of adults surviving from the year prior, the number of natal recruits that had returned to breed in that year, and the number of adult immigrants (Equation (1)), and dividing the number of individuals in year t by the number of individuals in year t–1 (Equation (13)). We also calculated the geometric mean of population growth for the entire study length.
To understand which parameter contributed most to population change, we calculated the correlations between estimated annual population growth rate and chick survival, nest survival, reproductive output, and the number of immigrants (Schaub et al. 2013, Saunders et al. 2018). We evaluated the posterior mean, credible intervals, and the probability that the correlation would be different from zero to assess each value’s contribution to population change. While the datasets within the IPM are inherently linked, as our model and datasets are based on a closely monitored subset of the total Atlantic Coast population, an earlier study determined that there is little bias in using dependent datasets (Abadi et al. 2010).
Incorporating restoration areas
To estimate the effect of the restoration areas on annual population change, we incorporated the restoration areas into models through fixed effects (whether an individual or nest was associated with a restoration area) on nest survival, chick survival, and breeding fidelity. Each model had a single parameter estimate for the effect of restoration area. We considered a nest or chick in a restoration area if they were within the boundaries of the created restoration area (nest) or hatched from a restoration area (chick). For the chick and nest survival models, we included a nest-specific vector that indicated whether a nest was in a restoration area and a brood-specific vector that indicated whether a brood was hatched in a restoration area. For adult and juvenile fidelity, we assigned adults to the restoration area group if they were confirmed as incubating a nest in a restoration area in a given year, and we assigned fledglings to the restoration area group if they hatched in a restoration area. For adult fidelity, we created an individual × year matrix that indicated whether a bird was originally hatched from or nested in a restoration area during the breeding season in a given year, for SY and ASY fidelity, respectively.
To estimate population growth in the years when restoration areas were available (2015–2018), we estimated lambda for the number of individuals nesting in restoration areas and compared it with lambda for the number of individuals in the rest of the study area, excluding the restoration areas. We derived restoration area-specific fidelity, nest survival, and chick survival rates by using the mean estimate and adjusting for the vital rate-specific restoration area model coefficient. We also estimated the number of adults and natal recruits in year t that were from the restoration areas in year t–1 and what proportion of the total population they comprised.
All models were built and implemented in a Bayesian framework, using the jagsUI package to call JAGS 4.3.0 in R 3.5.2 (Kellner 2018, R Core Team 2018). We ran 3 chains for 200,000 iterations and discarded the first 50,000 iterations as a burn-in, retaining every fifth iteration. We used vague priors for all estimated parameters (Supplementary Material). We assessed model fit diagnostics by visually inspecting chains and assuring convergence ( was reached (Gelman and Rubin 1992). We present estimates using the mean of the posterior distributions and the 95% Bayesian credible intervals. Model code can be found in the Supplementary Material.
RESULTS
Population Change
Annual pairs monitored varied from 32 to 58 over the study period (Figure 3, Appendix Table 4). The IPM estimated that the Piping Plover population on Fire Island increased from 64 individuals immediately following Hurricane Sandy in 2013 to 115 (CI: 96–136) individuals in 2018. These estimates correspond to what we observed in our population over the 6 yr of the study (Figure 3). The geometric mean population growth rate for the study area ( = 1.13, CI: 1.06–1.20) indicated mean annual growth rates of 13%. Growth rate varied among years, and most growth occurred following 2016 (Figure 3). In each year, the population was composed primarily of adults that survived from the previous year, and a similar number of immigrants (Table 1, Figure 4, Appendix Table 5). The smallest proportion of individuals consistently was natal recruits (Appendix Table 5). The immigration rate ranged from 0.36 to 0.55 immigrants per resident in t–1, and the natal recruitment rate was 0.046–0.25 recruits per resident in t–1 and was highest following years of higher reproductive output (Table 2). The number of individuals emigrating from the population to breed elsewhere varied among years. The number of breeding adults that emigrated from the population was less variable (12–17 individuals, 18.6% of adults in year t–1) than the number of juveniles that did not return to breed in their first breeding season (4–29 individuals, 41.4% of fledglings in year t–1; Figure 4).
Year-specific population size and composition estimated from an integrated population model fit to Piping Plover data from Fire Island and Westhampton Island, New York, 2013–2018. Values presented are the mean ± standard deviation. N = number of individuals, Imm = immigrants, and tot = total number of individuals in the breeding population. SY indicates birds in their first breeding season and ASY represents after second-year birds, ≥1 yr post-hatch. Stage nomenclature is associated with age of breeding individuals.
| Year | Ntot | NSY | NASY | NImm | NSY, emigrants | NASY, emigrants |
|---|---|---|---|---|---|---|
| 2013 | 64 | – | – | – | – | – |
| 2014 | 65 ± 12 | 3 ± 2 | 34 ± 6 | 28 ± 10 | 4 ± 2 | 12 ± 3 |
| 2015 | 70 ± 13 | 11 ± 4 | 34 ± 6 | 23 ± 10 | 17 ± 6 | 12 ± 3 |
| 2016 | 76 ± 12 | 5 ± 3 | 36 ± 6 | 34 ± 10 | 7 ± 3 | 13 ± 3 |
| 2017 | 92 ± 13 | 19 ± 5 | 40 ± 7 | 33 ± 12 | 29 ± 7 | 14 ± 4 |
| 2018 | 114 ± 14 | 17 ± 5 | 49 ± 7 | 50 ± 13 | 25 ± 6 | 17 ± 4 |
Year-specific demographic rates estimated from an integrated population model fit to Piping Plover data from Fire Island and Westhampton Island, New York, 2013–2018. Values presented are the mean ± standard deviation.
| Year | Nest success | Chick survival | Reproductive output | Lambda | Immigration rate | Natal recruitment rate |
|---|---|---|---|---|---|---|
| 2013 | 0.46 ± 0.12 | 0.19 ± 0.06 | 0.34 ± 0.14 | – | – | – |
| 2014 | 0.54 ± 0.11 | 0.62 ± 0.08 | 1.30 ± 0.31 | 1.03 ± 0.18 | 0.46 ± 0.19 | 0.05 ± 0.03 |
| 2015 | 0.34 ± 0.07 | 0.41 ± 0.07 | 0.53 ± 0.14 | 1.06 ± 0.17 | 0.36 ± 0.18 | 0.17 ± 0.07 |
| 2016 | 0.80 ± 0.07 | 0.61 ± 0.05 | 1.87 ± 0.22 | 1.12 ± 0.18 | 0.52 ± 0.19 | 0.07 ± 0.04 |
| 2017 | 0.61 ± 0.06 | 0.57 ± 0.04 | 1.35 ± 0.18 | 1.24 ± 0.18 | 0.46 ± 0.18 | 0.25 ± 0.08 |
| 2018 | 0.71 ± 0.06 | 0.73 ± 0.04 | 1.97 ± 0.19 | 1.27 ± 0.17 | 0.55 ± 0.17 | 0.18 ± 0.06 |
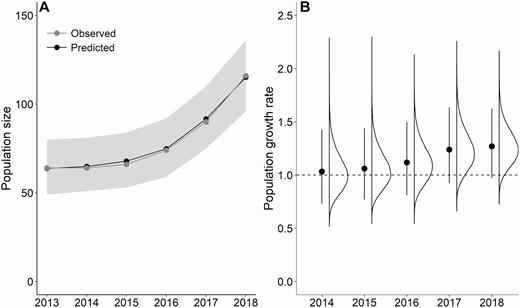
(A) Estimated annual population size and (B) growth rate for a population of Piping Plovers on Fire Island and Westhampton Island, New York. Estimates are from a state-space model within an integrated population model. The gray shaded area in panel (A) represents the 95% credible intervals on the predicted population size for each year. The points and error bars in panel (B) represent the mean and 95% credible intervals, with the associated posterior distribution to the right. Mean population growth rate ranged from 1.03 to 1.27. The dashed line at 1.0 in panel (B) represents no population growth.
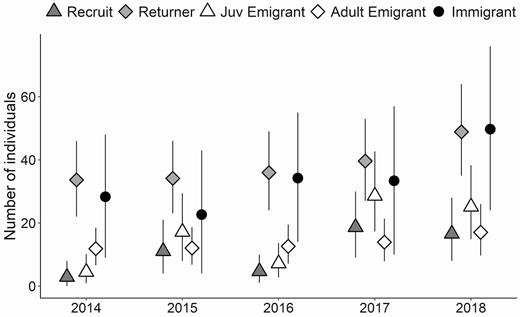
Number of each class of Piping Plovers predicted to be in the population (Recruits, Returners, and Immigrants) and the number of emigrants of each stage class (Juv Emigrants and Adult Emigrants) each year following the first year of a study on Fire Island and Westhampton Island, New York, estimated using an integrated population model. Recruits hatched in the study and returned to nest the following year, returners bred in the study area prior, and immigrants were new to the breeding population. Juvenile (Juv) emigrants hatched in the study area and survived but did not breed in our study area the following year, and adult emigrants bred in our study in the year prior and survived but did not breed in our study area the following year.
Adult Survival and Fidelity
During 2013–2018, we captured and banded 152 adult Piping Plovers and 353 chicks. Mean adult true survival was 0.72 (CI: 0.64–0.79), and juvenile post-fledging true survival was similar to adult survival at 0.68 (CI: 0.57–0.80). Breeding fidelity for ASY adults was 0.74 (CI: 0.64–0.83) and 0.40 (CI: 0.29–0.51) for SY adults. The probability of detecting a living bird on the breeding grounds as a breeder in any year, given that it was present, was 0.88 (CI: 0.80–0.95).
Reproductive Output
During 2013–2018, we monitored 279 nests and 160 broods. The average clutch size was 3.84 (CI: 3.78–3.90). Nest survival varied from 0.34–0.80 (Table 2). Chick survival also was variable among years, 0.19–0.73, with the lowest year being the first year of the study and the highest year being the final year (Table 2). Nest survival and chick survival estimates had similar trends to field observations (Appendix Table 6). The brood immigration parameter, which was developed to estimate undetected between-brood movement, was 0.008 (CI: 0.002–0.019), suggesting that ~1 chick out of every 125 switched broods during a 5-day time step. The first year of the study had the lowest reproductive output (0.34 chicks/pair, CI: 0.13–0.66), and the final year had the highest (1.97 chicks/pair, CI: 1.59–2.34; Table 2).
Correlations Among Parameters
Of the parameters that contributed to population change on Fire Island, we estimated that the number of immigrants (r = 0.92, CI: 0.22–0.98) and reproductive output (r = 0.84, CI: –0.47 to 0.95) had the highest correlation with population change (Appendix Table 7). However, 23.5% of the posterior distribution of lambda’s correlation with reproductive output was less than 0, whereas only 2.3% of immigration’s correlation with lambda was less than 0, suggesting that immigration was more influential than reproductive output.
Restoration Areas
During 2015–2018, the restoration areas supported 3–8 pairs (8.3–13.8% of total pairs). Of all the nests monitored during these years, 29 were in restoration areas (10.4% of total nests), from which we monitored 49 chicks (13.9% of total chicks) from 14 broods (8.8% of total broods).
A nest being in a restoration area had a negative effect on nest survival to hatch compared with the rest of the study area (β nest = –0.65, CI: –1.40 to –0.04; Figure 5A). However, the restoration areas had higher chick survival (β chick = 0.84, CI: 0.09–1.74; Figure 5B) than the rest of the study area. Reproductive output in the restoration area was similar to the rest of the study area (Figure 5C). ASY fidelity was lower for restoration area birds (β F, ASY = –1.52, CI: –2.73 to –0.29) than the rest of the study area. There was evidence of lower SY fidelity for restoration area birds than birds in the rest of the study area but the credible interval incorporated zero (β F, SY = –0.67, CI: –2.08 to 0.64; Figure 5D).
Demographic estimates—(A) nest survival, (B) chick survival, (C) reproductive output, and (D) breeding fidelity—from an integrated population model estimating the effect of restoration areas on Piping Plover population change on Fire Island and Westhampton Island, New York, 2013–2018. The restoration areas were built between the 2014 and 2015 breeding seasons, so restoration area estimates are from 2015–2018. Points and error bars represent the mean and 95% credible intervals, with associated posterior distribution to the right. Posterior distributions for reproductive output (C) in 2015 nearly overlap completely for the restoration and non-restoration areas.
Restoration areas contributed an estimated 7–12% of the total natal recruits that entered the population during 2016–2018, and 6–9% of the adults that survived and remained in the study area to breed (Table 3). Mean lambda for the restoration areas was 1.14 (CI: 0.89–1.48) and was similar to lambda for the rest of the study area ( = 1.09, CI: 1.04–1.16), although the credible intervals around the mean population growth rate for the restoration areas overlapped one. Estimates of population growth in the restoration areas were more variable than the rest of the study area in the years following their construction (Figure 6).
Number of individuals per age class, in the whole study area that were estimated to have originated from the study area without the restoration areas (top), and from within the restoration areas (bottom). Estimates are from an integrated population model using Piping Plover data from Fire Island and Westhampton Island, New York, 2013–2018. The restoration areas were built between the 2014 and 2015 breeding seasons, and were created to mimic natural Piping Plover habitat, mitigating for potential habitat degradation following island stabilization efforts. Values reported are mean ± standard deviation. N = number of individuals, Imm = immigrants, and tot = total number of individuals in the breeding population. SY indicates birds in their first breeding season and ASY represents after second-year birds, ≥1 yr post-hatch. Stage nomenclature is associated with age of breeding individuals.
| Year | Ntot | NSY | NASY | NImm | NASY, emigrants | NSY, emigrants |
|---|---|---|---|---|---|---|
| Study Area Minus Restoration Area | ||||||
| 2014 | 63 ± 7 | 4 ± 3 | 35 ± 6 | 24 ± 10 | 11 ± 3 | 6 ± 3 |
| 2015 | 58 ± 7 | 14 ± 5 | 33 ± 5 | 11 ± 8 | 11 ± 3 | 22 ± 6 |
| 2016 | 68 ± 6 | 7 ± 3 | 32 ± 6 | 29 ± 9 | 10 ± 3 | 10 ± 4 |
| 2017 | 79 ± 6 | 19 ± 5 | 37 ± 6 | 23 ± 10 | 12 ± 3 | 28 ± 6 |
| 2018 | 100 ± 7 | 18 ± 5 | 43 ± 6 | 39 ± 11 | 14 ± 3 | 26 ± 6 |
| Restoration Areas | ||||||
| 2016 | 7 ± 2 | 1 ± 1 | 3 ± 2 | 4 ± 3 | 5 ± 2 | 3 ± 1 |
| 2017 | 13 ± 3 | 1 ± 1 | 2 ± 2 | 9 ± 4 | 3 ± 1 | 4 ± 2 |
| 2018 | 17 ± 4 | 2 ± 2 | 4 ± 2 | 11 ± 5 | 5 ± 2 | 5 ± 2 |
Comparison of Piping Plover population growth rate for Fire Island and Westhampton Island, New York, in non-restoration areas (2013–2018) and restoration areas (2015–2018) derived from an integrated population model. Restoration area estimates are only shown following the 2015 breeding season as the restoration areas were built between the 2014 and 2015 breeding seasons. Points and error bars represent the mean and 95% credible intervals, with associated 99% posterior density interval to the right. The dashed line at 1 represents no population growth.
DISCUSSION
Restoration Areas
Using an integrated population model, we decomposed the demographic contributions to population change on Fire Island following Hurricane Sandy and the creation of restoration areas. Built restoration areas, constructed in previously unsuitable or less suitable habitat, had lower nest survival (–9 to –46%) and higher chick survival (17 to 45%), which resulted in reproductive output similar to the rest of the study area. In addition, population growth in the restoration areas was similar to growth in the rest of the study area. However, adults nesting in the restoration areas had a lower probability of returning to the study area. Other Piping Plover studies have reported similar trends, with populations responding positively to natural and artificial habitat creation in riverine (Catlin et al. 2015, Hunt et al. 2018) and barrier island systems (Boettcher et al. 2007, Cohen et al. 2009, Robinson et al. 2019). The positive demographic trends in the restoration areas were driven by the Great Gun restoration area. This area was considerably larger than the other area, and vegetation there was removed rather than covered, slowing vegetation regrowth (Bellman 2018). The smaller restoration area, New Made, was adjacent to a marsh and quickly was overgrown by P. australis, limiting access to foraging habitat (Zeigler et al. 2019). New Made also was narrower and located north of a road, so after foraging habitat in the area was overgrown, chicks needed to cross a sand road and 2 dunes to reach ocean intertidal foraging habitat. The lower site fidelity of restoration area birds could be related to lower nest survival, but it also could be due to the proximity of Great Gun to the eastern border of the study area. An adult from Great Gun would have needed to move only 2–3 km east to leave the study area, and throughout the study several banded birds from the study area were found in neighboring management areas. Although small sample sizes precluded assessing the 2 restoration areas separately, models for specific demographic parameters (i.e. nest or chick survival) can be used in the future to understand what habitat or geographic features of the restoration areas led to higher demographic rates.
While the creation of the restoration areas in our study corresponded with the increase in the Piping Plover population, the increase also paralleled a decline in the local red fox population during a sarcoptic mange outbreak (Robertson et al. 2019). Red foxes are known nest and chick predators (Ivan and Murphy 2005). The influence of foxes on Fire Island Piping Plovers, and responding site-specific management, was particularly notable in 2015 and 2018, when nesting exclosures were either omitted or removed due to foxes cuing in on exclosures. Despite the potentially lowered nest survival due to these decisions, to exclose nests or not often involves the tradeoff between adult survival and reproductive output (Barber et al. 2010, Beaulieu et al. 2014, Cohen et al. 2016). In other words, if exclosures increase adult predation risk, that can have a greater effect on overall population growth and persistence than the loss of a single nest (Cohen et al. 2016). Decisions in 2015 and 2018 to remove, or not place exclosures, despite few nests being affected, may have resulted in the negative mean effect of restoration areas on nest survival. Alternatively, chick survival may have been higher in the restoration areas due to lower nesting densities (Bellman 2018), leading to decreased conspecific competition, or lower detection rates by predators. Studies of local predator density coupled with the effect of restoration areas may assist in distinguishing the ultimate cause of the population increase, as there may be an interaction between restoration areas and predator abundance or density.
Restored habitat is widely used across the Piping Plover range (Burger and Tsipoura 2019), and past evaluations of habitat restoration suggest it can be successful (McIntyre and Heath 2011, Maslo et al. 2012, Catlin et al. 2015). Habitat for nesting shorebirds can be generated in a variety of ways, such as by restoring existing nesting habitat through the removal of vegetation, creating foraging habitat, and by modifying the geomorphic structure of the landscape for nesting and foraging (Powell and Collier 2000, Maslo et al. 2012, Catlin et al. 2015). Large-scale natural processes that restore natural system function may be more effective than engineered habitat creation (Hunt et al. 2018, Walker et al. 2019). Although we saw positive population growth and adequate reproductive output in the restoration areas, not all population increase in this study was derived from the restoration areas, indicating the additional importance of natural habitat creation and protection.
Population Change
The Piping Plover population in our study area increased over the 6 yr of our study, as detected in our raw pair counts and model estimates. The increase in the number of pairs following the natural disturbance of Hurricane Sandy likely resulted from both a localized increase in sparsely vegetated nesting habitat from storm surges overwashing previously vegetated sand and the creation of sparsely vegetated restoration areas. Piping Plovers, like other Charadrius plovers, evolved to blend in with sandy habitats to avoid detection by predators and improve survival (Knetter et al. 2002, Roche et al. 2012, Farrell et al. 2018, Fraser and Catlin 2019). Thus, wide open sandy habitat assists in predator avoidance (Troscianko et al. 2016). An increase in dry sand also can increase the available habitat for birds to settle in, allowing more pairs to fit into spaces that were previously unsuitable. Fire Island and Westhampton Island both experienced an increase in access to low wave-energy moist habitats following Hurricane Sandy (Walker et al. 2019), which is selected for by Piping Plovers for higher quality forage and may have led to higher survival to fledging, reproductive output, and density (Le Fer et al. 2008).
Coincident with the 90% increase on Fire Island, the remainder of the New York Piping Plover population increased up to 29% (from 257 to 332 pairs) following Hurricane Sandy and had relatively high reproductive output during 2014–2017 (USFWS 2018). The entirety of the Atlantic Coast population increased up to 7.8% during this time (1,793 to 1,932 pairs), although the peak occurred in 2016 (USFWS 2018) while the Fire Island population continued to grow. This corresponding increase is suggestive of some degree of population synchrony (Roche et al. 2016), possibly due to increased available habitat created by Hurricane Sandy at other sites, and reproductive output and emigration at other sites associated with this regional increase may have been the source for the immigrants in our study area. However, other surrounding states, such as New Jersey, did not have a population increase but did have reasonably high reproductive output, and some New Jersey individuals were confirmed to have immigrated into our population (USFWS 2018, M. Stantial personal communication). Understanding the effect of the disturbance event of Hurricane Sandy on the regional population and analyzing these data at broader scales may provide additional information about population-level effects and whether immigration and emigration are significant to Piping Plovers at broader scales.
Immigration and Fidelity
The IPM indicated that immigration was the demographic variable most highly correlated with population growth. Individuals that immigrated may have previously nested just outside of our relatively small study area (Robinson et al. 2019), may have been SY individuals dispersing from their natal sites, or ASY individuals dispersing from anywhere in the Atlantic breeding range. Piping Plovers are highly philopatric, therefore most immigrants likely originated in nearby populations (Friedrich et al. 2015). Thus, even though habitat was created locally, population change on Fire Island was also mediated by the production of individuals elsewhere in the region to immigrate into the new habitat. Natal recruits made up a much smaller part of the population and, like immigration rate, recruitment rates were variable. Natal recruitment may vary by individual pre-fledging body condition, hatch date, and local density (Thompson et al. 1994, Anteau et al. 2014, Catlin et al. 2014, Saunders et al. 2014), and, as we observed in this study, is expected to be lower than adult retention due to natal dispersal (Paradis et al. 1998, Amirault-Langlais et al. 2014). Reproductive output was also correlated with population growth and provides the source of natal recruits in the following year. Thus, management for reproductive output in areas with new habitat, possibly by reducing predation or improving access to foraging habitat, is needed for continued population growth (Robinson 2020).
While estimates of fidelity, recruitment, immigration, and emigration rates are important, model-based estimates are functions of the spatial scale of investigation, because we define the spatial and temporal conditions associated with the terms. Therefore, these estimates have a mixture of biological and human-derived constraints, and care should be taken when interpreting them, and comparing among explicit values. For example, remaining close to Fire Island, but not within the boundaries of our study site, birds may still have site fidelity to the “breeding population” rather than our study area, and thus, the terminology of what is considered site-faithful is important when comparing among studies. The effect of spatial scale would be especially evident at the boundaries of our relatively small site, as a bird could become an emigrant if it moved a few hundred meters east or west out of the study area. Fire Island site fidelity estimates were lower than past studies (Cohen and Gratto-Trevor 2011, Catlin et al. 2015), but we suspect this is because to be considered as “on-site”, individuals had to be confirmed breeders, therefore this estimate incorporated breeding propensity, which may not be 100% (Saunders et al. 2014, Weithman et al. 2017, Catlin et al. 2019). Many adults passed through the study area throughout the breeding season and did not remain to breed. Thus, depending on how “on-site” is considered, those birds, in other estimates, would be considered faithful even if they did not contribute to the breeding population. Instead, including only the birds that are known to have nested, even if some individuals are missed, focused the model on breeding birds and, in the absence of estimates of breeding propensity, likely led to a more accurate estimation of the number of individuals in each stage class contributing to population growth, particularly immigrants.
Some models that estimate population change assume that immigration is equal to emigration, which we have shown to be inaccurate in this increasing population (Schaub et al. 2013; Figure 4). However, equality of the 2 vital rates may be more likely if the population is stationary or if the study site encompasses a larger area. With expanding Piping Plover population marking and monitoring, we are increasingly able to detect the movement of individuals. We have confirmed immigration into our population from birds banded in New Jersey (~150 km) and emigration from our population to Connecticut, Delaware, Rhode Island, New Jersey, and North Carolina, illustrating the importance of dispersal among Atlantic Coast states (Haig and Oring 1988a, Plissner and Haig 2000). The correlation between immigration and population change suggests that for this population to continue increasing, the surrounding populations also need to be producing dispersing young or adults. Furthermore, for immigration and reproductive output to continue to have positive effects on population growth, there needs to be available nesting habitat for the incoming birds. The relationship between population change and immigration has interesting implications for Piping Plover metapopulation dynamics that have been repeatedly observed at regional (Catlin et al. 2016, Roche et al. 2016) and continental (Plissner and Haig 2000, Wemmer et al. 2001) scales. Our results confirm the importance of maintaining linkages between discrete breeding populations at local and regional scales, and highlight potential synchrony among Piping Plover breeding sites. To better understand what is occurring at a single site, we also need to understand regional patterns (Roche et al. 2016).
The extent to which the latent, indirectly estimated, parameter (i.e. immigration in this application) is fully identifiable in IPMs is context-dependent and primarily driven by violations of model assumptions that can lead to erroneous estimates of other parameters (e.g., marker loss or heterogeneous mortality; Schaub and Fletcher 2015, Riecke et al. 2019). Low sample size in the restoration areas during this study (2–8 pairs) also could have clouded inference, and can be seen in the wide credible intervals in lambda estimates from these sites. However, Bayesian methods, assuming that prior distributions are properly specified, are generally better suited for dealing with small sample size problems than frequentist methods (McNeish 2016). Furthermore, given that much of this population was marked in each year, and sites are monitored with enough frequency to ensure detection, we have been able to corroborate the estimates from the model with empirical observations. Given our ability to effectively monitor all nesting activity, as well as to mark and identify most breeding adults and nearly every chick that hatched within the study system, combined with high rates of detection of marked individuals outside the study system, it is unlikely that the immigration rates reported in this manuscript were primarily driven by other sources of model variation.
CONCLUSION
Future use of this model, or the models within, can help managers understand the effect of habitat, weather, or other factors on the components of population change. We need more data to understand the relationship between these factors and population growth, but this model will easily allow incorporation of extra years of data or inclusion of additional sites. Without a time series that captures a decline or stabilization in population size, in addition to observed changes in predator dynamics, it would be particularly challenging to use these data to forecast into the future. This model, which explicitly incorporates the components of reproductive output, which are regularly collected with high degrees of precision, can also be used as a tool for managing many bird populations, particularly ones which are heavily monitored (e.g., Piping Plovers, Western Snowy Plovers [Charadrius alexandrinus nivosus], Hooded Plovers [Thinornis rubricollis]). Nest and chick survival are routinely estimated for plovers, and our young-survival parameterization of the Dail-Madsen model could easily be replaced with a Cormack Jolly Seber model for studies with regular resighting of individual chicks (Hunt et al. 2013, 2018, Weithman et al. 2019).
Monitoring populations following widespread disturbance-driven landscape changes can assist in the understanding of population change and directing future management. We found that restoration areas had increasing numbers of Piping Plover pairs, similar to other habitat on the island, as the rest of the population increased. Therefore, restoration areas may be an effective way to promote Piping Plover populations on the Atlantic Coast, particularly if predictions of use are updated as new information becomes available. As is to be expected with early successional habitats, both restoration areas had increasing vegetation cover over time, although revegetation rates have differed, likely due to differences in construction techniques (Bellman 2018). As vegetation continues to grow and the time since Hurricane Sandy increases, vegetation removal will be required across our study site to maintain open, sparsely vegetated sand. That we found immigration to have the greatest correlation with population growth highlights the importance of regional management and cooperation among managing agencies to improve the population persistence on Fire Island and the entire Long Island area. Efforts to improve overall reproductive output are likely to only affect population growth if there is suitable habitat to support new individuals. Regional management to improve reproductive output, thus producing potential immigrants, also will help to sustain this population. We expect that the population will continue to increase provided habitat remains for new immigrants and natal recruits.
ACKNOWLEDGMENTS
We acknowledge the U.S. Fish and Wildlife Service, the U.S. Army Corps of Engineers, the National Park Service, Suffolk County Parks, and New York State Park for permission to work on their property and for support during this study. In particular, we would like to thank S. Papa, R. Smith, P. Weppler, L. Reis, A. McIntyre, N. Gibbons, and D. Lynch for the on the ground support. We would also like to thank K. Thyberg, A. Thyberg, J. Papajohn, A. Pachomski, and many others for coordinating with us and providing off-site resights of banded birds elsewhere on the breeding grounds. We thank A. Hecht, 2 anonymous reviewers, the Associate Editor, and Editor-in-Chief for reviewing and improving earlier versions of this manuscript. We thank D. Fraser, M. Friedrich, K. Hunt, S. Ritter, and C. Weithman for logistical and technical support. Finally, we would like to extend special gratitude to all of the technicians who helped collect these data in the field.
Funding statement: Funding for this study was provided by the U.S. Army Corps of Engineers to the U.S. Fish and Wildlife Service under the Fire Island to Moriches Inlet Biological Opinion, the U.S. Fish and Wildlife Service, and by Virginia Tech.
Ethics statement: This research was conducted under Virginia Tech Institutional Animal Care and Use Committee protocols #14-003 and #16–244, U.S. Geological Survey Federal Bird Banding permit #21446, U.S. Fish and Wildlife Service Endangered Species permit #TE-697823, U.S. National Park Service Scientific Research and Collecting permits FIIS-2013-SCI-002, FIIS-2015-SCI-0011, FIIS-2016-SCI-0003, FIIS-2017-SCI-0004, and FIIS-2018-SCI-0004, New York State Department of Environmental Conservation Endangered Species permit #314, New York State Office of Parks, Recreation and Historic Preservation permits 15–0700, 16–0393, 17–0755, and 18–0168, and permits for Research in Suffolk County Parklands.
Author contributions: S.G.R. wrote the manuscript. S.G.R. and D.G. analyzed the data, and T.V.R. provided substantial analytical support. D.H.C., J.D.F., and S.M.K. conceived and designed the study and secured funding. S.G.R., H.A.B., A.D., and K.M.W. supervised and conducted fieldwork and collected data. D.G., D.H.C., J.D.F., T.V.R., and S.M.K. substantially edited the manuscript.
Data depository: Analyses reported in this article can be reproduced using the data provided by Robinson et al. (2020).
LITERATURE CITED
Raw data regarding the number of Piping Plover pairs, breeding and nonbreeding individuals in Barker capture history, number of nonbreeding individuals observed on study site, number of unbanded nesters, New York population size (pairs), and Atlantic Coast population size (pairs). N nonbreeders indicates the number of individuals in our capture histories that were not confirmed as breeders. N nonbreeders on study site is a subset of those individuals that were observed in our study area, as nonbreeders could also be seen at other breeding sites.
| Year | N pairs | N breeders (individuals) | N nonbreeders (individuals) | N nonbreeders on study site | N unbanded | New York population | Atlantic Coast population |
|---|---|---|---|---|---|---|---|
| 2013 | 32 | 28 | 0 | 0 | 4 | 289 | 1793 |
| 2014 | 32 | 34 | 7 | 5 | 2 | 286 | 1779 |
| 2015 | 33 | 54 | 8 | 4 | 6 | 308 | 1871 |
| 2016 | 36 | 65 | 26 | 16 | 5 | 381 | 1932 |
| 2017 | 45 | 83 | 47 | 29 | 5 | 392 | 1903 |
| 2018 | 58 | 106 | 46 | 29 | 2 | 390 | 1879 |
Year-specific proportional population composition estimated from an integrated population model fit to Piping Plover data from Fire Island and Westhampton Island, New York, 2013–2018. Values presented are the mean ± standard deviation. SY indicates birds in their first breeding season and “ASY” represents after second-year birds, ≥1 yr post-hatch. Stage nomenclature is associated with age of breeding individuals.
| Year | Proportion SY | Proportion ASY | Proportion Immigrants |
|---|---|---|---|
| 2013 | – | – | – |
| 2014 | 0.05 ± 0.03 | 0.53 ± 0.11 | 0.43 ± 0.12 |
| 2015 | 0.16 ± 0.07 | 0.51 ± 0.10 | 0.33 ± 0.13 |
| 2016 | 0.06 ± 0.04 | 0.49 ± 0.10 | 0.45 ± 0.11 |
| 2017 | 0.21 ± 0.06 | 0.44 ± 0.08 | 0.36 ± 0.11 |
| 2018 | 0.14 ± 0.05 | 0.43 ± 0.07 | 0.43 ± 0.09 |
Raw observed field data from Piping Plover monitoring on Fire Island and Westhampton Island, New York, 2013–2018. In 2013 and 2014, we did not monitor Robert Moses State Park or the Fire Island Lighthouse Beach, the western sites in the study (Figure 1). Raw reproductive output is the number of fledglings we observed (# fledged) divided by the number of pairs we observed in the field.
| Year | Number of nests monitored | Number of eggs hatched | Raw nest success | Number of chicks monitored | Number of chicks fledged | Raw chick success | Raw reproductive output |
|---|---|---|---|---|---|---|---|
| 2013 | 20 | 11 | 0.55 | 40 | 9 | 0.23 | 0.47 |
| 2014 | 20 | 11 | 0.55 | 43 | 24 | 0.56 | 1.14 |
| 2015 | 48 | 16 | 0.33 | 46 | 13 | 0.28 | 0.39 |
| 2016 | 40 | 33 | 0.83 | 109 | 63 | 0.58 | 1.75 |
| 2017 | 61 | 40 | 0.66 | 135 | 70 | 0.52 | 1.44 |
| 2018 | 68 | 50 | 0.74 | 183 | 117 | 0.64 | 1.98 |
Correlation coefficients between population growth rate and parameters from an integrated population model developed for Piping Plovers on Fire Island and Westhampton Island, New York, during 2013–2018.
| Parameter | Correlation coefficient | Lower 95% credible interval | Upper 95% credible interval | Probability of positive correlation |
|---|---|---|---|---|
| Number of immigrants | 0.921 | 0.219 | 0.982 | 0.977 |
| Reproductive output | 0.836 | –0.469 | 0.953 | 0.765 |
| Nest survival | 0.780 | –0.506 | 0.946 | 0.738 |
| Chick survival | 0.664 | –0.557 | 0.941 | 0.730 |
