


Abstract
We reconstructed the phylogeny and estimated mitochondrial DNA diversity to assess levels of divergence and population structure in the Black-spotted Barbet complex. This complex consists of three Amazonian taxa: Capito niger, C. auratus, and C. brunneipectus. Sequence divergence between these taxa is relatively high and all are monophyletic, which is consistent with the classification of these taxa as distinct species. Within C. auratus, a relatively deep split in the gene tree yields two reciprocally monophyletic groups separated by the Amazon, Solimões, and Ucayali Rivers. Apparently, these rivers serve as an effective barrier to mtDNA gene flow between these populations of C. auratus. Carotenoid plumage coloration did not contain phylogenetic information for this group and several subspecies of C. auratus named on the basis of such coloration were not monophyletic based on mtDNA comparisons. However, mtDNA variation suggests that C. auratus contains at least two evolutionarily significant units which might indicate two geographically separate species-level taxa.
Variación Geográfica en las Secuencias de ADN Mitocondrial de un Ave no Paserina Amazónica: el Complejo de Capito niger
Resumen. Reconstruimos la filogenia y estimamos la diversidad de ADN mitocondrial del complejo de Capito niger para evaluar los niveles de divergencia y la estructura poblacional. Este complejo consiste en tres taxa amazónicos: Capito niger, C. auratus y C. brunneipectus. La divergencia en las secuencias entre estos taxa es relativamente alta y todos son monofiléticos, lo cual concuerda con la clasificación de estos taxa como especies distintas. Dentro de C. auratus, el árbol génico tiene una división relativamente profunda en dos grupos recíprocamente monofiléticos que están separados por los ríos Amazonas, Solimões y Ucayali. Aparentemente, estos ríos sirven como una barrera eficaz que impiden el flujo genético de ADN mitocondrial entre estas poblaciones de C. auratus. La coloración carotenoide del plumaje no proveyó información filogenética para este grupo, y varias subespecies de C. auratus nombradas con base en este tipo de coloración no fueron monofiléticas según comparaciones de ADN mitocondrial. Sin embargo, la variación de ADN mitocondrial sugiere que C. auratus contiene por lo menos dos unidades evolutivas, las cuales podrían ser dos especies geográficamente separadas.
Introduction
Studies of geographic variation in mitochondrial DNA (mtDNA) sequences from Amazonian birds show that Amazonian biogeographic history is complex and that no single pattern, and probably no single mechanism, underlies the diversity of birds in this region (Marks et al. 2002, Aleixo 2002a). Marks et al. (2002) noted that each new study of geographic variation in Amazonia seems to have its own idiosyncrasies, with patterns of genetic variation differing from those found in other studies. Although comparisons of widespread, sympatric taxa should help us to gain a better understanding of the general biogeographic patterns in the Amazon, all currently published studies of mtDNA geographic variation in Amazonian birds have concentrated on suboscine passerines including Drymophila and Hypocnemis (Thamnophilidae, Bates et al. 1999), Hemitriccus (Tyrannidae, Cohn-Haft 2000), Glyphorynchus (Dendrocolaptidae, Marks et al. 2002), and Xiphorhynchus (Dendrocolaptidae, Aleixo 2002a, 2002b). Such studies have shown that within several biological species of Amazonian suboscine passerines multiple distinct evolutionary lineages occur, suggesting that current species-level taxonomy has underestimated the diversity of these Amazonian birds (Bates et al. 1999). However, population-level genetic variation in Amazonian nonpasserine birds has not been described previously. Here, we present one of the first assessments of genetic variation in a nonpasserine species complex that inhabits Amazonian forests.
The Black-spotted Barbet complex (Ramphastidae: Capitoninae) consists of a set of allopatric taxa that inhabit humid lowland terra firme forests of the Amazon Basin (Chapman 1928, Haffer 1997, Lane 1999). This group was originally described as three different species, the Black-spotted Barbet (Capito niger; Müller 1776), the polytypic Gilded Barbet (C. auratus; Dumont 1816), and the Cinnamon-breasted Barbet (C. brunneipectus; Chapman 1921), but later were combined into a single, polytypic species (Capito niger) due to similarities in plumage and an allopatric distribution of the different forms (Ripley 1945, Peters 1948, Meyer de Schauensee 1966). More recently, Short and Horne (2001, 2002) recognized C. brunneipectus as a distinct species based on plumage and vocalization differences. However, they hesitated to split C. auratus from C. niger because of the similarity of plumage in these two taxa. Others, however, have recommended splitting C. auratus and C. niger because their vocalizations are distinctly different, whereas within C. auratus, vocalizations are consistent throughout its wide geographic range (Haffer 1997, Lane 1999). In addition, C. niger can be distinguished readily from all forms of C. auratus by the presence of a discrete red forehead, lighter underparts, and weaker flank spotting.
Capito auratus varies in throat color within and among localities, from orange to red, with many intermediate forms (Chapman 1928, Haffer 1997, Lane 1999). Subspecies within C. auratus have been defined largely on the extent and color of these plumage patches (Chapman 1928). Although barbets' plumages have not been tested explicitly, this red and orange throat coloration is most likely due to carotenoids (Brush 1978; but see McGraw et al. 2004a, 2004b). However, it is now well known that birds cannot synthesize carotenoids and must obtain them from food (Goodwin 1950, Brush 1978). As a result, patches of carotenoid coloration can vary within and among populations of some species, due to differential intake and regional availability of dietary carotenoids (Hill 1992, 1993a, 1993b). The taxonomic value of a character so heavily influenced by environmental variables is questionable (Troy and Brush 1983).
We undertook this phylogenetic study using mtDNA sequence data to 1) investigate the relationships between C. niger, C. auratus, and C. brunneipectus, 2) reconstruct the relationships and assess genetic diversity among populations within C. auratus, and 3) evaluate carotenoid coloration as a taxonomic character for the group.
Methods
Pcr Amplicfication and Sequencing
We isolated DNA from both frozen tissues (n = 18) and skin samples (n = 3) from recently collected museum specimens representing nine of fifteen subspecies of the C. niger complex (Table 1; Chapman 1928, Peters 1948). We also isolated DNA from muscle tissue of seven outgroup taxa including samples from six of the seven other Capito species (Table 1). For all ingroup taxa we sampled individuals from the extremes of their geographic distributions when available (Fig. 1). We were unable to obtain tissue samples for six subspecies of C. auratus. The taxonomic validity of most of these subspecies is doubtful (Lane 1999) and they are not represented in modern tissue collections. Also, we do not assess patterns of intraspecific variation within C. niger and C. brunneipectus because of the limited number of samples available.
We extracted DNA from all muscle tissue samples using a DNeasy extraction kit (Qiagen, Valencia, California) following its protocol for animal tissues. For DNA extraction from skin samples, we used 50 μL of eluting buffer instead of the recommended 200 μL. Negative controls were included during extraction from skin samples to check for contamination.
For each sample, we sequenced a total of 1427 base pairs of mitochondrial DNA, consisting of 1048 base pairs from Cytochrome b and 379 base pairs from Cytochrome oxidase I (COI). For PCR amplification of Cytochrome b, we used primers L14841 (Kocher et al. 1989), BARBCBH (5′-GAGAAGTANGGGTGGAAKGG-3′), BARBCBL (5′-CTTCCTCCTNCCATTYCTAATCRCAGG-3′) and H16065 (Helm-Bychowski and Cracraft 1993) with the following thermal cycling profile: 30 cycles of 90°C for 40 sec, 50°C for 40 sec, 72°C for 40 sec, followed by 72°C for 5 min. To amplify COI, we used primers L6625 and H7005 (Hafner et al. 1994) and the following thermal cycling profile: 94°C for 2 min, 35 cycles of 94°C for 30 sec, 46°C for 30 sec, 72°C for 30 sec, and 72°C for 7 min. We verified all PCR products and negative controls on a 1% agarose gel and purified PCR products using a QIAquick PCR Purification kit (Qiagen, Valencia, California). Cycle sequencing reactions were performed using an ABI Big Dye kit (Applied Biosystems, Foster City, California), the above-listed primers, and approximately 75 ng of purified PCR product. We removed unincorporated dyes from sequencing reaction products using Centrisep columns (Princeton Separations, Adelphia, New Jersey) repacked with Sephadex G-50. Sequences were collected using an ABI 377 automated DNA sequencer (Applied Biosystems). We used Sequencher (V. 3.1, GeneCodes Co., Ann Arbor, Michigan) to reconcile double-stranded sequences and to align sequences. All sequences used in this study are deposited in GenBank (accession numbers AY897014–AY897069).
Phylogenetic and Statistical Analyses
We performed a partition homogeneity test as implemented in PAUP* (Farris et al. 1994, Swofford 2001) to test for incongruence between Cytochrome b and COI data sets. We then used the combined data set to construct phylogenetic trees using maximum parsimony, maximum likelihood, and Bayesian analyses. Maximum parsimony and maximum likelihood analyses were conducted using PAUP* (V. 4.0 beta10, Swofford 2001). For maximum parsimony analysis we performed 100 bootstrap replicates using a heuristic search with 10 random additions per replicate and tree-bisection-and-reconnection branch swapping. We also performed 100 bootstrap replicates for the maximum likelihood analysis using a heuristic search, one random addition per replicate, and tree-bisection-and-reconnection branch swapping. We used Modeltest (V. 3.06, Posada and Crandall 1998) to obtain the best-fit model (Cunningham et al. 1998), the rate substitution parameters, and the gamma distribution shape parameter for maximum likelihood analyses. For maximum likelihood analyses we used the model TrN+G (Tamura and Nei 1993). Bayesian analyses were conducted with MrBayes (V. 2.01, Huelsenbeck and Ronquist 2001) using the site-specific gamma model, which we ran for 4 000 000 generations. We discarded the first 50 000 generations as “burn-in” (Leache and Reeder 2002).
We calculated uncorrected sequence divergence (p-distance) using PAUP* (Swofford 2001). We estimated levels of population structure by calculating FST values and performing Analysis of Molecular Variance (AMOVA) using Arlequin (Schneider et al. 2000). We used MacClade (V. 3.07, Maddison and Maddison 1992) to perform Maddison and Slatkin's (1991) test of phylogenetic signal to assess whether throat coloration contains significant phylogenetic signal. The Maddison and Slatkin test included only ingroup taxa as most outgroup taxa lack corresponding carotenoid throat patches. Throat coloration (orange, red, or brown) was assessed from the museum voucher skins corresponding to the tissue samples used in this study. Where appropriate, statistical results are presented as mean ± SD. We considered results statistically significant if P ≤ 0.05.
Using PASSAGE (V. 1.1, Rosenberg 2001), we performed two Mantel tests (Mantel 1967) with 10 000 iterations. First, to assess whether uncorrected genetic distances are statistically associated with geographic distances for the C. auratus group we compared a matrix of uncorrected p-distances to a matrix of geographic distances. Second, to assess whether major rivers form significant genetic barriers we compared the same matrix of uncorrected p-distances to a pair wise riverbank matrix in which each pair from the C. auratus group was coded as having come from the same or different river bank. In this case, for example, we considered birds north of the Amazon and Solimões and west of the Ucayali Rivers as being on the same bank.
Results
Using the partition homogeneity test, we did not detect incongruence between Cytochrome b and COI partitions (P = 0.92). Also, when analyzed separately, Cytochrome b and COI gene trees (not shown) were completely compatible with each other. Therefore, we combined these partitions for subsequent analyses. When both genes were combined, every individual sequenced had a unique haplotype.
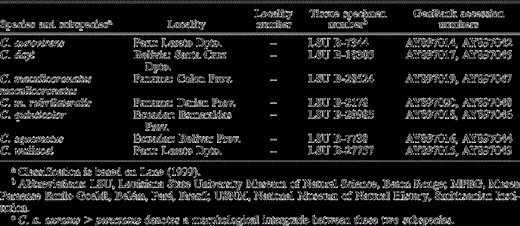
Species and subspecies analyzed, including localities, specimen voucher information, and GenBank accession numbers. Locality number refers to the numbers found on the map in Figure 1. Taxon names are based on locality and assessment of museum voucher skins
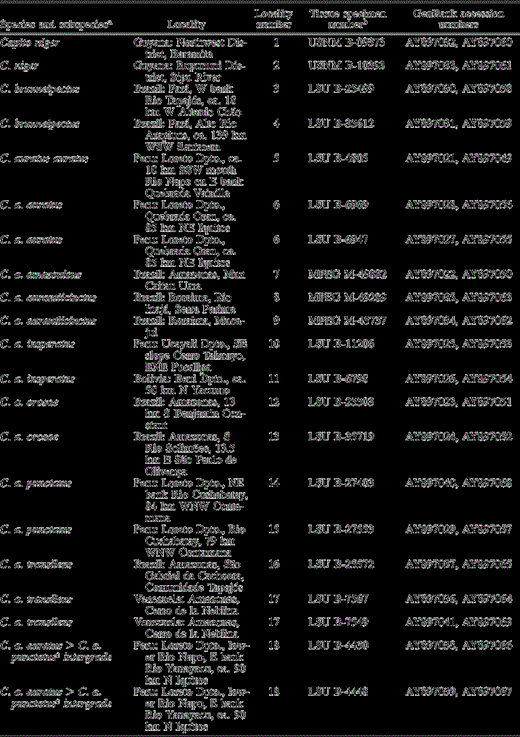
Species and subspecies analyzed, including localities, specimen voucher information, and GenBank accession numbers. Locality number refers to the numbers found on the map in Figure 1. Taxon names are based on locality and assessment of museum voucher skins
Continued
Continued
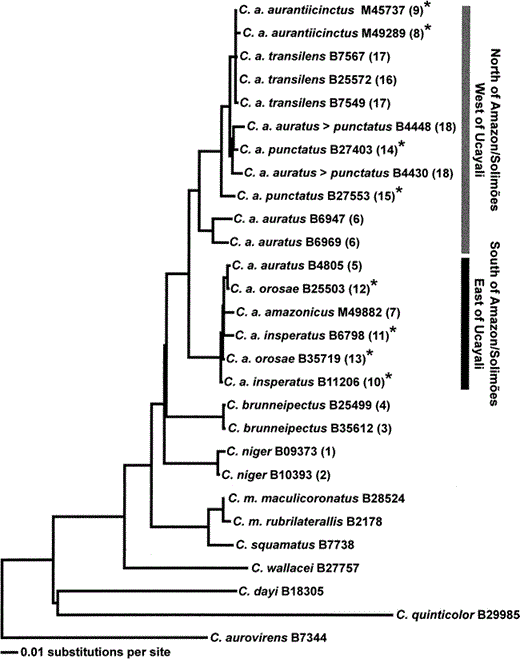
All tree topologies reconstructed by maximum parsimony, maximum likelihood, and Bayesian analyses were essentially identical with differing amounts of resolution (Fig. 2, Fig. 3). The relationships among C. niger, C. auratus, and C. brunneipectus were unresolved. For example, only 56% of the trees sampled in the Bayesian site-specific gamma search placed C. niger and C. brunneipectus as sister taxa (Fig. 2 and 3). However, the monophyly of C. auratus is well supported. Within C. auratus, two reciprocally monophyletic groups are separated by the Amazon, Solimões, and Ucayali Rivers. These clades differ by 5% uncorrected sequence divergence on average. C. auratus auratus (sensu Chapman 1928) is polyphyletic because it appears in both C. auratus clades. Furthermore, C. a. punctatus and C. a. insperatus are paraphyletic. Throat color changes numerous times on the gene tree (Fig. 3) and lacks significant phylogenetic signal (P = 0.25, Maddison and Slatkin 1991).
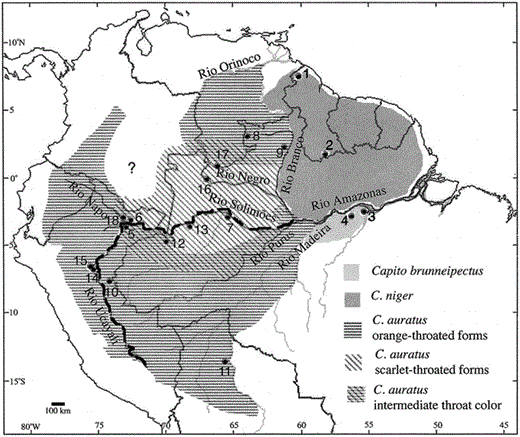
Localities of specimens of Capito niger complex. Numbers on the map refer to localities in Table 1. Shading pattern reflects species and plumage type. The question mark indicates areas of uncertain C. auratus distribution. The dark line indicates the major break seen in the phylogeny (Figs. 2 and 3) separating birds found north and west of the Amazon, Solimões, and Ucayali Rivers from birds located south and east of these rivers
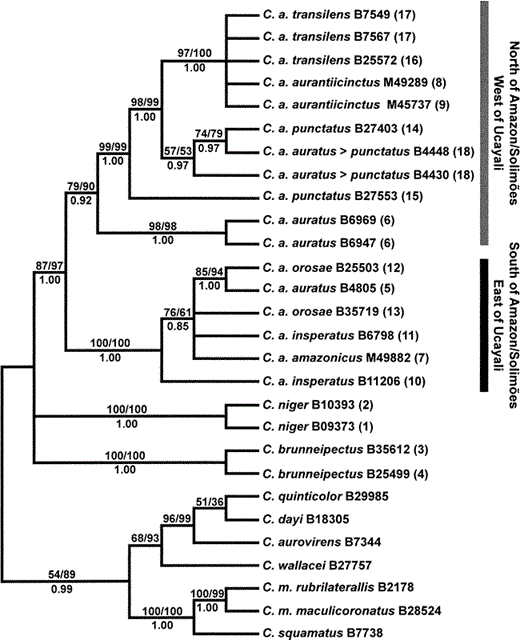
Maximum likelihood bootstrap consensus (L = 5788.409) showing the phylogenetic relationships of species and populations within the Capito niger superspecies complex. Numbers above the branches indicate maximum likelihood/maximum parsimony bootstrap support (only >50% are shown). Model used in maximum likelihood analysis includes substitution types (A-C, A-T, C-G, and G-T = 1.000; A-G = 23.758, C-T = 28.580), unequal base frequencies (A = 0.247, C = 0.333, G = 0.142, T = 0.278), and rate heterogeneity according to a gamma distribution (shape parameter = 0.196). Numbers below the branches indicate Bayesian posterior probability values. Immediately following the species names are the specimen numbers for the tissue samples as shown in Table 1. Numbers in parentheses to the right of the specimen numbers refer to localities labeled on Figure 1. The taxon name C. a. auratus > punctatus denotes a morphological intergrade between these two subspecies
The mean sequence divergence of all individuals sequenced is 0.042 ± 0.021. The mean pairwise sequence divergence between C. niger, C. auratus, and C. brunneipectus groups ranges from 0.061 ± 0.002 (comparing C. niger and C. brunneipectus) to 0.062 ± 0.004 (comparing C. auratus and C. brunneipectus).
Maximum likelihood phylogram (L = 5788.361) of the phylogenetic relationships of species and populations within the Capito niger superspecies complex. The corrected branch lengths, which are proportional to the number of substitutions per site, were calculated under the TrN+G model with the same parameter values and settings reported for Figure 2. Numbers immediately following the species names refer to the specimen numbers for the tissue samples as shown in Table 1. Numbers in parentheses to the right of the specimen numbers refer to localities labeled on Figure 1. C. auratus specimens with orange throat coloration are denoted with an asterisk, whereas C. auratus specimens with red throat coloration are not marked with an asterisk. The taxon name C. a. auratus > punctatus denotes a morphological intergrade between these two subspecies
Within the C. auratus group, 71% (FST = 0.71, df = 16, P < 0.001) of the sequence variation is due to variation between the two main clades. Sequence divergence between the C. auratus populations on either side of the Amazon, Solimões, and Ucayali Rivers is 0.049 ± 0.003. Average sequence divergence within each clade is much lower: 0.020 ± 0.015 in the clade found north of the Amazon and Solimões Rivers and west of the Ucayali River and 0.007 ± 0.003 in the clade found south of the Amazon and Solimões and east of the Ucayali. Mantel test results suggest no significant association (P = 0.21) between the uncorrected genetic distance matrix and the geographic distance matrix. However, the comparison of the uncorrected genetic distance matrix to the riverbank matrix indicates that high genetic distances are significantly associated with pairs being from opposite river banks (P < 0.001).
Discussion
This study indicates that C. auratus, C. niger, and C. brunneipectus should be considered distinct species. Although they are each other's closest relatives, each is separated from the other by at least 6% mitochondrial sequence divergence. Relatively high divergences and monophyly of the C. auratus group suggest that it has been evolving independently from C. niger and C. brunneipectus for a considerable period of time. Although plumage differentiation between C. niger and C. auratus is minimal, these two taxa are both distinct from C. brunneipectus in plumage. No zone of contact or hybridization is known to exist between C. niger and C. auratus, and the songs of the two species differ from each other (Haffer 1997, Lane 1999). Some phylogenetic reconstructions even suggest that C. niger may be more closely related to C. brunneipectus than to C. auratus. However, more data are needed to resolve the relationships among these three groups.
Population genetics, phylogenetic analysis and geography all suggest that C. auratus north and west of the Ucayali, Amazon, and Solimões Rivers and south and east of the Ucayali, Amazon, and Solimões Rivers are distinct. We calculate an approximate mitochondrial sequence divergence of 5% between these two clades. These analyses suggest at least two evolutionarily significant units within C. auratus (Moritz 1994) and might indicate the existence of two geographically separated species-level taxa.
This level of divergence is similar to the relatively high levels of mitochondrial differentiation found within Amazonian suboscine birds. For example, uncorrected sequence divergences range from 5%–6% between populations of Hypocnemis cantator on opposite banks of the Amazon River (Bates et al. 1999), and they range between 1%–8% for Glyphorhynchus spirurus populations (Marks et al. 2002). Within the genus Xiphorhynchus, uncorrected divergences between populations of X. guttatus, X. ocellatus, and X. spixii range from 2%–5%, 1%– 6% and 2%–4%, respectively (Aleixo 2002b). Divergence within C. auratus was also similar to that between populations of Hemitriccus minor, which ranged from 0%–6% (Cohn-Haft 2000). Similar to the patterns found in suboscine passerines, our results suggest that the current species-level taxonomy may underestimate the genetic diversity found in Amazonia.
The Mantel test indicates that there is not a significant relationship between geographic distance and uncorrected genetic distance. However, the Mantel test comparing uncorrected genetic distances with the riverbank matrix indicates that high genetic distances are significantly associated with pairs being from opposite river banks. In this case, the Amazon, Solimões, and Ucayali Rivers appear to be effective barriers to dispersal for C. auratus, at least for females. The reciprocal monophyly of C. auratus clades from opposite banks of the Amazon, Solimões, and Ucayali Rivers also indicates that among the birds sampled, closest mitochondrial relatives are not necessarily close geographically. Apparently, the most closely related individuals are often found hundreds of miles away but on the same side of the river, whereas those directly across the river are more distantly related.
Relatively high levels of divergence within taxa across the Amazon, Solimões, and Ucayali Rivers has been observed in only two other species studied, Hemitriccus zosterops (Cohn-Haft 2000) and Xiphorhynchus elegans (Aleixo 2002a). In H. zosterops, clades were separated by only 2%–4% sequence divergence, and two X. elegans subspecies, X. e. ornatus and X. e. juruanus, were separated by only 2% sequence divergence. These lower divergences perhaps indicate a more recent cessation of mitochondrial gene flow or a different rate of evolution within these groups as compared to the C. auratus populations separated by these same barriers. Several taxa, including Hypocnemis cantator (Bates et al. 1999) and Glyphorynchus spirurus (Marks et al. 2002) exhibit high levels of divergence across the Amazon. The geographic location of barriers to gene flow for each taxon will depend partly upon the taxon's distribution. In other suboscines, the Madeira (Bates et al. 1999, Cohn-Haft 2000), Negro (Cohn-Haft 2000), and Tapajós (Aleixo 2002a) Rivers act as barriers to gene flow. Additional sampling is needed to determine whether other large rivers, such as the Rio Napo, act as barriers to gene flow between C. auratus populations.
Several C. auratus subspecies are non-monophyletic in their mtDNA gene trees. C. auratus auratus (sensu Chapman 1928) is polyphyletic, with C. a. auratus from the north bank of the Amazon (locality 6, Fig. 1) and C. a. auratus from the south bank of the Amazon (locality 5, Fig. 1) in two different clades, despite the fact that the specimens were separated by less than 30 km. Other subspecies, including C. a. punctatus, C. a. insperatus, and C. a. orosae are paraphyletic. For C. auratus subspecies this non-monophyly might result from geneflow, incomplete lineage sorting, or imperfect taxonomy based on throat coloration (see Funk and Omland 2003).
C. auratus subspecies were previously defined primarily on the basis of throat coloration. However, when we mapped throat coloration onto the C. auratus gene tree, throat coloration did not appear to contain significant phylogenetic signal. Marks et al. (2002) also found that differences in plumage coloration between subspecific taxa of Glyphorhynchus spirurus were not consistent with patterns of mtDNA variation. This result is not surprising given that some forms of coloration are heavily influenced by environmental variables. Furthermore, several studies have called into question the use of carotenoid-based coloration as a defining systematic or taxonomic character (Troy and Brush 1983, Hill 1993a, 1993b, Omland and Lanyon 2000, Mahler et al. 2003). However, we cannot rule out the possibility that there may be a genetic component involved in the process of sequestering and depositing carotenoid pigments. It is also possible that sexual selection on throat color is not reflected in neutral mtDNA. However, we believe that for C. auratus, the non-monophyly of subspecific taxa and the lack of concordance in phylogenetic signal between throat coloration and mtDNA indicate the need for taxonomic revision using additional, independent genetic markers, morphological characters, and larger sampling of individuals.
Acknowledgments
We thank D. Dittmann and F. Sheldon (Louisiana State University Museum of Natural Science), D. C. Oren (Museu Paraense Emílio Goeldi), and M. Braun (National Museum of Natural History) for loans of tissue and skin samples. We also thank Mort Isler for use of maps and Alexandre Aleixo for locality information. Alexandre Aleixo, Robb Brumfield, Carla Cicero, Peter Dunn, Jeff Johnson, Ben Marks, Kazuya Naoki, Kevin Omland, J. V. Remsen, Fred Sheldon, Linda Whittingham and Chris Witt provided helpful comments on the manuscript. We also thank K. Naoki and M. I. Gomez, who helped by editing our Spanish title and abstract. Frank Hutto helped with GIS calculations of geographic distances between sampling localities. This work was supported by NSF DEB-0104919 to JDW and the LSU Ornithology Birdathon Funds.
Literature Cited
Author notes
Present address: Department of Biological Sciences, P.O. Box 413, Lapham Hall, University of Wisconsin-Milwaukee, Milwaukee, Wisconsin, 53201. [email protected]
