


Abstract
Optical genome mapping (OGM) is a novel assay for detecting structural variants (SVs) and has been retrospectively evaluated for its performance. However, its prospective evaluation in prenatal diagnosis remains unreported. This study aimed to prospectively assess the technical concordance of OGM with standard of care (SOC) testing in prenatal diagnosis.
A prospective cohort of 204 pregnant women was enrolled in this study. Amniotic fluid samples from these women were subjected to OGM and SOC testing, which included chromosomal microarray analysis (CMA) and karyotyping (KT) in parallel. The diagnostic yield of OGM was evaluated, and the technical concordance between OGM and SOC testing was assessed.
OGM successfully analyzed 204 cultured amniocyte samples, even with a cell count as low as 0.24 million. In total, 60 reportable SVs were identified through combined OGM and SOC testing, with 22 SVs detected by all 3 techniques. The diagnostic yield for OGM, CMA, and KT was 25% (51/204), 22.06% (45/204), and 18.14% (37/204), respectively. The highest diagnostic yield (29.41%, 60/204) was achieved when OGM and KT were used together. OGM demonstrated a concordance of 95.56% with CMA and 75.68% with KT in this cohort study.
Our findings suggest that OGM can be effectively applied in prenatal diagnosis using cultured amniocytes and exhibits high concordance with SOC testing. The combined use of OGM and KT appears to yield the most promising diagnostic outcomes.
Introduction
Prenatal diagnosis plays a crucial role in detection of genetic alterations causing congenital defects. Current standard of care (SOC) testing for prenatal genetic diagnosis involves G-banded karyotyping (KT) and fluorescence in situ hybridization, which offer varying diagnostic yields. In recent years, chromosomal microarray analysis (CMA) has become the recommended first-line test for fetuses with structural anomalies and other clinical indications, providing an incremental diagnostic yield of approximately 6% (1).
KT is a traditional method used for detecting aneuploidy and large chromosome rearrangements, but its low resolution of 5–10 Mb limits its ability to identify small copy number variations (CNVs) and certain structural variants (SVs), particularly cryptic translocations. The overall diagnostic rate of KT in prenatal diagnosis has been reported to be around 10% (1), which is consistent with our own observations (ranging from 5.02% to 8.84% from 2019 to 2022, unpublished data). On the other hand, fluorescence in situ hybridization can precisely detect specific SVs with targeted probes, but it lacks the capability for genome-wide analysis. CMA, with its higher resolution, offers an advantage in CNV detection. However, it is unable to detect balanced translocations (BTs), inversions, or low-level mosaicism. Prenatal exome sequencing has been increasingly used in fetuses with structural anomalies (2, 3). Nevertheless, the limitations of short read sequencing and targeted coverage in prenatal exome sequencing significantly compromise its performance in detecting SVs. More recently, genome sequencing (GS) has emerged as an effective method for predicting SVs (4), showing unique advantages over SOC testing with its all-in-one approach. Hu et al. compared the performance of GS with CMA in prenatal diagnosis and found that GS outperformed CMA in detecting trinucleotide repeat expansions and exonic CNVs (5). However, the clinical applicability of prenatal GS has not been extensively evaluated yet. Therefore, given the constraints of prenatal sampling and reporting time, there is a high demand for a high-resolution technology that can comprehensively detect all classes of genome-wide SVs in a single assay for prenatal diagnosis.
Optical genome mapping (OGM), as a next-generation cytogenomic technology, has demonstrated unique advantages over SOC testing, both in constitutional disorders and somatic neoplasms. Luhmann's study on 12 children with acute lymphoblastic leukemia showed that all genomic aberrations detected by other techniques were also identified by OGM (6). In a multisite assessment of OGM in constitutional postnatal cases, Iqbal et al. reported a 99.5% technical concordance between OGM and SOC tests, with 100% concordance in the replicate analysis of 130 SVs (7). Although there have been a few sporadic reports on the prenatal application of OGM, its potential in prenatal genetic testing has not been systematically evaluated. OGM was used for rapid prenatal diagnosis of facioscapulohumeral muscular dystrophy 1 in 2020 (8). Sahajpal's group emphasized the potential of OGM as a SOC in prenatal genetic testing (9). Moreover, their group reported that OGM demonstrated 100% concordance with SOC testing in identifying 101 aberrations and detected an additional 64 clinically reportable SVs in 43 samples (10). These findings indicate that OGM has the potential to replace current SOC testing for prenatal diagnostic purposes. However, a prospective study with a substantial number of samples in the prenatal setting has not been reported to date.
In this study, we collected a total of 204 amniotic fluid (AF) samples at a single center in a prospective design. Each sample underwent both SOC testing (KT + CMA) and OGM analysis. Additionally, we optimized the sample processing procedures for amniocyte culture to enable routine application of OGM in clinical prenatal practice. We performed a methodological comparison between SOC testing and OGM and preliminarily assessed the clinical utility of OGM in routine prenatal diagnosis.
Materials and Methods
Cohort Design
Pregnancies with an average gestational age of 16–24 weeks, undergoing amniocentesis at the prenatal diagnostic clinic of Ningbo Women and Children's Hospital, were included in this prospective study. Considering the clinical practice routine of prenatal diagnosis in China, the inclusion and exclusion criteria were defined through prenatal CMA guidelines, consensus, and peer-reviewed data (11–15). The inclusion criteria were as follows: (a) fetuses with one or more organ abnormalities, (b) intrauterine growth retardation >−2SD, (c) at least one parent with numerical or structural chromosomal abnormalities, (d) advanced maternal age ≥35 years, (e) thickened nuchal translucency >3.0 mm, and (f) high risk for chromosomal abnormalities indicated by noninvasive prenatal testing (NIPT) excluding T21/T18/T13. The exclusion criteria included the following items: (a) cases with isolated ultrasonic soft markers, (b) cases with a history of abnormal pregnancies with unknown reason or with monogenic disorders, (c) cases with positive maternal serum screening, and (d) cases with NIPT indicating high risk for T21/T18/T13 (Fig. 1). Written informed consent was obtained from all participants, and the study was approved by the IRB of Ningbo Women and Children's Hospital (no. EC2020-048). The study adhered to the provisions of the Declaration of Helsinki (as revised in 2013).
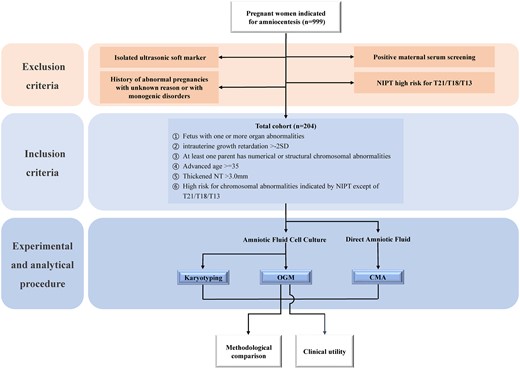
Flow chart of the cohort design. Pregnant women indicated for amniocentesis were screened according to the exclusion and inclusion criteria. Acquired AF from eligible pregnant women was subjected to CMA, OGM, and KT tests. The data obtained from CMA, OGM, and KT were used for methodological comparison and evaluation of clinical utility of OGM. Color figure available at https://dbpia.nl.go.kr/clinchem.
Sample Preparation
Each sample underwent both OGM and SOC (KT + CMA) testing. The personnel responsible for SOC testing and OGM were following the institute's standard operating procedures and were blinded to each other's testing results until the end of testing.
Specifically, in OGM testing, AF cells were cultured and cryopreserved for DNA extraction. Ultra-high molecular weight DNA was isolated, labeled, and processed using the Prep SP Blood and Cell DNA Isolation Kit & Prep DLS Labeling kits (Bionano Genomics) for analysis on the Bionano Genomics Saphyr platform (Supplemental Fig. 1).
Data Analysis
Approximately 500 GB of raw data was collected from the Bionano's Saphyr platform for each sample. De novo genome map assembly was performed using Bionano Solve™ (v.3.7) software and OGM specific pipelines managed via Bionano Access™ (v.1.7) software, with direct alignment of the consensus maps to the reference human genome (GRCh38). Germline SVs (insertions, duplications, deletions, inversions, fusions, and translocations), large CNVs, aneuploidies and regions of absence of heterozygosity were analyzed separately with different algorithms.
For data analysis, variants were filtered using the following criteria (Fig. 2): (a) keeping variants with confidence scores higher than those recommended by the manufacturer; (b) keeping variants that met size criteria; (c) enabling the GRCh38 SV mask to filter out SVs in difficult-to-map regions; (d) filtering out variants with ≥1% frequency in the OGM control sample SV database; and (e) filtering out variants without disease-associated genes. The pathogenicity for the remaining CNVs (deletions/duplications) were determined based on the institute's standard operating procedures, following the American College of Medical Genetics and Genomics guidelines (16) and an International System for Human Cytogenomic Nomenclature 2016, while a breakpoint analysis approach was used for evaluating other types of SV (e.g., translocation, fusion, insertion, and inversion).
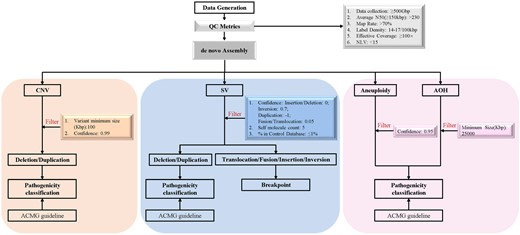
Work flow of OGM variant calling and data analysis. De novo genome map assembly of the data passing the QC metrics was performed. After filtering, variants (SVs, CNVs, aneuploidies, and absence of heterozygosity) were classified according to the American College of Medical Genetics and Genomics guidelines or breakpoint analysis approach separately. Color figure available at https://dbpia.nl.go.kr/clinchem.
Diagnostic Yield and Technical Concordance
The diagnostic yield (positive rate) for OGM and SOC testing, respectively, was calculated by dividing the number of cases with reported variants by the total number of cases enrolled in this cohort. The technical concordance between OGM and SOC was determined by dividing the number of cases with reported variants detected by OGM by the number of cases with reported variants detected by SOC testing.
Results
Cohort Description
From April 2022 to February 2023, a total of 999 pregnancies indicated for amniocentesis at the Prenatal Clinic of Ningbo Women and Children's Hospital were initially considered for inclusion. After applying the exclusion criteria (Fig. 1), 204 cases were finally included in the study, categorized based on clinical indications: (a) fetus with one or more organ abnormalities (n = 20, 10%), (b) intrauterine growth retardation >−2SD (n = 2, 1%), (c) at least one parent with numerical or structural chromosomal abnormalities (n = 18, 9%), (d) advanced maternal age ≥35 (n = 61, 30%), (e) thickened nuchal translucency >3.0 mm (n = 4, 2%), (f) NIPT high risk for chromosomal abnormalities other than T21/T18/T13 (n = 67, 33%), and (g) presence of ≥2 indications (n = 32, 15%) (Fig. 3A).
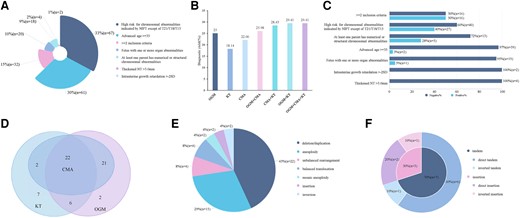
The clinical utility of OGM and the methodological comparison between OGM and SOC testing. (A), The classification of all eligible cases; (B), The diagnostic yield by OGM, KT, and CMA alone, or combined; (C), The proportion of positive-diagnosed and negative cases underneath each inclusive category; (D), The Venn diagram of the number of positive cases detected by OGM, CMA, and KT; (E), The classification of positive results by OGM; (F), The orientation and location of duplication CNVs. Color figure available at https://dbpia.nl.go.kr/clinchem.
Technical Performance
Out of the 204 cultured samples tested, 190 samples passed the QC metrics, achieving an average N50 (>150 kb) of 281.07 kb, a map rate of 91.6%, a label density of 15.73/100 kb, an average coverage of 147.26x, and a negative label variance of 7.54 (Supplemental Table 1). The OGM QC failure rate was 6.8% (14/204), which was consistent with that of CMA (16/204, 7.8%). Samples in this study that failed QC had performance metrics just slightly below the QC thresholds recommended by the manufacturer. These samples were also analyzed and included in this study and were determined to be successful for method evaluation. Our results indicated that 25% of the samples had a cell count of ≤0.5 million, and 77% had a cell count of ≤1.0 million. Importantly, DNA from samples with cell counts as low as 0.24 million was sufficient for downstream OGM analysis with normal QC metrics (Supplemental Table 1). On average, 9378 SVs and 92 CNVs were identified per sample in the 204 samples. However, only 3–22 SVs and 0–5 CNVs per sample required further evaluation for potential clinical relevance, with 99% of the variants filtered out (Supplemental Fig. 2).
Diagnostic Yield
In this cohort, the diagnostic yield of OGM, CMA, and KT was 25% (51/204), 22.06% (45/204), and 18.14% (37/204), respectively (Fig. 3B). The overall positive rate when combining the results of all 3 technologies was 29.41% (60/204). Interestingly, the combined diagnostic yield for OGM and KT was 29.41% (60/204), while the diagnostic yields for OGM plus CMA and CMA plus KT were 25.98% (53/204) and 28.43% (58/204), respectively. Moreover, the diagnostic yield of OGM in participants with ≥2 indications, NIPT high risk for chromosomal abnormalities other than T21/T18/T13, and abnormal parental chromosomal abnormalities were 50%, 40%, and 28%, respectively. However, OGM did not detect any positive cases in pregnancies with intrauterine growth retardation or nuchal translucency >3 mm (Fig. 3C).
Concordance between OGM and SOC Testing
Among the 60 cases with positive SVs identified by both OGM and SOC testing, 22 aberrations were revealed by all 3 technologies (Fig. 3D). Notably, OGM identified 51 positive SVs alone (Supplemental Table 2), including microdeletions/duplications (n = 22, 43%), unbalanced rearrangements (n = 4, 8%), BTs (n = 4, 8%), aneuploidies (n = 15, 29%), mosaic aneuploidies (n = 2, 4%), insertions (n = 2, 4%), and inversions (n = 2, 4%), as summarized in Fig. 3E and Table 1. OGM exhibited a concordance of 95.56% with CMA, with the detection of 2 cases with mosaic aneuploidy (C22A1244-P and C22A0755-P) as the only discrepancies (Table 1, Supplemental Table 3). By contrast, OGM detected an additional 8 SVs missed by CMA, mainly involving BTs, insertions, and inversions. When compared to KT, OGM was capable of identifying more unbalanced rearrangements due to its higher resolution. On the other hand, KT exclusively captured 7 SVs, including centromeric BTs, low-level mosaic aneuploidies, inversions, Robertsonian translocations, and 22ps+ (Supplemental Table 3). As a result, only 28 SVs were detected by both OGM and KT, resulting in a concordance of 75.68% (Table 1).
The diagnostic yield and concordance of testing results by different testing strategies.
| Type of variants | Number of positive cases by different testing strategies | Concordance | |||||||
|---|---|---|---|---|---|---|---|---|---|
| OGM + CMA + KT | OGM + KT | OGM + CMA | CMA + KT | OGM | CMA | KT | OGM to CMA | OGM to KT | |
| Deletion/duplication | 22 | 22 | 22 | 22 | 22 | 22 | 2 | 100% | 100% |
| Aneuploidy | 15 | 15 | 15 | 15 | 15 | 15 | 15 | 100% | 100% |
| BT | 5 | 5 | 4 | 5 | 4 | 0 | 5 | N/A | 80% |
| Unbalanced rearrangement | 4 | 4 | 4 | 4 | 4 | 4 | 3 | 100% | 100% |
| Mosaic aneuploidy | 5 | 5 | 4 | 5 | 2 | 4 | 5 | 50% | 40% |
| Inversion | 5 | 5 | 2 | 5 | 2 | 0 | 5 | N/A | 40% |
| Insertion | 2 | 2 | 2 | 0 | 2 | 0 | 0 | N/A | N/A |
| Short arm “p” satellite segments + (ps+) | 1 | 1 | 0 | 1 | 0 | 0 | 1 | N/A | 0% |
| Robertsonian translocation | 1 | 1 | 0 | 1 | 0 | 0 | 1 | N/A | 0% |
| Total | 60 | 60 | 53 | 58 | 51 | 45 | 37 | 95.56% | 75.68% |
| Diagnostic yield (%) | 29.41% | 29.41% | 25.98% | 28.43% | 25% | 22.06% | 18.14% | N/A | N/A |
Unique Findings
Complex Structural Rearrangements
In case C22A0861-P, OGM revealed a 23.9 Mb intrachromosomal translocation in the region of chromosome 2q14.2-2q22.2, followed by a 2.7-Mb inversion in the region of chromosome 2q14.1 (approximately 115.2–117.9 M), while CMA and KT showed normal results (Fig. 4A). The breakpoint was confirmed through long-range PCR and gel electrophoresis, and no gene disruption was found (Fig. 4B and C). However, carriers of this complex SV may have a higher risk of birth defects in their future reproduction due to unbalanced gamete segregation or recombination.

Unique findings in 2 cases. (A–C), Complex structural rearrangements of C22A0861-P; (A), The molecular map of structural rearrangements (left), and the models of rearrangement (right); (B), The breakpoints within a morbid gene; (C), Gel analysis of the long-range PCR products; (D) and (E), Detailing the location and orientation of duplication CNVs of C22A1644-P; (D), The genomic structure of duplication CNVs; (E), CMA result. Color figure available at https://dbpia.nl.go.kr/clinchem.
Detailing the Location and Orientation of Duplication CNVs
In this study, OGM revealed a total of 10 duplication CNVs, out of which 7 were classified as tandem duplications, with 6 cases being further demonstrated as direct tandem duplications and the seventh case being in an inverted orientation. For the remaining 3 duplications that were found to be inserted into the original chromosomes rather than other chromosomes, one was identified as an inverted insertion and 2 were of direct orientation (Fig. 3F). In case C22A1644-P, both CMA and OGM detected 2 duplications despite a normal KT result (Fig. 4E). Although there were no triplosensitive genes involved in these 2 duplications, they were not found to be tandem duplications. One 400-kb duplication in chromosome 6q25.3 (grch38: chr6:157322007-157700920) directly inserted into chromosome 6q27, and another 200-kb duplication in chromosome 6q27 (grch38: chr6:165764508-165918579) directly inserted after the aforementioned duplication in the 6q25.3 region (Fig. 4D).
Follow-up Outcome
To further confirm the clinical impact of the reported SVs in the 60 cases in this cohort, we conducted a short-term follow-up. Twenty-four out of the 60 women (40%) chose to terminate their pregnancies after genetic counseling, primarily because their fetuses carried a pathogenic SV or experienced abnormal ultrasound testing (Supplemental Fig. 3A and B). Nevertheless, the remaining 36 women chose to continue their pregnancies. At the time of writing this paper, 28 out of 36 women delivered healthy babies, while the remaining 8 women reported continued uneventful pregnancies (Supplemental Fig. 3B).
Discussion
Although the performance of OGM in the prenatal setting has been previously evaluated prospectively, only a small number of samples were included (17). Here we reported the results of a prospective prenatal OGM study with the largest sample size to date. While previous studies by Sahajpal et al. and Iqbal et al. reported high concordance between OGM and SOC testing (9, 10), they primarily selected samples from a technical perspective rather than based on clinical indications. As a result, their studies did not provide information on the clinical utility of OGM. By contrast, our study revealed that OGM had the highest diagnostic yield (25%, 51/204) compared to KT (18.14%, 37/204) and CMA (22.06%, 45/204), thus demonstrating its high potential as a clinical assay in prenatal diagnosis.
In the standard OGM protocol, the manufacturer recommends 1.0–1.5 million cells for the extraction of ultra-high molecular weight DNA. However, in routine prenatal scenarios, this cell requirement becomes a practical limitation. In this study, we tested various processing protocols for cultured AF cells, established an in-house standard protocol, and determined the putative minimum cell threshold for a successful prenatal OGM experiment. Sahajpal et al. previously described that a minimum of 0.4 million cells is sufficient for successful downstream OGM analysis (10). Interestingly, we found that DNA quantity from samples with a cell count as low as 0.24 million was sufficient with normal QC metrics. These findings clearly demonstrate that OGM can be successfully applied in terms of prenatal sampling and reporting turnaround time.
Moreover, our results showed that OGM could detect all classes of SVs with higher resolution (Fig. 3), this technical advantage of OGM over SOC was also demonstrated in studies of constitutional chromosomal aberration detection and somatic neoplasms (18–21). Additionally, this feature is particularly crucial for prenatal settings where sample volume is restricted and rapid turnaround time is essential. Therefore, OGM's all-in-one solution for SVs potentially paves the way for its widespread application in prenatal diagnosis.
In comparison with SOC testing in prenatal genetic diagnosis, OGM showed 100% concordance for the detection of aneuploidy, microdeletion/microduplication, and unbalanced rearrangement (Table 1). However, there were 9 cases missed by OGM, even with T2T genome reference, including 3 cases with mosaic aneuploidy, 3 with centromeric inversion (inv 9), one with balanced centromeric translocation, one with Robertsonian translocation, and one with 22ps+ (Supplemental Table 3). Notably, these 9 cases were excluded from the studies conducted by Sahajpal and Iqbal, which might explain, at least in part, the discrepancy of technical concordance between this prospective study and previous retrospective studies. Our results showed that although OGM has the highest diagnostic yield, it is not yet acceptable to replace SOC with OGM when used alone. However, in this cohort, a combined approach of OGM and KT had a diagnostic yield that was comparable to the combined approach of OGM, CMA, and KT. Thus, combining OGM and KT analyses could be a comprehensive solution for prenatal genetic diagnosis in clinical practice.
Duplication CNVs usually have pathological effects through triplosensitivity, or sometimes result in gene fusion due to insertion in unexpected locations. SOC testing cannot provide exact breakpoint information for duplications due to technical limitations. Our results revealed that OGM could provide detailed location and orientation information for duplication events. A study by Newman et al. reported that 83% of duplications were tandem in direct orientation, and 5% of duplications created fusion genes at their breakpoints, which may be related to clinical phenotypes and warrant further study (22). In this cohort, we found that 60% of duplications were tandem in direct orientation, and one duplication event was predicted to create a fusion gene TMEM242::PDE10A (Fig. 4D), the functional consequence and clinical significance of which are unclear and require further study. Additionally, He et al. reclassified 3 noncontiguous DMD duplications as benign using OGM (23). Consequently, they suggested that breakpoint analysis should be performed on DMD duplications, and the pathogenicity of duplications found in prenatal scenarios should be interpreted cautiously. Taken together, OGM could provide valuable additional information for microduplications, enhancing interpretation of genomic variants and clinical genetic counseling.
As previously described by Zhang et al., OGM, as an accurate and comprehensive method for detecting cryptic chromosomal rearrangements, could be used as a first-line testing tool in routine clinical practice (24). In our study, case C22A0609-P was found to harbor unbalanced cryptic chromosomal rearrangements, including a 9-Mb duplication of chromosome 2q27.1q27.3, a 600-kb deletion of chromosome 12q24.33, and a derivative chromosome 12 based on the OGM molecular mapping, which was not revealed by KT or CMA (Supplemental Fig. 4A and C). Accordingly, the fetus's parents may be carriers of balanced cryptic chromosomal rearrangements. However, the fetus's mother showed normal results by OGM (Supplemental Fig. 4B). Unexpectedly, the fetus's father is a sperm donor, and thus we were unable to confirm whether this donor is carrying a cryptic chromosomal rearrangement. This result raises the question of whether novel molecular diagnostic assays, such as OGM, should be included in comprehensive work-ups for sperm/oocyte donation. Moreover, this result further highlights the potential of OGM as an ideal tool to detect cryptic chromosomal rearrangements, which is of clinical significance for carrier reproduction planning and genetic counseling.
Compared to SOC methods, OGM demonstrated the ability to characterize the specific architecture of balanced structural rearrangements and identify disrupted genes at the breakpoint regions. In 4 cases with BTs (C22A0863-P, C22A1629-P, C22A1632-P, and C22A1657-P), OGM provided breakpoint information summarized in Supplemental Table 4. Three of these translocations did not result in disruption of OMIM morbid genes. However, the BT t(10; 12) (q22; q13) in case C22A1632-P was only revealed by OGM to disrupt VCL(HGNC:12665) gene associated with hypertrophic cardiomyopathy-15 (MIM:613255) and dilated cardiomyopathy-1W (MIM: 611407). Long-range PCR with multiple primer pairs further pinpointed the breakpoint within intron 13 of the VCL gene (Supplemental Fig. 5). Sanger sequencing confirmed the breakpoints in the proband's mother, who may require genetic counseling and regular follow-up for cardiomyopathy.
Our results also clearly revealed that the most significant limitation for prenatal OGM lies in its unsatisfactory determination of mosaicism. While Sahajpal et al. reported a limit of detection of 10% allele fraction in OGM for translocation and aneuploidy with a raw data size of 800 GB and mean coverage of 160× per sample, we found that 60% of cases with mosaic aneuploidy were not detected at 150× genome coverage with either de novo assembly or a rare variant pipeline (Table 2, Supplemental Figs. 6–10). In one case (C22A0755-P), an aneuploidy of chromosome X with 70% mosaicism by CMA was not detected by the OGM, instead showing 4 discontinuous mosaic microduplications with a rare variant pipeline. This case was found to harbor a complex aneuploidy with 47, XXX in 67% of cells and 45, X in 15% of cells by KT. At this stage, we did not know whether the difference on data size and coverage between previous studies and our cohort lies behind the discrepancy in the detection of mosaic aneuploidy. However, the mosaicism with different cell lines is supposed to be one of the reasons for this discrepancy. We speculated that the mixed presence of 3 clones of different dosages of chromosome X in case C22A0755-P could have impact on the efficiency of dye staining. Further evaluation of OGM's performance for detecting mosaicism of different SVs is strongly suggested for a more comprehensive understanding of its capabilities.
Five cases with mosaic aneuploidy.
| Sample | OGM(GRCh38) | CMA (GRCh38) | KT |
|---|---|---|---|
| C22A0755-P | ogm[GRCh38] Xp22.33p21.3(3631028_27483437) × 2∼3, 22% ogm[GRCh38] Xp21.1p11.1(37300410_58514903) × 2∼3, 23% ogm[GRCh38] Xq11.1q21.1(62521449_77466961) × 2∼3, 30% ogm[GRCh38] Xq22.1q23(99549944_112974556) × 2∼3, 36% | arr[GRCh38] Xp22.33q28(251885-156003433) × 2-3, 70% | 47,XXX[40]/45,X[9]/46,XX[11], 67% and 15% |
| C22A0980-P | Clinical significant variant not detected | Clinical significant variant not detected | 45,X[4]/46,XX[54], 7% |
| C22A1244-P | Clinical significant variant not detected | arr[GRCh38] 21q11.2q22.3(13644166-46673449) × 2-3, 28% | 47,XY,+21[9]/46,XY[54], 14% |
| C22A1261-P | ogm[GRCh38] Yp11.2q11.23(2465162_25007649) × 0-1, 43% | arr[GRCh38] Yp11.2q12(2782384-26653507) × 0-1, 16% | 45,X[13]/46,XY[37], 26% |
| C23A0069-P | ogm[GRCh38] Xq11.1q28(62521449_156025612) × 1-2, 67% | arr[GRCh38] Xp22.33q28(251885-156003433) × 1-2, 63% | 45,X[42]/46,XX[26], 62% |
The limitations of this study include the relatively small sample size and the absence of multicenter evaluation. Future studies with larger sample sizes and multiple center participation are strongly warranted. Additionally, prospective studies that enroll study subjects eligible for invasive prenatal diagnosis without further selection are essential to more extensively evaluate the performance and clinical utility of prenatal OGM. Furthermore, evaluation of OGM's performance for different types and sizes of SV and the impact of different coverage depths on sensitivity and specificity, along with the establishment of a general population-based SV database, are strongly recommended before widespread application of OGM in prenatal diagnostic testing in the future.
Conclusions
In conclusion, our study demonstrates the successful application of OGM in prenatal diagnostic testing, achieving the highest diagnostic yield compared to current SOC testing. However, further research with a prospective multicenter design and larger sample size is warranted before its stable implementation in prenatal diagnosis. More internal controls and population-scale OGM database will improve SVs interpretation and enhance genetic counseling.
Supplemental Material
Supplemental material is available at Clinical Chemistry online.
Nonstandard Abbreviations
OGM, optical genome mapping; SV, structural variant; SOC, standard of care; CMA, chromosomal microarray analysis; KT, karyotyping; CNVs, copy number variations; BTs, balanced translocations; GS, genome sequencing; AF, amniotic fluid; NIPT, noninvasive prenatal testing.
Human Genes
TMEM242, transmembrane protein 242; PDE10A, phosphodiesterase 10A; VCL, vinculin.
Author Contributions
The corresponding author takes full responsibility that all authors on this publication have met the following required criteria of eligibility for authorship: (a) significant contributions to the conception and design, acquisition of data, or analysis and interpretation of data; (b) drafting or revising the article for intellectual content; (c) final approval of the published article; and (d) agreement to be accountable for all aspects of the article thus ensuring that questions related to the accuracy or integrity of any part of the article are appropriately investigated and resolved. Nobody who qualifies for authorship has been omitted from the list.
Min Xie (Conceptualization-Equal, Data curation-Equal, Formal analysis-Lead, Funding acquisition-Equal, Investigation-Lead, Methodology-Equal, Visualization-Equal, Writing—original draft-Equal), Zhaojing Zheng (Conceptualization-Equal, Data curation-Equal, Methodology-Lead, Validation-Equal, Writing—original draft-Lead), Ying Zhou (Data curation-Equal, Formal analysis-Equal, Investigation-Equal, Resources-Lead, Validation-Equal, Visualization-Equal, Writing—original draft-Equal), Yuxin Zhang (Data curation-Equal, Formal analysis-Equal, Investigation-Equal, Resources-Equal, Validation-Lead, Visualization-Lead, Writing—original draft-Equal), Qiong Li (Methodology-Supporting, Resources-Equal, Writing—original draft-Supporting), Liyun Tian (Data curation-Supporting, Resources-Equal, Visualization-Supporting), Juan Cao (Investigation-Supporting, Resources-Equal, Validation-Equal, Visualization-Supporting), Yanting Xu (Formal analysis-Equal, Investigation-Equal, Validation-Equal, Visualization-Equal), Jie Ren (Formal analysis-Equal, Investigation-Equal, Visualization-Equal), Qi Yu (Data curation-Supporting, Visualization-Supporting), Shanshan Wu (Formal analysis-Supporting, Supervision-Equal, Visualization-Supporting), Shu Fang (Methodology-Supporting, Writing—original draft-Supporting), Danyan Zhuang (Data curation-Supporting, Project administration-Equal, Visualization-Supporting), Juan Geng (Conceptualization-Equal, Data curation-Lead, Methodology-Equal, Project administration-Lead, Validation-Equal, Writing—original draft-Equal, Writing—review & editing-Equal), Changshui Chen (Funding acquisition-Lead, Methodology-Equal, Supervision-Equal, Writing—review & editing-Equal), and Haibo Li (Conceptualization-Lead, Funding acquisition-Equal, Methodology-Equal, Project administration-Equal, Supervision-Lead, Writing—review & editing-Lead)
Authors’ Disclosures or Potential Conflicts of Interest
Upon manuscript submission, all authors completed the author disclosure form.
Research Funding
This work was supported by grants from the Social Development Public Welfare Foundation of Ningbo (No. 202002N3150, 2022S035), Innovation Project of Distinguished Medical Team in Ningbo (No. 2022020405), First Municipal Medical and Health Brand Foundation of Ningbo (No. PPXK2018-06), Medical and Health Project of Zhejiang province (No. 2022KY1157).
Disclosures
Y.-T. Xu, J. Ren, and S. Fang are employees of Hangzhou Juno Genomics. Z.-J. Zheng is a co-founder and CEO, and J. Geng is a co-founder and CTO of Hangzhou Juno Genomics.
Role of Sponsor
The funding organizations played no role in the design of study, choice of enrolled patients, review and interpretation of data, preparation of manuscript, or final approval of manuscript.
Acknowledgments
The authors thank the individuals and their families who participated in this study.
References
Author notes
Min Xie, Zhao-Jing Zheng, Ying Zhou and Yu-Xin Zhang contributed to this work equally.
