


Abstract
Acute kidney injury (AKI) is a serious complication affecting up to 15% of hospitalized patients. Early diagnosis is critical to prevent irreversible kidney damage that could otherwise lead to significant morbidity and mortality. However, AKI is a clinically silent syndrome, and current detection primarily relies on measuring a rise in serum creatinine, an imperfect marker that can be slow to react to developing AKI. Over the past decade, new innovations have emerged in the form of biomarkers and artificial intelligence tools to aid in the early diagnosis and prediction of imminent AKI.
This review summarizes and critically evaluates the latest developments in AKI detection and prediction by emerging biomarkers and artificial intelligence. Main guidelines and studies discussed herein include those evaluating clinical utilitiy of alternate filtration markers such as cystatin C and structural injury markers such as neutrophil gelatinase-associated lipocalin and tissue inhibitor of metalloprotease 2 with insulin-like growth factor binding protein 7 and machine learning algorithms for the detection and prediction of AKI in adult and pediatric populations. Recommendations for clinical practices considering the adoption of these new tools are also provided.
The race to detect AKI is heating up. Regulatory approval of select biomarkers for clinical use and the emergence of machine learning algorithms that can predict imminent AKI with high accuracy are all promising developments. But the race is far from being won. Future research focusing on clinical outcome studies that demonstrate the utility and validity of implementing these new tools into clinical practice is needed.
Introduction
Acute kidney injury (AKI) is a sudden decrease in kidney function, with or without structural kidney damage, that is well recognized as a serious in-hospital complication of surgery, heart conditions, and sepsis (1). It is estimated to affect 10% to 15% of all hospitalizations and up to approximately 50% of all patients in the intensive care unit, where it can be associated with a high rate of major adverse kidney events and mortality (2). Fortunately, AKI is often preventable. As one estimate from the National Institute for Health and Care Excellence in the UK showed, if AKI was recognized and treated with attention to hydration and medication, 100 000 cases could be prevented and up to 42 000 deaths avoided annually (3). Although some of the predictors of AKI outcomes are nonmodifiable (such as baseline renal function and prior AKI), others are modifiable (such as volume overload), and modifying these factors may potentially have a positive impact on AKI outcomes (4). For this reason, early diagnosis is critical, so treatment can be initiated to prevent or limit irreversible kidney damage that could otherwise lead to significant morbidity and mortality.
However, AKI is a clinically silent syndrome in its early stages, and current detection primarily relies on measuring a rise in serum creatinine (SCr) or decreased urine output (5). The 2012 Kidney Disease: Improving Global Outcomes (KDIGO) guidelines that define AKI remain the most commonly used and rely on SCr (more readily available) or/and urine output. AKI can be classified into 3 stages: stage 1 (increase in SCr ≥ 0.3 mg/dL [26.5 µmol/L] in 48 hours or 1.5–1.9 times baseline SCr), stage 2 (2–2.9 times baseline SCr), and stage 3 [3 times baseline SCr or increase in SCr ≥ 0.4 mg/dL [35.4 µmol/L] or initiation of renal replacement therapy or in patients <18 years a decrease in estimated glomerular filtration rate (to <35 mL/min/1.73 m2)] (5). Detecting AKI using SCr and/or urine output can delay detection relative to end-organ damage and lead to slowness to react to developing AKI, potentially postponing interventions (6). Moreover, if AKI is identified early and/or the underlying cause of kidney injury is detected, then AKI may be reversed or treated, resulting in improved clinical outcomes and economic benefits (7). Over the past decade, innovations have emerged in the form of biomarkers and artificial intelligence tools to aid in the early diagnosis and prediction of imminent AKI (8). In this review, we summarize and critically evaluate the latest developments in structural biomarkers and artificial intelligence tools that seek to predict and diagnose AKI in its earliest stages, where initiation of treatment may prevent further progression and lower morbidity and mortality.
SCr and the Evolving Definition of AKI
The most widely adopted definition of AKI remains the KDIGO guidelines definition (Table 1) (5). However, since its publication over a decade ago, several studies have reported limitations using the 2012 KDIGO consensus SCr-based criteria (specifically the 0.3 mg/dL [26.5 µmol/L] increase). It had a high false-positive rate (∼30%) in patients with SCr ≥1.5 mg/dL [132.6 µmol/L], and a high false-negative rate in patients with low SCr, particularly children, females, and older people who have lower baseline SCr values (9–11). This led to the development of new evidence-based criteria using reference change value (RCV), which factor in biological and analytical variability of SCr (12, 13). In their study, which included 156 075 hospitalized children, Xu et al. (12) defined pediatric reference change value optimized for AKI in children (pROCK) as an SCr increase beyond the RCV, which they estimated as the greater of approximately 0.2 mg/dL (20 µmol/L) or 30% of initial SCr concentration (Table 1). Similarly, the AACC Academy (now known as the Academy of Diagnostics & Laboratory Medicine) convened an international group of academic nephrology and laboratory medicine experts to review the literature on this topic and, using RCV data from healthy subjects and individuals with chronic kidney disease, they proposed the 20/20 AACC-AKI definition: an increase of ∼0.2 mg/dL (20 µmol/L) or 20%, whichever is greater (Table 1) (13). These changes have already been separately linked to poor clinical outcomes (all-cause mortality) in the short and long term (14). The main advantage of the pROCK and AACC-AKI definitions over KDIGO is that they are more sensitive at detecting AKI for individuals with low initial concentrations of SCr (an increase of 0.2 mg/dL [20 µmol/L] in SCr from baseline vs an increase 0.3 mg/dL [26.5 µmol/L] in SCr from baseline) and more specific at detecting AKI for individuals with high initial concentrations of SCr (minimum increase of 20/30% from baseline SCr vs minimum increase of 50% from baseline SCr) (11, 13).
AKI stage 1 definitions.
| Guideline | AKI Stage 1 Definition | Comments |
|---|---|---|
| KDIGO [2012] | − Minimum increase of 0.3 mg/dL (26.5 µmol/L) in SCr within 48 hours Or − Minimum increase of 50% (1.5 times) in SCr baseline within 7 days | − High false-positive and false-negative rates− Does not take into consideration the fall in SCr levels− Does not include damage criteria |
| pRock | − Minimum increase of 0.2 mg/dL (17.7 µmol/L) in SCr within 7 days Or − Minimum increase of 30% (1.3 times) in SCr baseline within 7 days | − Limited to pediatrics − Linked to poor clinical outcomes− Does not include damage criteria |
| AACC | − Minimum increase of 0.2 mg/dL (17.7 µmol/L) in SCr Or − Minimum increase of 20% (1.2 times) in SCr baseline | − Linked to poor clinical outcomes− Does not include damage criteria |
In addition to the drawbacks of the consensus creatinine-based 2012 KDIGO definition mentioned earlier, there are 2 major proposed expansions to the original definition:
Expansion of the definition to also include a fall in SCr (as is currently done for troponin to diagnose myocardial infarction, to account for absence of available premorbid baseline or “reference” creatinine utilized in the definition of AKI) (15); and
Expansion of the definition to include damage criteria, based on AKI structural biomarker results (like neutrophil gelatinase-associated lipocalin (NGAL) or tissue inhibitor of metalloprotease 2 and insulin-like growth factor binding protein 7, TIMP-2.IGFBP7). This means that exisiting stages of AKI 1, 2, and 3 will now have A and B subcomponents (i.e., 1A, 1B, 2A, 2B, 3A, and 3B), with the A component representing a negative structural biomarker result, while the B component representing a positive structural biomarker result (16).
The limitations of the 2012 KDIGO definition described ealier pose a significant challenge for current biomarker and machine learning (ML) evaluation studies. There are now several alternate evidence-based definitions that may cause increased variability between studies and guidelines in terms of how AKI is diagnosed. Moving away from the 2012 KDIGO consensus creatinine-based definition and standardizing to an evidence-based one is a matter of the highest priority.
Another major complication affecting all of these definitions is that, currently, all are predominantly based on an elevation in SCr compared to a patient's baseline measurement. Consequently, the choice of the creatinine measurement that studies utilize as a baseline, also referred to as “baseline SCr,” serves as a crucial point of standardization in AKI prediction studies. This decision is particularly crucial as many patients have extensive histories of creatinine measurements, which can exhibit acute fluctuations (13). So determining a patient's true physiological baseline often becomes a matter of expert, albeit subjective, judgement. Other proposed approaches to define baseline SCr include use of admission SCr, use of the lowest inpatient SCr, or imputation of a value back calculated from an assumed estimated glomerular filtration rate of 75 mL/min/1.73 m2 (13). Each approach to define baseline SCr has its drawbacks, but this is another major source of variability between studies that needs to be addressed.
Utility of Alternate Functional Biomarkers: Cystatin C
Cystatin C (CysC) is constantly produced by all nucleated cells and cleared through glomerular filtration without reabsorption or secretion, making it a robust endogenous biomarker for the assessment of renal function (17). While its adoption in clinical practice has increased in recent years due to its inclusion in estimated glomerular filtration rate equations, its use in AKI remains much more limited despite promising studies (18). A recent meta-analysis of 12 studies evaluating the diagnostic value of serum CysC in predicting AKI in neonates showed good performance, with a pooled sensitivity, specificity, and area under the curve (AUC) of 0.84, 0.81, and 0.88, respectively (19). Similarly, in adults, a separate meta-analysis of 30 studies showed pooled sensitivity, specificity, and AUC of 0.82, 0.82, and 0.89, respectively (20). However, good AUCs alone are not enough to rush to adoption. Ultimately, its real test will always be: what value can it add vs measuring SCr alone?
Studies evaluating CysC's ability to predict AKI earlier than SCr have yielded mixed results. In the Translational Research Investigating Biomarker Endpoints for Acute Kidney Injury prospective cohort study involving 1150 high-risk adult cardiac surgery patients, CysC was less sensitive than SCr for detecting AKI (21). However, CysC appeared to identify a subset of patients with AKI at higher risk for adverse outcomes, so it may offer unique prognostic value relative to SCr-based AKI detection. This was confirmed in a separate observational study of 412 adults in the coronary care unit where CysC was a strong predictor of AKI and 2-year mortality (22). Similar mixed results have been reported in emergency medicine patients as well (23). Aside from its added prognostic value, CysC was shown to predict kidney recovery earlier than SCr in patients with AKI, potentially shortening their stay by 1 to 3 days and reducing cost (24). However, CysC failed to predict earlier recovery in certain clinical groups receiving therapy that may affect nucleated cells (like chemotherapy or with evidence of bone marrow engraftment) (24). Overall, when measured in combination with SCr, CysC may offer additional prognostic value and detect recovery earlier among patients with established AKI.
Additional barriers to the wide adoption of CysC for AKI are poor standardization, lack of availability from most in vitro diagnostics manufacturers, and high cost (in comparison with SCr) (13). Moreover, the lack of a universal CysC-based definition of AKI makes it much harder to interpret. What change in CysC indicates AKI? The AACC Academy proposed a cutoff of 15% based on RCV calculations, which was also independently derived as the optimal cutoff for detecting AKI in a study involving 1071 patients undergoing coronary angiography (13, 25). This cutoff is important to note for interpretation of past and future research studies evaluating CysC performance. For example, the Translational Research Investigating Biomarker Endpoints for Acute Kidney Injury study cited earlier used the same thresholds (≥25%, ≥50%, and ≥100%) to compare the performance of both creatinine and CysC for AKI detection, which may not have been appropriate because both markers have different RCVs (20% for SCr vs 15% for CysC). So smaller changes in CysC may be more significant than they are for SCr, and different thresholds for the diagnosis of AKI may be needed for each. However, the AACC Academy did not endorse the use of CysC for AKI due to the limitations listed earlier (13).
Utility of Structural Injury Biomarkers: NGAL and TIMP2.IGFBP7
NGAL and TIMP-2.IGFBP7 represent only 2 tests among over 20 AKI biomarkers that are being actively studied (26). However, in this review we have focused on these 2 because they are much widely available, have regulatory approval in more than one country, and are already being actively incorporated into clinical guidelines (27). For those interested in a more comprehensive review of AKI biomarkers and their progress into clinical practice, we refer them to the recent excellent consensus statement by Ostermann et al. (26) from the Acute Disease Quality Initiative on this topic.
NGAL
Human NGAL is a secretory protein from activated neutrophils, with a molecular weight of 25 kDa as a monomer, 45 kDa as a disulphide-linked homodimer, and 135 kDa as a conjugated heterodimer (28, 29). Mainly synthesized in the bone marrow during myelopoiesis and stored in the neutrophil granules, NGAL is thought to have a primary role in regulating iron transport to and from the cells due to its ability to bind siderophores (small iron-binding molecules) (29). Since iron is vital for proliferation of bacteria, which acquire iron from the host via release of siderophores, NGAL acts as a bacteriostatic agent by sequestering iron (29). In addition, NGAL is produced by epithelial cells and is thought to play a role in local defense against infections. This is supported by studies demonstrating that NGAL mRNA is expressed in nonhematopoietic tissues, such as colon, trachea, lung, and kidney epithelium and NGAL's elevated plasma levels in tissue-specific inflammatory conditions (29, 30). In the early 2000s, focus shifted to NGAL's potential clinical utility as an early biomarker for AKI due to the fact that it is produced in the loop of Henle and collecting ducts during injury and released predominantly into the urine (31). In addition, plasma NGAL produced systemically is normally taken up by the proximal tubules but may also appear in urine when the proximal tubules are injured. Promising results led to urine NGAL becoming the first AKI biomarker to receive regulatory approval in the European Union (27). However, it is important to note that only the monomeric form of NGAL (and to a lesser extent the heterodimeric form) is produced by the kidney epithelium, while all 3 molecular forms are found in neutrophils (32). A major limitation of NGAL immunoassays is that, rather than only detecting the monomeric form of NGAL, different antibodies against NGAL bind to several molecular forms with different affinities (32). As a result, conditions causing neutrophil activation (such as cardiac surgery) have been reported to confound interpretation, because the majority of NGAL detected is derived from neutrophils instead of kidney cells (33).
In terms of clinical performance, NGAL is one of the most studied biomarkers of AKI, so large meta-analyses of how well its measurement in urine and plasma predicts AKI are available. In one such recent analysis, Albert et al. (34) included 52 observational studies involving 13 040 patients in the setting of cardiac surgery, intensive care, or emergency department care. They reported similar discriminatory performance for severe AKI and AKI requiring dialysis, with meta-analysis AUCs of 0.75 to 0.80 for urine NGAL and 0.80 to 0.86 for plasma NGAL (34). Similarly, a recent meta-analysis by Meena et al. (35) focused on pediatric patients included 92 studies evaluating 13 097 participants and reported an AUC of 0.82 for urinary NGAL's ability to predict severe AKI. However, both meta-analyses report significant heterogeneity among studies and lack of well-defined cutoff values as serious limitations for implementation. This is particularly problematic for NGAL where there are several assays available to choose from (27), and these assays are not standardized and use different antibodies with different cross-reactivities to the different molecular forms of NGAL (32). So it is vital for clinical guideline developers reviewing NGAL literature to evaluate the assays used and to recognize that implementing universal cutoffs for NGAL may not be possible as long as the assays used are not standardized; it is likely that each assay will need to have its own cutoff and clinical performance for predicting AKI. To date, expert guideline developing organizations like KDIGO, the National Institute for Health and Care Excellence in the United Kingdom, the American College of Cardiology, and the AACC Academy have not endorsed the use of NGAL in clinical care (5, 13, 36, 37).
Tissue Inhibitor of Metalloprotease 2 and IGFBP7
Currently marketed under the name Nephrocheck® (bioMérieux), which involves urinary measurement and reporting of the product of TIMP2.IGFBP7 (also referred to as AKIRisk™), this was the first FDA-approved test for the assessment of risk for AKI (27). The proteins TIMP2 and IGFBP7, produced by the distal and proximal tubules, respectively, are both cell-cycle regulators that can induce cell-cycle arrest (38). Early validation studies of TIMP2.IGFBP7 reported best AUC (0.80) for predicting the development of stage 2 or 3 AKI within 12 hours, in comparison with other markers of AKI (including urine and plasma NGAL, plasma CysC, and others) (39). Two cutoffs were also derived, one for increased risk of developing AKI when urinary TIMP2.IGFBP7 was above 0.3 (ng/mL)2/1000 and another for greatly increased risk when the value was above 2.0 (ng/mL)2/1000. Since no other manufacturer currently exists for this test, it does not suffer from the same assay limitations as NGAL, and these derived cutoffs can be universally applied. However, there is concern due to significant overlap of the low (0.3) cutoff with values from healthy volunteers; a separate study including 750 healthy subjects derived a reference interval of 0.04 to 2.22 (ng/mL)2/1000 (40). Therefore, the 0.3 cutoff can yield a large number of false positives (around 50% of healthy patients), which severly limits the utility of this test in the general population (13).
In more than 1800 critically ill adult patients with different etiologies, urinary TIMP2.IGFBP7 has been shown to provide early detection and risk stratification for stage 2/3 AKI occurring within 12 hours (41). It performed similarly well in pediatric populations with different etiologies (AUCs 0.71–0.93) (13). It is not surprising that the test performs well in critically ill populations, simply because there are less healthy subjects being tested, which lowers the total number of false positives (42). So a recommended strategy was to implement risk stratification and only use this test in high-risk patients (42). However, its suboptimal specificity, lack of evidence of benefit in outcome studies, and limited performance studies outside of the intensive care unit or perioperative setting has led some organizations like the AACC Academy and the National Institute for Health and Care Excellence to also not recommend this test for routine clinical use (13). This has not stopped it from being included in some clinical guidelines, such as the Enhanced Recovery After Surgery (ERAS®) by the Cardiac Society for perioperative care of cardiac surgery patients (43), but its widespread clinical use is not yet evident (44).
Future Directions: Biomarkers
In addition to the recommendations outlined by the Acute Disease Quality Initiative (26), there are important considerations that must be included in biomarker validation studies:
Assay information (NGAL from one vendor is not the same as NGAL from another).
AKI definition used (KDIGO vs pROCK vs AACC-AKI).
Choice of population and AKI incidence.
Choice of sample collection time.
Choice of cutoffs.
Choice of prediction window (i.e., AKI occurring within 12, 24, or 48 hours).
If risk stratification is used, then detail that process.
Brief Introduction to ML
Before presenting examples of studies in which ML was used for AKI prediction, we introduce broad ML concepts. This is a brief primer into ML, and further details of these methods are beyond the scope of this review. ML is a subfield of artificial intelligence that consists of using computer algorithms to learn complex patterns from data without being directly programmed (45). ML can be broadly classified as (1) supervised, (2) unsupervised, and (3) reinforcement learning (46, 47).
Supervised ML relies on using “labeled” data; i.e., the value of the outcome is known (47). This data is used for (a) classification: discriminating between different clinical conditions and categories such as whether a patient has AKI or not or multilevel classification such as severity of AKI and (b) regression, or predicting the probability of a future event or the value of a continuous outcome variable such as estimating the risk of AKI following cardiac catheterization or length of hospital stay. Supervised ML algorithms include well-known regression models (linear and logistic), decision trees (a flow chart-like algorithm divides data into branches/subgroups), and support vector machines (a boundary line is drawn to separate different classes and maximizes margins), among others.
Unsupervised learning goal is to identify associations or grouping within the data without reference to the outcome (48–50). This method could be used for (a) clustering: identifying clusters that have similar characteristics (for example identifying phenotypic features of patients that would benefit from treating AKI with continuous renal replacement therapy) and (b) anomaly detection: identifying outliers or dissimilar values. Unsupervised ML algorithms include popular methods such as k-means clustering (observations are grouped based on similar data characteristics) and principal component analysis (dimensionality reduction method used for large dataset).
Reinforcement learning (RL) is a branch of ML focused on decision-making. In RL, an agent (or algorithm) is trained to learn the best action to achieve the maximum reward, often through a process of trial and error (51). Unlike traditional ML methods that tackle static tasks with predefined answers, RL agents continuously interact with their environment and optimize their actions based on feedback. When an action is taken, the agent receives feedback indicating the quality of the decision—whether it was beneficial, neutral, or detrimental. This feedback allows algorithms to adjust their strategies and actions dynamically. A recent practical application of RL was used to support individualized erythropoietin treatment for patients undergoing hemodialysis. Using an RL approach, treatment can be continuously adjusted based on the evolving health status of the patient, aiming for the long-term stabilization of hemoglobin levels (52).
Developing ML models involves data collection and preparation (steps 1 and 2), selecting variables (referred to as feature selection in the ML literature) of interest (step 3), model training and validation (step 4), and model deployment (step 5), followed by model monitoring and optimization (step 6) (53, 54). Data can be structured (for example physiological parameters or laboratory results from the electronic health data record) or unstructured (images or videos) and can be from a single source (such as a single health care system, with its own potential biases) or from a consortium (steps 1 and 2). Prior to training, the data must be cleaned and organized into a computable format. Following that, variables of interest must be selected. Even though the electronic health record might have several datapoints, it is advisable to look at the data structure and availability including missing data and remove collinear and highly redundant variables to reduce the dimensionality of the data in big datasets (step 3). A model is then selected or fitted to a training set and internally validated to improve its accuracy and identify errors and externally validated to assess for its generalizability (step 4). The model can then be deployed into the real world to be implemented and monitored to ensure it is working as intended and providing accurate predictions (steps 5 and 6) (Fig. 1) (46, 55).
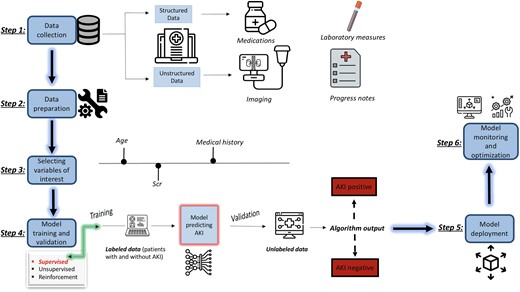
Summary of the process of implementing supervised ML to predict AKI. Color figure available at https://dbpia.nl.go.kr/clinchem.
It is important before deployment of any model is to evaluate the algorithm (step 4). By far the most common way to evaluate models is using area under the receiver operating characteristics, a plot of true positive rate (recall) against false-positive rate. If the AUC is 1, then the binary classification model is able to perfectly differentiate between positive and negative class points correctly. If the AUC is 0, then the classifier would be predicting all positives as negatives and all negatives as positive. If the AUC is 0.5, then the classifier is unable to make the distinction between positive and negative class points and it is predicting a random class, so the model is useless. The closer the AUC is to 1, the better the performance of the ML model. In order to adopt ML models, it is important not only that the model performs well but that it can be interpretable, i.e., humans are able to understand why the model prediction was possible.
Summary of ML and AKI Studies
We provide a summary of several studies that have used different ML algorithms to predict AKI risk (Table 2). We used PubMed and the following Medical Subject Headings terms to identify these studies: ML, artificial intelligence, and AKI. Please note this is not a systematic review; rather, these are examples reflecting the current literature. We present a few key observations from the studies that are summarized in Table 2:
The patient population varied across studies, thus limiting the generalizability of the algorithms. Studies have primarily focused on hospitalized adults with a few restricting their predictions to those in intensive care units or following cardiac surgery. While these clinical scenarios are important and are reflective of clinical areas where AKI is most commonly seen, future research should consider additional clinical scenarios, such as AKI developing in general medical wards or after orthopedic surgery.
Health equity considerations were variably considered in the selected studies. Current literature advocates that underrepresented cohorts should be specifically evaluated during ML model development and post-deployment monitoring strategies to ensure that the models do not result in unintended harm to specific subpopulations and remain generalizable to the target population in the region they are deployed (72). Data on sex and ethnicity/race distribution are lacking in several studies. Knowing that in-hospital and outpatient outcomes following AKI development vary by socioeconomic standing means that incorporating social determinants of health measures into future ML models may help improve model performance and attenuate health disparities (72–74).
Baseline creatinine definition is inconsistent across studies, and this reflects the current evolving definition of AKI. For future generalizability of ML models, standardized baseline SCr and AKI definitions are needed, and reporting the method by which these were calculated is necessary.
Most models predicted stage 3 AKI, and fewer models predicted less severe AKI stages.
Several ML algorithms were used, most commonly logistic regression. All examples included in Table 2 used supervised ML models.
Only 2 studies used time updated variables to predict AKI; i.e., a dynamic model was built in which the model continuously predicted AKI risk over time based on updated variable results (56, 59). All other studies relied on fixed variables usually at time of hospital admission.
The method by which variables were selected was unclear in several studies, and the number of variables included ranged from 4 to 154.
Missing data was handled differently across studies (e.g., excluded, imputed).
Common variables that were considered influential in predicting AKI included SCr, albumin, and glucose. However, important variables were inconsistently reported in the results.
Most algorithms were internally and not externally validated, limiting the generalizability of the results.
Area under the receiver operating characteristics was the most common metric evaluating ML models across all papers.
Overview of manuscripts predicting AKI using ML methods.
| Year | Author | Patient population | Dependent variable | Independent variable(s) | Algorithm(s) used | Performance (AUC) | Comments |
|---|---|---|---|---|---|---|---|
| 2018 | Koyner et al. (56) | −US adults admitted to UC (mean age range: 56–61, Black: 50%, women: 54%) − Hospitalized patients (ward, ICU, ED) | SCr-based stage 2 AKI within 24 and 48 hours of first SCr | Demographics, vital signs, laboratory values, interventions, medications, nursing documentation, diagnosis n= 154 | Gradient Boosted ML | − Stage 2 AKI within 24 hours: 0.9 [0.9, 0.9] − Stage 2 AKI within 48 hours: 0.87 [0.87, 0.87] | − Baseline SCr: Admission SCr and updated on a rolling basis for 48-hour and 7-day criteria − Missing values: carried forward during 12 hour window or imputed (median or mode) − Internally validated − Influential variables reported |
| 2018 | Chen et al. (57) | Adult patients hospitalized for at least 2 days at a US hospital | Stage 3 AKI using KDIGO | Demographics, vitals, laboratory values, comorbidities, admission diagnosis, medication, medical history n = 4 using McDSL; 6 using McDSL + PloS One literature review; 88 using LR | K-nearest neighbor, decision trees, backpropagation neural network, RF, EC | Average AUC using all methods: − McDSL: 0.812 − McDSL + PloS One: 0.814 − LR: 0.837 | − Baseline SCr: Last measurement within 2-day time window prior to hospital admission or first SCr measured after admission − Missing values were treated as separate categories “unknowns” − Internally validated − Most influential variables reported |
| 2018 | Mohamadlou et al. (58) | US adults from inpatient wards and ICUs at 2 hospitals (46% women, age range: 18–70+) | Stage 2/3 AKI at onset and 12, 24, 48, and 72 hours before onset using National Health Service— England AKI algorithm | Clinical and demographic data n = 6 | XGBoost | − 0.87 [0.87, 0.99] at onset − 0.80 [0.79, 0.81] 12 hours earlier − 0.79 [0.79, 0.80] 24 hours earlier − 0.76 [0.75, 0.77] 48 hours earlier − 0.73 [0.72, 0.74] 72 hours earlier | − Baseline SCr: Using lowest value from past 0–7 days or median value from past 8–365 days − Missing data: last observation carried forward − Internally validated |
| 2019 | Simonov et al. (59) | Hospitalized US adults (3 hospitals) (median age: 61–65; women: 51–56%; 16–20% Black) | AKI using KDIGO within 24 hours of a given observation | Demographics, medical history, laboratory value n = 36 | LR | − Validation dataset from − Hospital 1: 0.74 [0.73, 0.74] − Hospital 2: 0.69 [0.68, 0.69] − Hospital 3: 0.76 [0.75, 0.77] | − Baseline SCr: Lowest measured SCr over preceding 7 days − Internally (hospital 1) and externally (hospital 2 and 3) validated − Influential variables reported |
| 2019 | Flechet et al. (60) | Hospitalized adults in 5 ICUs in Belgium (median age range: 65–66, women: 38–38.7%) | AKI stage 2/3 using KDIGO in the 7 days following ICU admission | Laboratory data, hours in ICU, vital signs, medications, hemodynamic support on admission, suspected sepsis on admission n = 3 for admission cohort, 8 for day 1 cohort, and 13 for day 1 + cohort | LR | − 0.76 [0.66, 0.85] from admission cohort (using SCr from admission or urine output) − 0.87 [0.79, 0.95] from day 1 cohort (using SCr on first day in ICU or urine output) − 0.85 [0.75, 0.96] from day1 + cohort (using SCr 24 hours after admission) | − Baseline SCr: Lowest SCr value identified in the 3 months prior to and not including admission. If no baseline SCr was available, it was calculated with the MDRD formula using an estimated glomerular filtration rate of 75 mL/min/1.73 m2 AND using urine output |
| 2019 | Tomasev et al. (61) | − US Veterans (age: 62.4 years, Black: ∼19%, 6.4% women) − Inpatient and outpatient | AKI using KDIGO occurring in the next 48 hours: increase in SCr of 0.3 mg/dL (26.53 µmol/L) within 48 hours or increase in SCr of 1.5 times baseline SCr | Outpatient visits, admissions, ICD diagnosis codes, CPT codes, laboratory results, medications, prescriptions, orders, vital signs, health factors, note titles n = 117 | Recurrent neural networks | − Any AKI: 0.92 [0.92, 0.92] − AKI stage 2 and 3: 0.96 [0.96, 0.96] − AKI stage 3: 0.98 [0.98, 0.98] | − Baseline SCr: Baseline annualized SCr was used when previous measurements were available. When baseline SCr was not available MDRD was applied to estimate value − Internally validated |
| 2019 | Zimmerman et al. (62) | MIMIC-III of patients admitted to critical care units at Beth Israel Medical Center (NY) i.e., US adults (age: 60.9 ± 16.1; women: 40.7%; African American: 7%) | AKI using KDIGO during 48 to 72 hours from ICU admission | Demographics, vital signs, laboratory values, mechanical ventilation n = 32 | LR, RF, multilayer perceptron (type of ANN) | − Baseline SCr: Pre-ICU creatinine − Missing data imputed by Multivariate Imputation by Chained Equations (MICE), for variables >20% missing they were excluded − Internally validated | |
| 2020 | Churpek et al. (63) | − US adults (63 ± 18 years, 18% African American, 54% women) − Hospitalized patients (ED, ICU, operating room) | SCr-based stage 2 or higher AKI within 48 hours of each observation | Demographic, patient location, vital signs, laboratory values, nurse documentation n = 59 | Gradient Boosted ML AKI prediction model developed at UC | − At UC: 0.86 [0.86, 0.86) − At LUMC: 0.86 [0.84, 0.86] − At NUS: 0.86 [0.86, 0.86] | − Baseline SCr: admission SCr and updated on a rolling basis for 48-hour and 7-day criteria per KDIGO − Missing data was imputed − Internally (UC) and externally (LUMC and NUS) validated − Most influential variables reported |
| 2020 | Martinez et al. (64) | US adults admitted to ED then hospitalized (age range: 18->90; women: 52%; Black: 37%) | AKI stage 1 and 2 using KDIGO at 24, 48, and 72 hours after ED evaluation | Demographics, arrival mode, vital signs, chief complaints, medical history, active medical problems, laboratory values n = 42 | RF | AKI stage 1 or higher: − 0.80 [0.79, 0.80] within 24 hours − 0.76 [0.75, 0.76] within 48 hours − 0.74 [0.74, 0.75] within 72 hours AKI stage 2 or higher: − 0.81 [0.80, 0.82] within 24 hours − 0.77 [0.77, 0.78] within 48 hours − 0.75 [0.74, 0.75] within 72 hours | − Baseline SCr: SCr measured at ED arrival − Missing data imputed or excluded − Internally validated − Influential variables reported |
| 2020 | Qu et al. (65) | Patients at a tertiary center in China hospitalized for acute pancreatitis (age range: 37–52 years; 35% women) | AKI using KDIGO | Demographic, laboratory data, BMI, hypertension, disease severity score, ARDS, IL-6 n = 23 | LR, CART, RF, support vector machine (SVM), XGBoost | − LR: 0.87 − CART: 0.80 − XGBoost: 0.91 − SVM: 0.86 − RF: 0.88 | − Mean substitution used for mssing data − Internally validated − Influential variables reported |
| 2020 | Tseng et al. (66) | Patients who underwent coronary artery bypass, valve replacement surgery, or both at Far Eastern Memorial Hospital, New Taipi City | AKI using KDIGO | Demographic characteristics, clinical condition, preoperative biochemistry data, preoperative medication, and intraoperative time-series hemodynamic features n = 94 | LR, simple decision tree, RF, SVM, XGBoost, RF + XGBoost | − LR: 0.81 [0.74, 0.87] − Simple decision tree: 0.78 [0.71, 0.85] − RF: 0.84 [0.77, 0.89] − SVM: 0.83 [0.75, 0.89] − XGBoost: 0.84 [0.78, 0.89] − RF + XGBoost 0.84 [0.78, 0.89] | − Baseline SCr: SCr before suregery − Internally validated − Most influential variables reported |
| 2021 | Dong et al. (67) | Pediatric critical care patients and cardiothoracic ICU of 3 hospitals in the US and UK (median age range 2–7 years; 46% women) | Mean normal creatinine level for age and gender at time of measurement of 1st SCr contributing to AKI | Vital signs, laboratory values, medication history, ventilation parameters n = 15 | LR | ||
| 2021 | Qian et al. (68) | MIMIC-III of patients admitted to critical care units at Beth Israel Medical Center (NY) (age range: 64–68) | AKI using KDIGO after entering ICU for 24 hours | Demographics, laboratory tests, BMI n= 31 | LR, SVM, RF, XGBoost, LightGBM | − LR: 0.74 − SVM: 0.74 − RF: 0.73 − XGBoost: 0.76 − LightGBM: 0.91 | − Baseline SCr: Minimum SCr on day 1 of ICU admission and urine volume − Medical records with >50% missing values on select features were removed. Other missing values were replaced with MICE − Internally validated − Influential variables reported |
| 2022 | Demirjian et al. (69) | Patients undergoing cardiac surgery in the US (age: 66 [56, 74], 33% women of derivation cohort) | AKI stage 2 or higher using KDIGO after cardiac surgery within 72 hours and 14 days after surgical procedure | Laboratory tests from first postoperative metabolic panel n = 8 | LR | Derivation cohort: − Moderate to severe AKI within 72 hours: 0.88 [0.87, 0.99] − Moderate to severe AKI within 14 days: 0.90 [0.89, 0.91] Validation cohort: − Moderate to severe AKI within 72 hours: 0.68 [0.84, 0.88] − Moderate to severe AKI within 14 days: 0.87 [0.84, 0.91] | − Baseline SCr: Most recent preoperative Scr − Multiple imputation using bootstrapping and predictive mean matching − Internally (1 US medical center) and externally (3 US community hospitals) validated |
| 2022 | Ejmalian et al. (70) | Patients undergoing coronary artery bypass grafting, valvular, transplant, and aortic in Tehran | AKI at the first and seventh day after surgery using KDIGO criteria | Demographic characteristics and type of surgery, past medical history, drug history, laboratory information, anesthesia and surgery information, and postoperative variables n = 41 | Adaptive boost, XGBoost, Decision tree, LR, multilayer perceptron, RF, SVM | ||
| 2022 | Zhang et al. (71) | MIMIC-III of patients admitted to critical care units at Beth Israel Medical Center (NY) with acute cerebrovascular disease (n = 2935), local database from First Affiliated Hospital of Fujian Medical University in China with acute cerebrovascular disease (n = 499) | AKI using KDIGO | Demographics, medications, comorbidities, laboratory test results, prognosis (if patient died after discharge) n = 23 | XGBoost, Adaptive boosting, RF, LR, multilayer perception | Using MIMIC-III: − XGBoost: 0.88 [0.83, 0.93] − Adaptive boosting: 0.78 − RF: 0.87 − LR: 0.85 − Multilayer perception: 0.78 Using local database: − XGBoost: 0.78 − Adaptive boosting: 0.79 − RF: 0.78 − LR: 0.78 − Multilayer perception: 0.67 | − Baseline SCr: minimum value after ICU admission − Internally (using MIMIC-III) and externally validated (First Affiliated Hospital of Fujian Medical University in China) − Most influential variables reported |
Abbreviations: ANN, Artificial Neural Network; ARDS, acute respiratory distress syndrome; BMI, body mass index; CART, classification and regression tree; CPT, Current Procedural Terminology; EC, ensemble classifier; ED, emergency department; ICD, International Statistical Classification of Diseases and Related Health Problems; ICU, intensive care unit; LightGBM, light gradient boosting machine; LR, logistic regression; LUMC, Loyola University Medical Center; MIMIC-III, Medical Information Mart for Intensive Care-III; MDRD, Modification of Diet in Renal Disease; MICE, multivariate imputation by chained equations; NUS, NorthShore University Health System; SVM, support vector machine; XGBoost, extreme gradient boosting.
n refers to the number of independent variables used in the model.
Recommendations for Algorithms to Predict AKI
We suggest the following framework when building ML algorithms for AKI prediction. For the interest of the reader, further information on ML use in healthcare and health outcomes research can be found in the recent literature (46, 75, 76), Moreover, these recommendations are consistent with the International Federation of Clinical Chemistry and Laboratory Medicine's newly released recommendations for ML in laboratory medicine (77):
Clearly characterize the population being studied including age, race, ethnicity, sex, and socioeconomic position. This will better allow investigators to evaluate “algorithmic fairness” and provide transparency for the readership and end users (78). Limitations and underlying biases should be evaluated and clearly stated.
A standardized definition of baseline SCr should be reported in all studies, and a unified approach to define AKI stages is needed for the purpose of labeling cases of AKI, training, and testing datasets for ML model development. These efforts should be led by the academic nephrology and laboratory medicine experts and will maximize the clinical usefulness of these ML models.
There is untapped potential in leveraging unstructured data (e.g., progress notes, imaging reports) for predicting AKI as can be seen in Table 2. We suggest future studies to explore the usefulness of unstructured data in improving model performance.
Criteria for variable selection should be clearly stated in the methods (e.g., all available data, based on literature review and expert opinion, and/or statistical variable selection methods).
It is essential to provide clear documentation on the strategy for handling missing data, including an investigation into the pattern of missingness. Many AKI prediction studies typically omit variables that may be missing in over 70% of the population or apply multiple data imputation methods. However, the use of these methods, or the omission of reporting on missing data could result in the exclusion of significant variables for predicting AKI or its outcomes. Leveraging larger, more diverse datasets may aid in refining ML models. Acknowledging that the underlying reasons for missing variables could potentially introduce bias in the results is a crucial factor to consider.
Creating dynamic ML models that are updated as variable values are updated throughout a patient's hospital stay to predict AKI can be useful in future studies directed at treatment of AKI.
We encourage researchers to report the most influential variables predicting AKI across all implemented algorithms. This would serve as a valuable resource for fellow researchers, enabling the identification and prioritization of high-impact risk factors for subsequent model construction and investigative endeavors.
When conducting feature selection, researchers should not only focus on identifying the most predictive variables but also consider the practical implications of integrating these variables into modern health information systems. Balancing the number and complexity of selected variables against the system's capacity and efficiency is critical to ensure high-performance, sustainable, and manageable systems suitable for real-world, enterprise-level deployments.
Among the Table 2 studies, we observed that models that were tested at external institutions demonstrated performance degradation. Accordingly, it seems that among the AKI models that are published to date there may be a risk for overfitting, indicating the importance of validation using external datasets. Therefore, we strongly recommend validating ML models both internally and externally in all cases. For internal validation, datasets should be partitioned into a training set for model development and a testing set to evaluate model performance. To assess a model's reproducibility and generalizability, it is beneficial to employ external datasets, ideally those that originate from different patient populations. Undertaking such validations often necessitates multi-institutional collaborations, securing additional institutional review board approvals, and potentially anonymizing datasets to facilitate sharing of data. We acknowledge the logistical challenges associated with this process, and it might not always be feasible to externally validate a model. Thus, when contemplating the deployment of an ML model at a new institution, it is crucial to assess its performance. There may be a need for retraining to ensure it is fine-tuned for the intended application, given the frequent variations in data distributions across institutions.
Area under the receiver operating characteristics is a discrimination measure, i.e., allows us to assess the model's ability to distinguish between those with and without AKI. We suggest that other performance measures also be included when reporting ML algorithms, such as measures of overall performance, calibration, reclassification, and clinical usefulness (79, 80). By reporting these measures, a more holistic view of the clinical relevance of the AKI model can be taken depending on the research question at hand. For example, if the goal is to compare classifications (patients with and without AKI) from 2 different models, then reporting reclassification measures would be helpful. Reporting the number of true positives—those who truly develop incident AKI—gained by using a model compared to no model would be helpful if we are to evaluate the clinical usefuleness of an ML algorithm.
Conclusion
So who is winning the race to predict AKI between biomarkers and machines? In light of the limitations we covered here, it looks like the race is currently closely balanced. Whether measuring serum CysC, urinary NGAL, or urinary TIMP2.IGFBP7, there are still a number of knowledge gaps that need to be covered in future studies, and Ostermann et al. (26) nicely summarize these and provide excellent recommendations for the field. In this review, we provided a similar set of recommendations for future ML development in this space. Future research should include patient outcome studies in which the clinical usefulness of ML models in real time are assessed. Ultimately, this race is not really about biomarkers vs machines; rather, it is a relay race with both biomarkers and machines on the same team, racing against AKI.
Nonstandard Abbreviations
AKI, acute kidney injury; SCr, serum creatinine; KDIGO, Kidney Disease: Improving Global Outcomes; RCV, reference change value; NGAL, neutrophil gelatinase-associated lipocalin; ML, machine learning; TIMP-2.IGFBP7, tissue inhibitor of metalloprotease 2 and insulin-like growth factor binding protein 7; CysC, cystatin C; AUC, area under the curve; RL, reinforcement learning.
Author Contributions
The corresponding author takes full responsibility that all authors on this publication have met the following required criteria of eligibility for authorship: (a) significant contributions to the conception and design, acquisition of data, or analysis and interpretation of data; (b) drafting or revising the article for intellectual content; (c) final approval of the published article; and (d) agreement to be accountable for all aspects of the article thus ensuring that questions related to the accuracy or integrity of any part of the article are appropriately investigated and resolved. Nobody who qualifies for authorship has been omitted from the list.
Lama Ghazi (Conceptualization-Equal, Data curation-Equal, Investigation-Equal, Writing—original draft-Equal, Writing—review & editing-Equal), Kassem Farhat (Data curation-Equal, Investigation-Equal, Writing—original draft-Equal, Writing—review & editing-Equal), Melanie Hoenig (Data curation-Equal, Investigation-Equal, Writing—review & editing-Equal), Thomas Durant (Formal analysis-Equal, Investigation-Equal, Writing—review & editing-Equal), and Joe El-Khoury (Conceptualization-Lead, Data curation-Lead, Project administration-Lead, Resources-Lead, Supervision-Lead, Writing—original draft-Equal, Writing—review & editing-Equal)
Authors’ Disclosures or Potential Conflicts of Interest
Upon manuscript submission, all authors completed the author disclosure form.
Research Funding
None declared.
Disclosures
M.P. Hoenig received an honorarium from Primed conference. T.J.S. Durant received consulting fees from Roche and Instrumentation Laboratories and honoraria from Abbott, AACC, and UConn Health. J.M. El-Khoury received consulting fees from Siemens Healthineers, honoraria from LabRoots and AACC, research funding from Bioporto and IDEXX, free instrumentation for research purposes from Bruker; serves on the boards of ADLM (formerly AACC); and is the Social Media Editor for Clinical Chemistry, ADLM.
