


To the Editor:
Phosphatidylethanol (in particular PEth 16:0/18:1—further abbreviated as “PEth”) has superior diagnostic performance compared to traditional alcohol biomarkers, especially for abstinence monitoring. It is common practice in US-based laboratories to conclude that PEth concentrations >20 ng/mL are highly suggestive of alcohol use (1) and a recent consensus statement on the use of PEth in clinical and forensic practice by the Society of PEth research (PEth-NET) proposed 20 ng/mL as a cutoff for “compatibility with abstinence or low alcohol consumption” (2). As PEth is increasingly used to monitor abstinence in life-impacting clinical and forensic settings (e.g., liver transplants, workplace testing, regranting of a driver’s license), high confidence in the 20 ng/mL cutoff is needed. In this letter, we describe validation of the 20 ng/mL cutoff, based on data from a unique large-scale study, utilizing a prediction model to evaluate claims of abstinence (3).
This validation was initiated after studying the justification (if any) for the most utilized PEth cutoffs in scientific literature, via a PubMed search for “PEth OR phosphatidylethanol,” with filter “humans," and selecting all articles available to us containing a statement on a cutoff for PEth to assess abstinence or minor alcohol intake. Only 82 out of 632 articles mentioned such a cutoff. Overall, 3 cutoffs were commonly used: 20, 35, and 8 ng/mL. Based on the cascade of references, we identified 4 origins: the United States Drug Testing Laboratories cutoff (USDTL) (4); the Swedish Harmonization cutoff (5); the limit of quantitation of a particular method; or no clear explanation. Strikingly, for the most referenced source of the 20 ng/mL cutoff (4) we could not find a patient-based validation scientifically underpinning this figure.
To seek more confidence in the cutoff of 20 ng/mL, we utilized data originating from 687 volunteers self-reportedly refraining from alcohol consumption for approximately 4 weeks. Information on alcohol use was collected via an AUDIT-C screening questionnaire, complemented with an estimation of the participants’ index of mean weekly alcohol consumption the month before the study (3). Per subject, 3 samples were obtained with 2-week intervals via self-sampling using 10 µL volumetric absorptive microsampling devices. PEth was quantified with a validated liquid chromatography–tandem mass spectrometry method (3). Following exclusion of subjects who admitted drinking; took a sample after more than 31 days of abstinence; had incomplete data sets; had starting values below the lower limit of quantitation (4 ng/mL); or were considered outliers [based on the ratio of 2 consecutive PEth values—a ratio higher than 0.7 was considered indicative of alcohol consumption (3)], data from 461 abstinent participants could be used.
From the model (3) we established that 20 ng/mL is the upper limit of the prediction interval for compatibility with abstinence after 27 days for an individual starting with a PEth concentration of 120 ng/mL. The latter corresponds to a PEth value indicating substantial alcohol consumption. Next, we calculated the resulting specificity, sensitivity, negative predictive value (NPV), and positive predictive value when using the 20 ng/mL cutoff after 27 days of abstinence. In individuals with an initial PEth value >120 ng/mL, the model predicts that, even when remaining abstinent, the final PEth value (27 days later) will still be >20 ng/mL. This positive result (i.e., >20 ng/mL) was “as expected” and these cases were defined as true positives (TP). In contrast, if the final PEth value of these individuals was <20 ng/mL, this was “not as expected” and hence these cases were referred to as false negatives (FN). Likewise, in individuals with an initial PEth concentration <120 ng/mL and a final PEth value <20 ng/mL this was “as expected”, i.e., correctly scored as being abstinent, hence true negatives (TN). In contrast, if the final value of these individuals was >20 ng/mL, this was “not as expected”, hence false positives (FP), i.e., incorrectly scored as not being abstinent. This allowed derivation of sensitivity (TP/(TP + FN)), specificity (TN/(TN + FP)) and NPV (TN/(TN + FN)). This classification strategy was repeated by changing the reference point from 120 ng/mL to all the levels mentioned in Fig. 1.
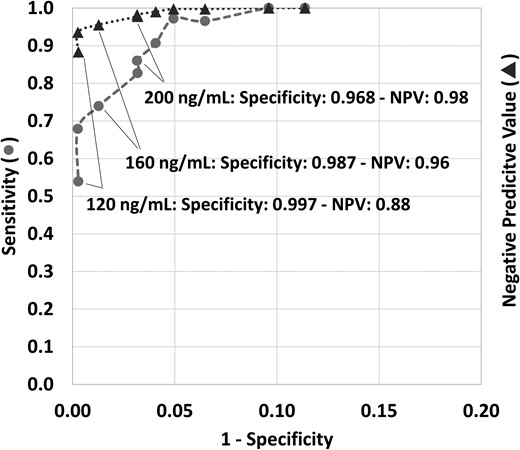
Sensitivity and negative predictive value (NPV) for the use of 20 ng/mL as a cutoff to score compatibility with abstinence or low alcohol consumption, plotted against 1 − specificity, depending on the PEth 16:0/18:1 starting concentration. Each data point represents a different PEth 16:0/18:1 starting concentration before a 27-day period of abstinence. With increasing 1 − specificity, the starting concentrations were respectively: 120, 140, 160, 180, 200, 220, 245, 270, 400, and 800 ng/mL. Circles represent sensitivity, triangles indicate the NPV. Note that the x-axis is only up to 0.20.
Overall, in this large data set the probability of not having consumed alcohol within the past 27 days in an individual with a final result <20 ng/mL, i.e., the NPV, was 0.88 at a starting concentration of 120 ng/mL, further increasing with higher starting concentrations. The probability of being <20 ng/mL in an individual who, according to the prediction model, should be negative, i.e., the specificity, is ≥0.987 when the original PEth concentration (27 days prior) is ≤160 ng/mL. Even when considering an original PEth concentration of 200 ng/mL, which is strongly suggestive of chronic and excessive alcohol consumption, there is a 0.968 probability of yielding a result <20 ng/mL after 27 days of abstinence. This high specificity objectively supports use of the PEth 20 ng/mL cutoff to score with high confidence “compatibility with abstinence or minor alcohol intake” following claims of 4 or more weeks of abstinence.
Author Contributions
The corresponding author takes full responsibility that all authors on this publication have met the following required criteria of eligibility for authorship: (a) significant contributions to the conception and design, acquisition of data, or analysis and interpretation of data; (b) drafting or revising the article for intellectual content; (c) final approval of the published article; and (d) agreement to be accountable for all aspects of the article thus ensuring that questions related to the accuracy or integrity of any part of the article are appropriately investigated and resolved. Nobody who qualifies for authorship has been omitted from the list.
Authors’ Disclosures or Potential Conflicts of Interest
No authors declared any potential conflicts of interest.
