


Abstract
Personalized reference intervals (prRIs) have the potential to improve individual patient follow-up as compared to population-based reference intervals (popRI). In this study, we estimated popRI and prRIs for 48 clinical chemistry and hematology measurands using samples from the same reference individuals and explored the effect of using group-based and individually based biological variation (BV) estimates to derive prRIs.
143 individuals (median age 28 years) were included in the study and had fasting blood samples collected once. From this population, 41 randomly selected subjects had samples collected weekly for 5 weeks. PopRIs were estimated according to Clinical Laboratory Standards Institute EP28 and within-subject BV (CVI) were estimated by CV-ANOVA. Data were assessed for trends and outliers prior to calculation of individual prRIs, based on estimates of (a) within-person BV (CVP), (b) CVI derived in this study, and (c) publically available CVI estimates.
For most measurands, the individual prRI ranges were smaller than the popRI range, but overall about half the study participants had a prRI wider than the popRI for 5 or more out of 48 measurands. The dispersion of prRIs based on CVP was wider than that of prRIs based on CVI.
The prRIs derived in our study varied significantly between different individuals, especially if based on CVP. Our results highlight the limitations of popRIs in interpreting test results of individual patients. If sufficient data from a steady-state situation are available, using prRI based on CVP estimates will provide a RI most specific for an individual patient.
Introduction
To interpret laboratory test results in a clinical setting for diagnosis, monitoring, and treatment decisions, clinicians typically use population-based reference intervals (popRIs) or decision limits. As the name suggests, popRIs are most commonly derived from population data, in which the popRIs limits are based on single measurement results derived from a group of reference individuals (1, 2). The total variation, therefore, contains both preanalytical and analytical variation as well as within- and between-subject biological variation (BV). It is recommended that laboratories define popRIs for their population and validate these when methods or instruments change (2). Furthermore, popRIs should be partitioned for sex, age groups, and so on if certain criteria are met (2). Nevertheless, these measures do not change the fact that popRIs represent the population. Thus, for an individual, a test result located within the popRI may be abnormal and, similarly, a test result outside of the popRI may be normal. A reference interval (RI) specific for each individual would therefore be preferable (3). We have previously developed an algorithm to establish personalized reference intervals (prRIs), using estimates of analytical and BV and previously analyzed test results from a steady-state situation (4–6). The BV of an individual is defined as the fluctuation in concentration or activity around the homeostatic set point (HSP) in steady state. This can be in the form of an average estimate (defined as CV; CVI) derived from a group of individuals or in the form of the within-person BV (CVP), derived from the individual's own data. Both types of estimates can be used to calculate an individual's prRI. The prRI is a novel tool that has the potential to improve on the diagnosis and follow-up of patients. However, the effect of establishing prRI based on group-based estimates compared to the individual's own CVP needs further study. Furthermore, there are no studies comparing popRI and prRIs derived from the same set of individuals.
In this study, we aimed to (a) establish and compare popRIs and prRIs for 48 commonly requested clinical chemistry and hematology measurands using prospectively collected samples obtained from the same reference individuals and (b) explore the effect of calculating prRIs utilizing both group-based and individually based BV estimates.
Materials and Methods
Study Population
The study was conducted at Acibadem Mehmet Ali Aydınlar University and Acibadem Labmed Clinical Laboratories, after approval by the Institutional Ethics Committee. The study was carried out in accordance with the Helsinki Declaration, and all participants provided written informed consent. The initially enrolled population consisted of 162 individuals above 18 years recruited from laboratory and university staff who completed a questionnaire based on the Clinical Laboratory Standards Institute EP28-A3C (2), to evaluate eligibility. Following this, 143 individuals (79 females and 64 males) were included in the popRI study (group 1). Median age [interquartile range (IQR)] of male and female subjects were 31 (24–38) and 24 years (22–32), respectively. Forty-one randomly selected participants from group 1 were included in the prRI study [21 females, 20 males, median age 30 (22–34.5)] (group 2). Exclusion criteria are summarized in Supplemental File 1 and in (7).
Sample Collection and Handling
Morning fasting blood samples were collected once from all subjects (group 1) to derive the popRIs and thereafter weekly for 5 weeks for subjects in group 2 from October 7 to November 21, 2020, to establish their prRIs. All samplings were performed under standardized conditions at the same time interval (8:00–10:30 Am), after 15 min resting and in most cases by the same phlebotomist. Samples for clinical chemistry and hormones analyses were centrifuged at 3000g and serum samples stored at −80°C until analysis. Hematology samples were analyzed within 1 h after sample collection.
Analytical Measurements
Chemistry and hormone analyses were performed on Dimension EXL, Advia 1800, and Centaur XPT (Siemens), hematology analyses on Sysmex XN 3000 (Sysmex), and hemoglobin A1c on Variant II Turbo (Biorad) at Acibadem Labmed Clinical Laboratories. Details on analytical methods/principles are provided in Supplemental Table 1. Samples from group 1 were analyzed in singlicate and samples from group 2 in duplicate. Internal quality control results were within acceptable limits (mean ± 3 SD) and external quality control results within those set by the providers.
Data Analysis
Data Analysis for Population-Based Reference Intervals
PopRIs were determined using parametric and nonparametric approaches as described in Clinical Laboratory Standards Institute EP28-A3C, depending on whether data were normally distributed or not. Details are given in (2) and Supplemental File 1.
Data Analysis for Personalized Reference Intervals
All measurement results lower than the limit of quantitation (LOQ) were excluded prior to analysis. If outliers were identified by the Dixon-Q test, CVP were not calculated. To assess whether an individual was in steady state for a measurand, linear regression analysis was performed. If the 95% CI of the slope of the regression line included 0, the individual was considered to be in steady state. If not, the data were not used for any further analysis.
Calculation of homeostatic set point and total variation around homeostatic set point
The HSPs were estimated by calculating the mean of the first datum of all duplicate measurements for each individual. The Roraas method (8) was applied to estimate the CVI, between-subject BV (CVG), and analytical variation (CVA) with 95% CIs based on the 5 weekly collected samples, as detailed in previous studies (8–11), for all 41 subjects and male and female subgroups. BV estimates in males and females were considered significantly different if the associated 95% CI did not overlap. To calculate the CVP, the first of the duplicate results for each of the 5 samples were used.
Biological (CVI) and analytical (CVA) variations are typically reported as CV%, while prRI limits are given as absolute numbers. Therefore, we calculated the corresponding SDs, SDI, and SDA for all measurands.
The total variation around the HSP, based on population-derived BV data (TVset(I)), was calculated as:
where SDI represents the within-subject BV, SDA is the analytical variation, n is the number of measurements, and z is a constant (z = 1.96 for 95% probability). TVset(I) was calculated both using SDI from study group 2 and meta-analysis derived BV data (transformed into SD) from the European Federation of Clinical Chemistry and Laboratory Medicine (EFLM) BV Database (12).
The TVset(P), the total variation around the HSP based on within-person BV, was calculated as:
Where SDP is the within-person BV, SDA is the analytical variation, n is the number of repeated measurements, and tα/2 is T table value corresponding to n − 1 degrees of freedom. SDTp represents the combined SDA and SDP.
Calculation of personalized reference intervals
prRIs were calculated for all measurands for each individual (3, 5) based on estimates of SDI;
based on each individual's SDP;
If the estimated CVI or CVP was >30%, prRIs were not calculated.
Number of Samples Required to Estimate the Homeostatic Set Point
We calculated the number of samples required to estimate the homeostatic set point (NHSP) based on CVI (NHSPI) or CVP (NHSPP) estimates for each individual, within 5%, 10%, and 15% deviation, using the following equations (13):
where D is the allowed percentage deviation from the HSP.
where Tα/2 is the t table value for n − 1 degrees of freedem and CVT is the total variation (the gaussian combination of CVA and CVP) calculated from the first of the duplicate 5-weekly measurements.
Reference Interval Index and Index of Individuality
For all measurands, we calculated 4 different RIs: popRI, prRI(CVi), prRI(CVi-EFLM), and prRI(CVp). These were used to derive the reference interval index (RII), defined as the ratio of an individual's prRI range [upper limit (UL) – lower limit (LL)] to the popRI range (UL-LL):
We also calculated the ratio of the number of measurands with a prRI range wider than the popRI to the number of measurands included in the study for each individual.
The index of individuality was calculated, using CVI and CVG estimates (a) from this study and (b) from the BV database as:
Results
The popRIs for 48 measurands based on samples from study group 1 are provided in Table 1. The data for basophils were excluded due to results being below the LOQ given by the manufacturer for most study subjects. For 7 measurands, the difference between the mean concentration of males and females was larger than 25% of the RI range, and, accordingly, the popRIs were partitioned (2, 14).
Population-based reference intervals for 48 clinical chemistry and hematology measurands (study group1, n = 143), with 90% CI for the lower and upper limits.
| Measurands | Group | n | Lower limit (90% CI) | Upper limit (90% CI) |
|---|---|---|---|---|
| Glucose, mg/dL | All | 143 | 69.1 (67.3–70.8) | 97.3 (95.6–99.0) |
| Hemoglobin A1c, % | All | 143 | 4.4 (4.3–4.6) | 5.9 (5.8–5.9) |
| BUN,a mg/dL | All | 143 | 7.0 (5.0–8.0) | 22.0 (20.0–25.0) |
| Creatinine,b mg/dL | F | 78 | 0.53 (0.51–0.56) | 0.87 (0.85–0.90) |
| Creatinine,b mg/dL | M | 64 | 0.70 (0.66–0.74) | 1.22 (1.17–1.25) |
| Uric acid,b mg/dL | F | 79 | 2.4 (2.1–2.6) | 5.3 (5.0–5.7) |
| Uric acid,a,b mg/dL | M | 64 | 3.7 (3.4–3.9) | 8.0 (7.4–8.6) |
| Albumin, g/dL | All | 143 | 3.6 (3.6–3.7) | 4.8 (4.8–4.9) |
| Total protein,a g/dL | All | 143 | 6.6 (6.4–6.9)c | 8.5 (8.3–8.7)c |
| Bilirubin,a total, mg/dL | All | 142 | 0.15 (0.13–0.17) | 1.33 (1.16–1.51)c |
| Bilirubin,a direct, mg/dL | All | 142 | 0.05 (0.05–0.06) | 0.29 (0.24–0.32)c |
| Cholesterol,a total, mg/dL | All | 143 | 116.1 (111.4–121.1) | 230.3 (220.8–240.1) |
| LDL-cholesterol, mg/dL | All | 143 | 51.8 (45.7–57.8) | 151.5 (145.4–157.6) |
| HDL-cholesterol, mg/dL | All | 143 | 28.1 (25.4–30.9) | 72.8 (70.1–75.6) |
| Triglyceride,a mg/dL | All | 139 | 31.5 (29.0–35.0) | 157.5 (139.0–177.0)c |
| ALT,b IU/L | F | 77 | 13.4 (11.5–15.1) | 31.6 (29.6–33.1) |
| ALT,a,b IU/L | M | 64 | 18.6 (17.0–20.8) | 62.2 (56.1–69.3)c |
| AST,a IU/L | All | 143 | 11.2 (10.6–11.9) | 29.4 (27.4–31.2)c |
| LDH, IU/L | All | 142 | 116 (112–122) | 200 (195–205) |
| ALP,a IU/L | All | 143 | 33.9 (31.7–36.2) | 101.4 (94.8–108.4)c |
| Amylase,a IU/L | All | 143 | 33.6 (31.3–36.1) | 107.0 (99.7–114.8)c |
| Lipase,a IU/L | All | 143 | 73.7 (68.3–79.6) | 259.3 (240.2–280.0)c |
| CK,a,b IU/L | F | 77 | 24.7 (22.2–28.0) | 117.4 (101.6–134.6)c |
| CK,a,b IU/L | M | 63 | 25.9 (20.6–32.3) | 265.1 (208–348.7)c |
| Calcium, mg/dL | All | 142 | 8.7 (8.6–8.8) | 10.4 (10.3–10.5) |
| Magnesium, mg/dL | All | 143 | 1.6 (1.5–1.6) | 2.2 (2.1–2.2) |
| TSH,a µIU/mL | All | 138 | 0.48 (0.31–0.66) | 3.51 (2.88–3.74)c |
| TT3,a ng/dL | All | 141 | 90 (87–93) | 164 (158–170) |
| FT3, pg/dL | All | 140 | 272 (266–279) | 396 (390–403) |
| FT4, ng/dL | All | 141 | 0.94 (0.91–0.97) | 1.38 (1.35–1.40) |
| Insulin,a µIU/mL | All | 143 | 3.6 (3.2–4.0) | 20.5 (18.4–20.8) |
| Testosterone,b total, ng/dL | F | 79 | 12.2 (9.5–14.8) | 49.0 (45.5–52.2) |
| Testosterone,b total, ng/dL | M | 64 | 183 (137–239) | 777 (713–831) |
| PSA, total,a,b ng/mL | All | 63 | 0.22 (0.20–0.27) | 1.42 (1.24–1.73)c |
| PSA, free,a,b ng/mL | All | 64 | 0.10 (0.08–0.12) | 0.73 (0.60–0.89)c |
| PTH,a pg/mL | All | 143 | 15.4 (13.8–17.2) | 91.1 (81.8–101–5)c |
| Erythrocytes,b ×106/µL | F | 79 | 4.0 (3.9–4.1) | 5.1 (5.0–5.2) |
| Erythrocytes,b ×106/µL | M | 64 | 4.5 (4.4–4.6) | 5.9 (5.8–6.1) |
| Hemoglobin,b g/dL | F | 79 | 11.7 (11.9–11.4) | 14.5 (14.7–14.2) |
| Hemoglobin,b g/dL | M | 64 | 13.3 (13.0–13.6) | 17.0 (16.6–17.3) |
| Hematocrit,b % | F | 79 | 35.9 (35.2–36.6) | 44.8 (44.1–45.5) |
| Hematocrit,b % | M | 64 | 40.6 (39.6–41.5) | 51.0 (50.1–52.0) |
| MCH, pg | All | 143 | 25.8 (25.4–26.2) | 31.8 (31.5–32.2) |
| MCHC, g/dL | All | 143 | 30.6 (30.3–30.8) | 34.8 (34.5–35.0) |
| MCV, fL | All | 143 | 80.7 (79.8–81.6) | 95.6 (94.7–96.5) |
| RDW-SD, fL | All | 143 | 35.8 (35.2–36.3) | 45.4 (44.8–46.0) |
| WBC,a,b ×103/µL | All | 143 | 3.6 (3.2–4.1) | 9.5 (9.1–10.0) |
| Neutrophils,a ×103/µL | All | 143 | 2.1 (2.0–2.3) | 6.2 (5.8–6.6) |
| Lymphocytes,a ×103/µL | All | 143 | 1.3 (1.2–1.4) | 3.7 (3.4–3.9) |
| Monocytes,a ×103/µL | All | 143 | 0.31 (0.29–0.33) | 0.89 (0.83–0.95)c |
| Eosinophils,a ×103/µL | All | 141 | 0.04 (0.03–0.05) | 0.48 (0.40–0.55)c |
| Thrombocytes, ×103/µL | All | 143 | 153 (140–160) | 358 (345–370) |
| MPV,a fL | All | 143 | 8.9 (8.7–9.1) | 12.6 (12.3–12.8) |
| PTC,a % | All | 143 | 0.18 (0.16–0.20) | 0.38 (0.36–0.41)c |
| PDW, fL | All | 142 | 9.4 (9.0–9.7) | 16.5 (16.1–17.4) |
| P-LCR, % | All | 143 | 14.9 (13.0–16.7) | 45.16 (43.3–47.0) |
Abbreviations: F, females; M, males; BUN, blood urea nitrogen; LDL, low-density lipoprotein; HDL, high-density lipoprotein; ALT, alanine aminotransferase; AST, aspartate aminotransferase; LDH, lactate dehydrogenase; ALP, alkaline phosphatase; CK, creatine kinase; TSH, thyroid-stimulating hormone; TT3, total triiodothyronine; FT3, free triiodothyronine; FT4, free thyroxine; PSA, prostrate-specific antigen; PTH, parathyroid hormone; MCH, mean corpuscular hemoglobin; MCHC, mean corpuscular hemoglobin concentration; MCV, mean corpuscular volume; RDW, red cell distribution width; WBC, white blood cell; MPV, mean platelet volume; PTC, plateletcrit; PDW, platelet distribution width; P-LCR, platelet-large cell ratio.
Log-transformed.
Bootstrap techniques.
Did not fully fulfil the criteria of 95% CI < 0.2 × range of the RI.
An overview of number of results lower than LOQ and outliers identified by Dixon-Q, Bartlett, and Cochran tests for the 5-weekly samples collected from study group 2 are provided in Supplemental Table 2. Overall, the median percentage of excluded data was 0.5%, with the highest number of data excluded for TSH (8.0%).
The CVI and CVG calculated for all subjects and separately for males and females are shown in Table 2. Significantly different CVI estimates between males and females were observed for total protein, total testosterone, white blood cells, neutrophils, lymphocytes, and platelets. Significant differences were also observed between the CVI values derived in this study (Table 2) and those reported based on meta-analysis of studies in healthy subjects in the EFLM BV database for albumin, total triiodothyronine, free thyroxine, platelets, mean platelet volume, plateletcrit, and platelet larger cell ratio (12).
Within-subject (CVI) and between-subject (CVG) BV estimates for 48 clinical chemistry and hematology measurands with 95% CIs for all study subjects (n = 41), males, and females.
| Measurands | Number of individuals | Total number of results | Mean concentration (95% CI) | CVA% (95% CI) | CVI % (95% CI) | CVG (95% CI) | |
|---|---|---|---|---|---|---|---|
| Glucose, mg/dL | All | 41 | 409 | 84.1 (83.4–84.8) | 2.3 (2.1–2.5) | 5.4 (4.9–6.2) | 4.6 (3.5–6.2) |
| M | 18 | 180 | 74.7 (83.9–85.6) | 5.3 (4.5–6.4) | 4.6 (3.5–6.2)b | ||
| F | 21 | 210 | 84.4 (83.4–85.5) | 5.6 (4.8–6.7) | 5.3 (3.7–8.2) | ||
| Hemoglobin A1c, % | All | 41 | 407 | 5.1 (5.1–5.2) | 1.2 (1.1–1.3) | 2.6 (2.3–3.0) | 6.2 (5.0–8.0) |
| M | 20 | 198 | 5.3 (5.2–5.3) | 2.0 (1.7–2.5) | 6.0 (4.5–8.9) | ||
| F | 21 | 210 | 5.1 (5.0–5.1) | 2.6 (2.2–3.1) | 6.3 (4.7–9.2) | ||
| BUN, mg/dL | All | 41 | 410 | 13.2 (12.9–13.6) | 4.5 (4.1–5.0) | 14.4 (12.9–16.2) | 18.8 (15.0–24.8) |
| M | 20 | 200 | 14.0 (13.4–14.5) | 13.7 (11.8–16.4) | 22.5 (16.5–34.0) | ||
| F | 21 | 210 | 12.5 (12.1–12.9) | 14.9 (12.9–17.7) | 13.6 (9.4–20.9) | ||
| Creatinine, mg/dL | All | 41 | 409 | 0.85 (0.83–0.87) | 4.3 (4.0–4.8) | 4.2 (3.4–4.9) | 18.5 (15.1–23.8) |
| M | 20 | 200 | 0.97 (0.95–0.99) | 3.2 (2.4–4.2) | 12.1 (9.1–17.9) | ||
| F | 21 | 210 | 0.74 (0.72–0.75) | 4.9 (3.8–6.2) | 11.9 (8.9–17.5) | ||
| Uric acid, mg/dL | All | 41 | 405 | 4.9 (4.7–5.0) | 2.6 (2.4–2.9) | 7.7 (6.9–8.7) | 20.2 (16.4–26.1) |
| M | 20 | 200 | 5.6 (5.4–5.7) | 6.4 (5.5–7.7) | 15.7 (11.7–23.2) | ||
| F | 21 | 206 | 4.2 (4.1–4.3) | 8.7 (7.5–10.4) | 12.5 (9.1–18.5) | ||
| Albumin, g/dL | All | 41 | 407 | 4.4 (4.4–4.5) | 3.7 (3.4–4.1) | 1.5 (0.0–2.2)a | 6.1 (5.0–7.9) |
| M | 20 | 200 | 4.5 (4.5–4.6) | 0.0 (0.0–1.5) | 5.2 (3.9–7.7) | ||
| F | 21 | 210 | 4.3 (4.3–4.4) | 2.5 (1.4–3.4) | 6.0 (4.4–8.8) | ||
| Protein, total, g/dL | All | 41 | 408 | 7.8 (7.7–7.8) | 2.7 (2.4–3.0) | 2.0 (1.5–2.5) | 4.1 (3.3–5.3) |
| M | 20 | 200 | 7.9 (7.8–7.9) | 1.0 (0.0–1.7) | 4.0 (3.0–5.9) | ||
| F | 21 | 210 | 7.7 (7.7–7.8) | 2.7 (2.0–3.4) | 4.0 (2.9–6.0) | ||
| Total bilirubin, mg/dL | All | 41 | 407 | 0.51 (0.48–0.54) | 5.0 (4.6–5.6) | 27.7 (25.0–31.2) | 40.3 (32.0–55.0)a |
| M | 18 | 178 | 0.54 (0.50–0.58) | 24.2 (20.7–29.1) | 33.7 (23.7–54.5) | ||
| F | 20 | 198 | 0.41 (0.39–0.44) | 30.6 (26.5–36.4) | 27.6 (18.6–45.7) | ||
| Direct bilirubin, mg/dL | All | 41 | 405 | 0.12 (0.11–0.13) | 10.3 (9.3–11.4) | 21.8 (19.3–24.6) | 35.3 (28.4–47.5) |
| M | 20 | 198 | 0.13 (0.12–0.14) | 17.4 (14.7–20.9) | 38.7 (28.4–59.8) | ||
| F | 21 | 205 | 0.11 (0.10–0.11) | 23.9 (20.2–28.5) | 29.7 (21.6–46.7) | ||
| Cholesterol, total, mg/dL | All | 41 | 409 | 167.4 (164.5–170.2) | 3.2 (1.9–3.5) | 5.2 (4.6–5.9) | 14.4 (11.7–18.6) |
| M | 20 | 200 | 164.6 (161.5–167.7) | 4.8 (4.0–5.8) | 10.7 (8.0–15.9) | ||
| F | 21 | 210 | 166.5 (161.8–171.2) | 5.4 (4.5–6.6) | 17.8 (13.5–26.1) | ||
| LDL-cholesterol, mg/dL | All | 41 | 409 | 103.4 (101.0–105.8) | 3.1 (2.8–3.4) | 6.9 (6.2–7.9) | 20.1 (16.3–26.0) |
| M | 20 | 200 | 105.2 (102.7–107.6) | 6.3 (5.4–7.6) | 13.3 (9.9–19.7) | ||
| F | 21 | 210 | 98.9 (94.8–102.9) | 7.5 (6.4–8.9) | 26.0 (19.6–38.5) | ||
| HDL-cholesterol, mg/dL | All | 41 | 409 | 53.5 (52.1–55.0) | 4.4 (4.1–4.9) | 4.3 (3.6–5.1) | 23.5 (19.2–30.5) |
| M | 19 | 190 | 47.8 (46.6–49.1) | 3.7 (2.5–4.9) | 15.6 (11.9–23.9) | ||
| F | 21 | 210 | 57.6 (55.3–59.8) | 4.8 (3.8–6.0) | 25.7 (19.5–37.9) | ||
| Triglyceride, mg/dL | All | 41 | 407 | 79.6 (75.5–83.7) | 4.4 (4.0–4.9) | 18.8 (16.9–21.2) | 40.9 (33.2–55.0) |
| M | 20 | 198 | 88.0 (82.1–94.0) | 18.8 (16.2–22.3) | 37.6 (28.1–59.2) | ||
| F | 20 | 200 | 66.8 (62.6–70.9) | 19.1 (16.5–22.7) | 34.9 (25.5–53.7) | ||
| ALT, IU/L | All | 41 | 407 | 26.6 (25.6–27.7) | 4.3 (3.9–4.8) | 14.8 (13.2–16.6) | 30.1 (24.4–39.7) |
| M | 20 | 190 | 33.0 (31.4–34.6) | 10.8 (9.2–12.9) | 26.9 (21.0–42.4) | ||
| F | 21 | 208 | 22.7 (21.8–23.6) | 12.4 (10.6–14.7) | 21.1 (15.5–31.5) | ||
| AST, IU/L | All | 41 | 407 | 18.6 (18.1–19.2) | 9.7 (8.9–10.8) | 10.7 (9.1–12.6) | 21.7 (17.5–28.5) |
| M | 20 | 198 | 20.7 (19.9–21.4) | 10.0 (7.9–12.5) | 20.0 (14.7–30.1) | ||
| F | 21 | 210 | 16.7 (16.1–17.4) | 11.5 (9.1–14.3) | 19.3 (14.2–28.9) | ||
| LDH, IU/L | All | 41 | 409 | 158.5 (156.2–160.8) | 3.5 (3.2–3.9) | 4.9 (4.2–5.6) | 11.2 (9.3–14.9) |
| M | 20 | 196 | 164.5 (161.7–167.3) | 3.6 (2.8–4.5) | 9.2 (6.9–13.7) | ||
| F | 21 | 210 | 157.2 (153.7–160.8) | 5.2 (4.3–6.4) | 13.0 (9.8–19.1) | ||
| ALP, IU/L | All | 41 | 407 | 63.4 (61.7–65.2) | 3.4 (3.1–3.7) | 5.5 (3.9–5.2) | 26.1 (21.2–33.7) |
| M | 20 | 200 | 72.0 (69.4–74.3) | 4.7 (3.9–5.8) | 20.4 (15.4–30.3) | ||
| F | 21 | 210 | 55.7 (53.7–57.6) | 4.6 (3.8–5.7) | 24.4 (18.5–35.8) | ||
| Amylase, IU/L | All | 41 | 397 | 61.0 (59.1–62.9) | 3.5 (3.2–3.9) | 6.6 (5.8–7.5) | 25.9 (22.1–35.2) |
| M | 20 | 196 | 64.4 (61.5–67.3) | 6.0 (5.0–7.2) | 27.5 (22.0–44.0) | ||
| F | 21 | 206 | 59.5 (57.1–61.9) | 8.1 (6.9–9.7) | 23.2 (17.6–34.5) | ||
| Lipase, IU/L | All | 41 | 405 | 142.0 (136.9–147.1) | 3.7 (3.4–4.1) | 12.8 (11.4–14.4) | 29.2 (24.0–38.9) |
| M | 20 | 198 | 149.7 (143.0–156.5) | 14.0 (12.1–16.7) | 23.4 (17.4–35.9) | ||
| F | 21 | 208 | 134.6 (127.2–142.0) | 11.4 (9.8–13.6) | 32.8 (24.5–48.9) | ||
| CK, IU/L | All | 40 | 390 | 74.2 (69.8–78.6) | 4.9 (4.5–5.5) | 15.4 (13.8–17.5) | 47.3 (37.7–62.9) |
| M | 19 | 186 | 89.4 (82.6–96.2) | 14.2 (12.2–17.1) | 39.6 (29.2–61.9) | ||
| F | 21 | 204 | 60.3 (55.5–65.1) | 16.4 (14.1–19.6) | 44.0 (33.0–68.3) | ||
| Calcium, mg/dL | All | 41 | 408 | 9.8 (9.8–9.9) | 2.3 (2.1–2.6) | 1.7 (1.3–2.1) | 2.1 (1.6–2.8) |
| M | 20 | 200 | 10.0 (9.9–10.0) | 1.3 (0.6–1.9) | 1.7 (1.1–2.6) | ||
| F | 21 | 208 | 9.7 (9.7–9.8) | 2.0 (1.4–2.6) | 1.8 (1.1–2.9) | ||
| Magnesium, mg/dL | All | 41 | 408 | 2.0 (1.9–2.0) | 3.2 (3.0–3.6) | 2.9 (2.3–3.4) | 4.7(3.8–6.2) |
| M | 20 | 199 | 2.0 (2.0–2.0) | 2.7 (2.1–3.5) | 5.3 (3.9–7.9) | ||
| F | 21 | 210 | 1.9 (1.9–2.0) | 3.7 (3.0–4.6) | 3.8 (2.6–5.9) | ||
| TSH, µIU/mL | All | 40 | 376 | 1.8 (1.7–1.9) | 3.0 (2.7–3.4) | 16.5 (14.9–18.7) | 37.6 (30.5–50.6) |
| M | 19 | 182 | 1.8 (1.7–1.9) | 15.6 (13.3–18.5) | 28.8 (20.8–43.9) | ||
| F | 21 | 201 | 1.8 (1.7–1.9) | 19.5 (16.9–23.0) | 44.4 (33.7–70.5) | ||
| TT3, ng/dL | All | 40 | 395 | 126 (124–128) | 5.2 (4.7–5.7) | 5.6 (4.7–6.6)a | 12.4 (10.0–16.1) |
| M | 19 | 185 | 130 (127–133) | 4.3 (3.0–5.7) | 14.3 (10.5–21.3) | ||
| F | 20 | 200 | 121 (119–123) | 6.0 (4.8–7.5) | 8.5 (6.1–12.9) | ||
| FT3, pg/dL | All | 40 | 395 | 340 (337–344) | 2.2 (2.0–2.4) | 4.6 (4.1–5.3) | 7.9 (6.3–10.3) |
| M | 19 | 186 | 358 (353–363) | 4.4 (3.7–5.4) | 6.7 (4.8–10.1) | ||
| F | 21 | 210 | 325 (321–329) | 4.8 (4.1–5.8) | 5.9 (4.3–8.9) | ||
| FT4, ng/dL | All | 40 | 397 | 1.18 (1.16–1.19) | 4.4 (4.0–4.9) | 3.7 (3.0–4.5)a | 7.8 (6.2–10.2) |
| M | 19 | 190 | 1.19 (1.17–1.21) | 3.9 (2.9–5.0) | 8.5 (6.3–12.8) | ||
| F | 21 | 210 | 1.18 (1.16–1.19) | 4.4 (3.3–5.6) | 7.3 (5.3–10.8) | ||
| Insulin, µIU/mL | All | 41 | 408 | 9.2 (8.7–9.6) | 8.6 (7.8–9.5) | 23.4 (20.9–26.4) | 35.8 (27.8–46.6) |
| M | 20 | 200 | 8.6 (8.0–9.1) | 24.5 (21.0–29.2) | 32.8 (23.4–50.6) | ||
| F | 21 | 208 | 9.8 (9.1–10.5) | 22.4 (19.1–26.7) | 36.1 (26.1–55.8) | ||
| Testosterone, Total, ng/dL | M | 20 | 198 | 536 (508–564) | 5.1 (4.5–6.0) | 8.2 (6.8–10.0) | 34.8 (25.8–52.3) |
| F | 21 | 210 | 31.1 (29.6–32.6) | 8.2 (7.3–9.5) | 12.5 (10.4–15.2) | 27.5 (20.5–41.1) | |
| PSA, total, ng/mL | M | 20 | 198 | 0.57 (0.53–0.61) | 5.7 (5.0–6.6) | 7.9 (6.5–9.8) | 38.9 (29.4–60.4) |
| PSA, free, ng/mL | M | 20 | 198 | 0.27 (0.26–0.27) | 5.5 (4.9–6.4) | 6.4 (5.0–7.9) | 37.3 (28.0–57.0) |
| PTH, pg/mL | All | 41 | 406 | 43.6 (41.7–45.6) | 3.2 (2.9–3.6) | 22.7 (20.4–25.4) | 39.8 (31.7–52.9) |
| M | 20 | 197 | 40.1 (37.5–42.7) | 18.5 (16.0–22.0) | 48.5 (35.5–76.1) | ||
| F | 21 | 209 | 47.1 (44.3–50.0) | 25.2 (21.8–30.0) | 29.1 (20.7–44.8) | ||
| RBC, ×106/µL | All | 41 | 410 | 4.88 (4.82–4.93) | 1.0 (1.0–1.2) | 2.2 (2.0–2.5) | 9.8 (8.1–12.7) |
| M | 20 | 200 | 5.31 (5.27–5.36) | 1.9 (1.6–2.3) | 4.4 (3.3–6.5) | ||
| F | 20 | 200 | 4.50 (4.47–4.53) | 2.3 (2.0–2.8) | 3.2 (2.4–4.9) | ||
| Hemoglobin, g/dL | All | 41 | 410 | 14.0 (13.8–14.2) | 0.8 (0.8–0.9) | 2.1 (1.9–2.4) | 9.9 (8.2–12.8)a |
| M | 20 | 198 | 15.23 (15.08–15.37) | 1.9 (1.6–2.2) | 5.6 (4.2–8.2) | ||
| F | 21 | 210 | 12.84 (12.74–12.95) | 2.4 (2.0–2.8) | 4.6 (3.4–6.7) | ||
| Hematocrit, % | All | 41 | 409 | 42.8 (42.4–44.3) | 1.0 (0.9–1.1) | 2.2 (1.9–2.5) | 8.7 (7.2–11.2)a |
| M | 20 | 200 | 45.8 (45.5–46.2) | 2.2 (1.85–2.59) | 4.4 (3.3–6.5) | ||
| F | 21 | 109 | 39.7 (39.4–40.0) | 2.3 (2.0–2.8) | 4.0 (2.9–5.8) | ||
| MCH, pg | All | 41 | 410 | 28.8 (28.6–28.9) | 1.2 (1.1–1.3) | 0.8 (0.5-.1.0) | 5.2 (4.2–6.6) |
| M | 20 | 200 | 28.6 (28.4–28.9) | 0.9 (0.7–1.2) | 5.4 (4.1–8.0) | ||
| F | 21 | 210 | 28.8 (28.6–29.1) | 0.5 (0–0.9) | 5.0 (3.8–7.3) | ||
| MCHC, g/dL | All | 41 | 410 | 32.9 (32.8–33.1) | 1.6 (1.4–1.8) | 1.4 (1.1–1.6) | 2.9 (2.3–3.7)a |
| M | 19 | 190 | 33.2 (33.0–33.3) | 1.4 (1.1–1.8) | 2.4 (1.8–3.7) | ||
| F | 21 | 210 | 32.7 (32.5–32.9) | 1.1 (0.6–1.6) | 2.6 (1.9–3.8) | ||
| MCV, fL | All | 41 | 410 | 87.6 (87.2–88.0) | 0.6 (0.5–0.6)aCochran | 0.8 (0.71–0.94) | 3.6 (2.9–4.6) |
| M | 20 | 200 | 86.8 (86.3–87.2) | 0.8 (0.6–0.9) | 3.2 (2.4–4.8) | ||
| F | 21 | 210 | 88.2 (87.7–88.8) | 0.9 (0.7–1,1) | 3.7 (2.8–5.3) | ||
| RDW-SD, fL | All | 41 | 409 | 40.1 (39,9–40.4) | 0.9 (0.8–1.0) | 1.7 (1.5–1.9) | 5.3 (4.3–6.8) |
| M | 20 | 198 | 39.3 (39.0–39.6) | 1.4 (1.2–1.8) | 4.9 (3.7–7.1) | ||
| F | 21 | 209 | 40.9 (40.6–41.3) | 1.8 (1.5–2.2) | 5.1 (3.8–7.4) | ||
| WBC, ×103/µL | All | 41 | 400 | 6.4 (6.3–6.6) | 1.7 (1.6–1.9) | 9.4 (8.5–10.6) | 16.3 (13.4–21.7) |
| M | 20 | 200 | 6.5 (6.3–6.7) | 8.2 (7.1–9.8) | 15.2 (11.3–22.8) | ||
| F | 21 | 205 | 6.4 (6.2–6.6) | 11.3 (9.8–13.4) | 17.2 (13.0–26.3) | ||
| Neutrophils, ×103/µL | All | 41 | 409 | 3.5 (3.4–3.6) | 2.1 (1.9–2.3) | 14.2 (12.8–15.9) | 21.8 (17.4–28.5) |
| M | 20 | 200 | 3.5 (3.4–3.6) | 11.78 (10.2–13.9) | 17.8 (13.0–26.9) | ||
| F | 21 | 209 | 3.57 (3.40–3.73) | 16.2 (14.0–19.1) | 25.6 (18.7–38.3) | ||
| Lymphocyte, ×103/µL | All | 41 | 405 | 2.2 (2.1–2.2) | 2.5 (2.3–2.8) | 11.1 (10.0–12.5) | 22.9 (18.5–29.9) |
| M | 18 | 180 | 2.1 (2.0–2.1) | 8.9 (7.6–10.7) | 16.2 (11.8–24.9) | ||
| F | 21 | 208 | 2.1 (2.0–2.2) | 14.1 (12.2–16.6) | 23.4 (17.2–34.8) | ||
| Monocyte, ×103/µL | All | 40 | 400 | 0.53 (0.521–0.54) | 4.8 (4.4–5.3) | 11.6 (10.3–13.1) | 16.9 (13.6–22.5) |
| M | 20 | 200 | 0.57 (0.56–0.59) | 9.9 (8.4–11.9) | 17.8 (13.2–26.8) | ||
| F | 20 | 200 | 0.48 (0.47–0.49) | 13.01 (11.13–15.55) | 10.84 (7.10–17.15) | ||
| Eosinophils, ×103/µL | All | 41 | 405 | 0,17 (0.16–0.18) | 9.9 (9.0–11.0) | 18.9 (16.9–21.7) | 66.5 (52.6–91.3) |
| M | 20 | 196 | 0.17 (0.16–0.19) | 19.2 (16.1–23.1) | 78.0 (54.1–128.4) | ||
| F | 20 | 199 | 0.15 (0.13–0.16) | 18.9 (16.3–23.3) | 50.8 (37.5–81.8) | ||
| Platelets, ×103/µL | All | 41 | 410 | 259 (254–264) | 2.0 (1.9–2.9) | 5.6 (5.0–6.3)a | 17.1 (13.9–22.0) |
| M | 20 | 200 | 235 (229–240) | 4.5 (3.8–5.4) | 14.5 (10.9–21.5) | ||
| F | 21 | 210 | 278 (270–285) | 6.3 (5.4–7.5) | 16.7 (12.6–24.6) | ||
| MPV, fL | All | 41 | 410 | 10.4 (10.4–10.5) | 1.4 (1.2–1.5) | 1.7 (1.5–2.0)a | 8.1 (6.6–10.4) |
| M | 20 | 200 | 10.6 (10.4–10.7) | 1.3 (1.0–1.7) | 9.2 (7.0–13.5) | ||
| F | 20 | 200 | 10.2 (10.1–10.3) | 2.0 (1.7–2.5) | 5.7 (4.3–8.4) | ||
| PCT, % | All | 41 | 410 | 0.27 (0.26–0.27) | 2.8 (2.6–3.1) | 5.5 (4.9–6.2)a | 14.8 (12.0–19.1) |
| M | 20 | 200 | 0.25 (0.24–0.25) | 4.5 (3.8–5.5) | 13.7 (10.3–20.3) | ||
| F | 21 | 210 | 0.28 (0.28–0.29) | 6.2 (5.3–7.5) | 13.7 (10.2–20.1) | ||
| PDW, fL | All | 41 | 410 | 12.3 (12.1–12.5) | 3.8 (3.5–4.2) | 2.9 (2.3–3.6) | 15.3 (12.5–19.7) |
| M | 20 | 200 | 12.8 (12.5–13.2) | 2.3 (0.9–3.3) | 16.9 (12.8–25.0) | ||
| F | 21 | 210 | 11.8 (11.5–12.1) | 3.4 (2.6–4.4) | 12.8 (9.7–18.7) | ||
| P-LCR, % | All | 40 | 393 | 28.8 (28.0–29.6) | 3.7 (3.4–4.10) | 4.9 (4.3–5.7)a | 25.7 (20.7–33.2) |
| M | 20 | 200 | 29.9 (28.7–31.2) | 4.41 (3.6–5.4) | 29.0 (21.8–43.5) | ||
| F | 21 | 205 | 27.6 (26.6–28.6) | 5.7 (4.8–7.1) | 21.8 (16.5–32.1) | ||
Abbreviations: F, females; M, males; BUN, blood urea nitrogen; LDL, low-density lipoprotein; HDL, high-density lipoprotein; ALT, alanine aminotransferase; AST, aspartate aminotransferase; LDH, lactate dehydrogenase; ALP, alkaline phosphatase; CK, creatine kinase; Ca, calcium; Mg, magnesium; TSH, thyroid-stimulating hormone; TT3, total triiodothyronine; FT3, free triiodothyronine; FT4, free thyroxine; PSA, prostrate-specific antigen; PTH, parathyroid hormone; RBC, red blood cell; MCH, mean corpuscular hemoglobin; MCHC, mean corpuscular hemoglobin concentration; MCV, mean corpuscular volume; RDW, red cell distribution width; WBC, white blood cell; MPV, mean platelet volume; PTC, plateletcrit; PDW, platelet distribution width; P-LCR, platelet-large cell ratio.
Significantly different from data reported in the EFLM BV database (12).
The CVG of glucose for male subjects could not be calculated after Ln transformation. In such cases, CVG can be calculated using additional transformations. However, for simplicity, the CVG of all subjects was used instead. Alternatively, the CVG of glucose provided in the EFLM database (12) can be used.
An overview of the number of individuals for whom prRIs were not calculated due to results below the LOQ, presence of outliers, significant trends, and a CVP >30% is given in Supplemental Table 3. The highest number of subjects where prRI was not calculated was for total bilirubin (n = 16), mostly due to high CVP. The highest number of subjects in whom a significant trend was detected was for alkaline phosphatase (n = 9).
The ranges of popRI and prRI based both on CVP and CVI, RIIs and II are given in Table 3. PrRIs derived from CVP are typically wider than prRIs derived from CVI, as expected, considering there are as many different CVP values as the number of subjects (Fig. 1, A–C; Supplemental Figs. 1–45). The median RIIs were below 1 for all included measurands, regardless of whether prRIs were derived based on CVI (both those calculated in our study and those identified in the EFLM BV database) or on CVP estimates (Table 3). When based on prRI derived from CVP, the highest median (IQR) RII was for glucose at 0.88 (0.75–1.26) and the lowest for free and total prostate-specific antigen at 0.18 (0.15–0.25) and 0.22 (0.14–0.33), respectively. When using CVI estimates derived from this study to calculate the prRI, the highest median RII (IQR) was for alanine aminotransferase (female) at 0.84 (0.76–0.91), whereas when derived from the EFLM BV database, the highest median RII (IQR) was for free thyroxine at 0.88 (0.83–0.92).
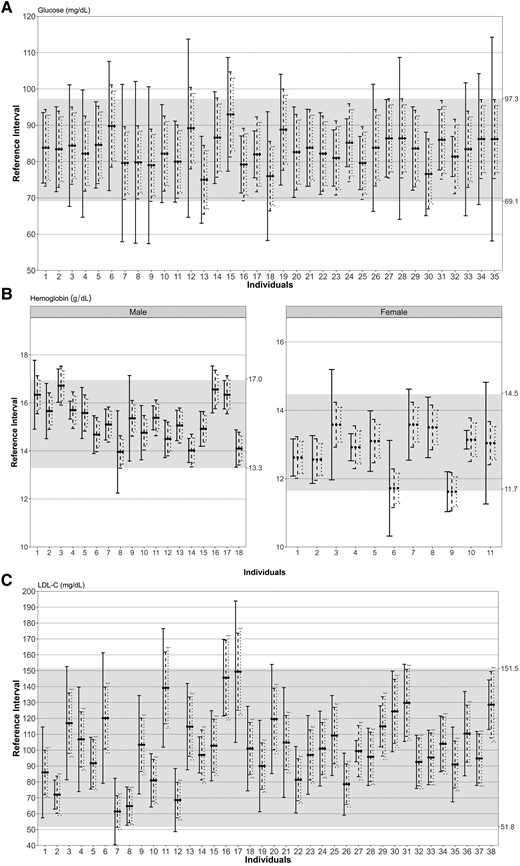
popRIs (gray area) and prRIs for glucose (A), hemoglobin (B), and low-density lipoprotein-cholesterol (C). The prRIs were calculated using within-person BV (CVP) estimates for each individual (vertical straight lines) and group-based within-subject BV (CVI) estimates obtained from the current study (vertical dashed lines) and from the EFLM Biological Variation Database (vertical dotted lines). The conversion factors for metric units to SI units are given in Supplemental Table 5.
popRI ranges and ranges and RIIb for prRIs, derived using both individual study subjects’ data (CVP) and population-based data (CVI) derived from this study (CVI) and the EFLM BV database (CVI-EFLM). Results for the range of the different prRIs and RIIs are given as median and IQRs. II are displayed both for data derived from this study and from data derived from the EFLM BV database.
| Measurands | Groupc | PopRI-range (UL-LL)a | CVp-based prRI-range (median-IQR) | CVI-based prRI-range (median-IQR) | CVI-EFLM-based prRI-range (median-IQR) | CVp-based RII (median-IQR) | CVI-based RII (median-IQR) | CVI-EFLM –based RII (median-IQR) | II-based on EFLM BV data | IId |
|---|---|---|---|---|---|---|---|---|---|---|
| Glucose, mg/dL | All | 28.2 | 24.9 (21.3–35.5) | 21.0 (20.3–21.7) | 17.9 (17.3–18.5) | 0.88 (0.75–1.26) | 0.75 (0.72–0.77) | 0.64 (0.61–0.66) | 0.62 | 1.17 |
| Hemoglobin A1c | All | 1.5 | 0.79 (0.51–0.96) | 0.64 (0.61–0.65) | 0.30 (0.29–0.31) | 0.53 (0.34–0.64) | 0.42 (0.41–0.44) | 0.20 (0.19–0.20) | 0.25 | 0.42 |
| BUN, mg/dL | All | 15.0 | 9.2 (7.4–14.0) | 8.2 (7.4–9.5) | 7.7 (7.0–9.0) | 0.61 (0.50–0.93) | 0.54 (0.49–0.63) | 0.51 (0.46–0.60) | 0.66 | 0.76 |
| Creatinine, mg/dL | M | 0.52 | 0.21 (0.16–0.31) | 0.24 (0.23–0.27) | 0.19 (0.18–0.22) | 0.41 (0.30–0.59) | 0.45 (0.43–0.52) | 0.37 (0.35–0.43) | 0.32 | 0.23 |
| F | 0.34 | 0.27 (0.18–0.31) | 0.18 (0.17–0.20) | 0.14 (0.14–0.16) | 0.79 (0.52–0.92) | 0.52 (0.50–0.59) | 0.42 (0.41–0.48) | |||
| Uric acid, mg/dL | M | 4.3 | 1.9 (1.4–2.8) | 1.9 (1.8–2.11) | 1.9 (1.8–2.1) | 0.43 (0.33–0.65) | 0.44 (0.41–0.49) | 0.45 (0.42–0.50) | 0.37 | 0.38 |
| F | 2.9 | 2.2 (1.6–2.7) | 1.4 (1.3–1.5) | 1.4 (1.3–1.6) | 0.76 (0.56–0.95) | 0.49 (0.43–0.53) | 0.49 (0.44–0.54) | |||
| Albumin, g/dL | All | 1.20 | 0.75 (0.59–1.01) | 0.74 (0.71–0.78) | 0.52 (0.50–0.55) | 0.63 (0.49–0.85) | 0.62 (0.59–0.65) | 0.44 (0.42–0.46) | 0.51 | 0.24 |
| Protein, Total, g/dL | All | 1.90 | 1.19 (1.00–1.46) | 1.11 (1.07–1.15) | 0.92 (0.89–0.95) | 0.62 (0.53–0.77) | 0.58 (0.56–0.61) | 0.48 (0.47–0.50) | 0.57 | 0.49 |
| Bilirubin, total, mg/dL | All | 1.18 | 0.61 (0.45–0.83) | 0.58 (0.40–0.71) | 0.42 (0.29–0.51) | 0.52 (0.39–0.71) | 0.49 (0.34–0.61) | 0.35 (0.25–0.43) | 0.75 | 0.69 |
| Bilirubin, direct, mg/dL | All | 0.24 | 0.13 (0.09–0.16) | 0.08 (0.06–0.09) | NA | 0.55 (0.37–0.66) | 0.32 (0.27–0.39) | NA | NA | 0.69 |
| Cholesterol, Total, mg/dL | All | 114.2 | 60.4 (44.3–73.5) | 43.3 (40.0–46.5) | 38.0 (35.1–40.8) | 0.53 (0.39–0.64) | 0.38 (0.35–0.41) | 0.33 (0.31–0.36) | 0.33 | 0.36 |
| LDL-cholesterol, mg/dL | All | 99.7 | 47.1 (34.0–56.5) | 32.8 (29.6–37.3) | 36.9 (33.3–42.0) | 0.47 (0.34–0.57) | 0.33 (0.30–0.37) | 0.37 (0.33–0.42) | 0.32 | 0.34 |
| HDL-cholesterol, mg/dL | All | 44.7 | 16.4 (12.1–22.2) | 13.5 (11.6–15.9) | 14.0 (12.1–16.5) | 0.37 (0.27–0.50) | 0.30 (0.26-.036) | 0.31 (0.27–0.37) | 0.24 | 0.18 |
| Triglyceride, mg/dL | All | 126.0 | 60.8 (42.2–94.2) | 54.5 (46.7–77.8) | 56.6 (48.4–80.7) | 0.48 (0.33–0.75) | 0.43 (0.37–0.62) | 0.45 (0.38–0.64) | 0.54 | 0.46 |
| ALT, IU/L | M | 43.6 | 17.0 (10.4–35.8) | 23.2 (18.5–26.5) | 16.2 (12.9–18.6) | 0.39 (0.24–0.82) | 0.53 (0.42–0.61) | 0.37 (0.26–0.41) | 0.34 | 0.49 |
| F | 18.2 | 13.0 (11.1–14.6) | 15.3 (13.8–16.5) | 10.8 (9.7–11.6) | 0.72 (0.61–0.80) | 0.84 (0.76–0.91) | 0.59 (0.53–0.64) | |||
| AST, IU/L | All | 18.2 | 12.6 (7.9–20.3) | 12.3 (9.6–13.3) | 8.4 (6.6–9.1) | 0.69 (0.44–1.12) | 0.67 (0.52–0.73) | 0.46 (0.36–0.50) | 0.46 | 0.49 |
| LDH, IU/L | All | 83.6 | 52.7 (37.7–68.2) | 40.1 (37.1–42.0) | 35.4 (32.8–37.1) | 0.63 (0.45–0.82) | 0.48 (0.44–0.50) | 0.42 (0.39–0.44) | 0.41 | 0.44 |
| ALP, IU/L | All | 67.5 | 17.7 (12.2–22.5) | 17.3 (14.9–20.5) | 17.6 (15.2–20.9) | 0.26 (0.18–0.33) | 0.26 (0.22–0.30) | 0.26 (0.22–0.31) | NAb | 0.21 |
| Amylase, IU/L | All | 73.4 | 22.9 (15.4–29.0) | 18.6 (15.6–23.0) | 15.6 (13.8–20.3) | 0.31 (0.21–0.40) | 0.26 (0.21–0.31) | 0.22 (0.19–0.28) | 0.22 | 0.25 |
| Lipase, IU/L | All | 185.6 | 98.7 (75.2–114.6) | 79.8 (60.7–92.4) | 57.5 (43.7–66.5) | 0.53 (0.41–0.62) | 0.43 (0.33–0.50) | 0.31 (0.24–0.36) | 0.37 | 0.44 |
| CK, IU/L | M | 239.2 | 53.1 (43.6–102.4) | 57.9 (48.4–79.0) | 57.8 (48.5–78.1) | 0.22 (0.18–0.43) | 0.25 (0.21–0.34) | 0.24 (0.20–0.33) | 0.40 | 0.32 |
| F | 92.7 | 36.0 (32.4–60.3) | 43.6 (27.5–50.5) | 43.8 (26.1–48.0) | 0.39 (0.35–0.65) | 0.37 (0.30–0.54) | 0.35 (0.28–0.52) | |||
| Calcium, mg/dL | All | 1.7 | 1.3 (1.1–2.3) | 1,2 (1.2–1.2) | 1.1 (1.1–1.1) | 0.79 (0.64–1.36) | 0.71 (0.70–0.73) | 0.65 (0.63–0.66) | 0.67 | 0.81 |
| Magnesium, mg/dL | All | 0.60 | 0.47 (0.25–0.67) | 0.36 (0.35–0.37) | 0.28 (0.27–0.29) | 0.79 (0.42–1.11) | 0.60 (0.58–0.62) | 0.47 (0.46–0.49) | 0.50 | 0.62 |
| TSH, µIU/mL | All | 3.0 | 1.5 (1.1–2.3) | 1.1 (0.9–1.6) | 1.2 (1.0–1.7) | 0.48 (0.35–0.76) | 0.40 (0.30–0.52) | 0.42 (0.32–0.56) | 0.49 | 0.44 |
| TT3, ng/dL | All | 74 | 55 (44–72) | 40 (37–43) | 61 (57–66) | 0.74 (0.60–0.98) | 0.55 (0.51–0.59) | 0.83 (0.77–0.89) | 0.77 | 0.45 |
| FT3, pg/dL | All | 127 | 96 (79–129) | 72 (68–76) | 80 (75–84) | 0.76 (0.62–1.02) | 0.57 (0.54–0.59) | 0.63 (0.59–0.66) | 0.60 | 0.58 |
| FT4, ng/dL | All | 0.44 | 0.38 (0.27–0.48) | 0.29 (0.27–0.30) | 0.38 (0.37–0.40) | 0.87 (0.61–1.08) | 0.65 (0.62–0.69) | 0.88 (0.83–0.92) | 0.63 | 0.47 |
| Insulin, µIU/mL | All | 16.9 | 10.5 (8.0–15.5) | 8.5 (7.2–12.6) | 8.8 (7.5–13.1) | 0.62 (0.48–0.91) | 0.50 (0.43–0.75) | 0.52 (0.44–0.77) | 0.76 | 0.65 |
| Testosterone, total, ng/dL | M | 594 | 241 (170–373) | 308 (257–346) | 302 (251–338) | 0.41 (0.29–0.63) | 0.52 (0.43–0.58) | 0.51 (0.42–0.57) | 0.58 | 0.24 |
| F | 36.9 | 22.2 (15.6–36.6) | 18.3 (14.9–22.7) | 16.1 (13.1–20.1) | 0.60 (0.42–0.99) | 0.50 (0.40–0.62) | 0.44 (0.36–0.54) | 0.45 | ||
| PSA, total, ng/mL | M | 1.20 | 0.27 (0.16–0.39) | 0.21 (0.17–0.24) | 0.17 (0.13–0.19) | 0.22 (0.14–0.33) | 0.17 (0.14–0.20) | 0.14 (0.11–0.16) | 0.16 | 0.20 |
| PSA, free, ng/mL | M | 0.63 | 0.11 (0.10–0.16) | 0.10 (0.08–0.11) | 0.09 (0.08–0.11) | 0.18 (0.15–0.25) | 0.16 (0.13–0.18) | 0.15 (0.12–0.17) | 0.15 | 0.17 |
| PTH, pg/mL | All | 75.7 | 48.3 (30.8–59.9) | 42.7 (34.1–49.2) | 29.5 (23.6–34.0) | 0.64 (0.41–0.79) | 0.56 (0.45–0.65) | 0.39 (0.31–0.45) | 0.67 | 0.57 |
| RBC, ×106/µL | M | 1.42 | 0.54 (0.51–0.79) | 0.56 (0.54–0.57) | 0.62 (0.60–0.63) | 0.38 (0.36–0.56) | 0.39 (0.38–0.40) | 0.44 (0.43–0.44) | 0.40 | 0.22 |
| F | 1.08 | 0.67 (0.51–0.92) | 0.46 (0.45–0.48) | 0.52 (0.50–0.53) | 0.62 (0.47–0.85) | 0.43 (0.47–0.49) | 0.48 (0.47–0.49) | |||
| Hemoglobin, g/dL | M | 3.7 | 1.6 (1.3–2.2) | 1.5 (1.4–1.5) | 1.1 (1.1–1.2) | 0.42 (0.35–0.61) | 0.40 (0.39–0.42) | 0.31 (0.30–0.32) | 0.46 | 0.22 |
| F | 2.8 | 1.8 (1.1–2.4) | 1.3 (1.2–1.3) | 1.0 (0.9–1.0) | 0.63 (0.40–0.87) | 0.45 (0.43–0.46) | 0.35 (0.33–0.35) | |||
| Hematocrit, % | M | 10.4 | 4.7 (3.8–6.6) | 4.7 (4.6–4.8) | 5.9 (5.7–6.1) | 0.45 (0.37–0.63) | 0.45 (0.44–0.46) | 0.57 (0.55–0.59) | 0.51 | 0.25 |
| F | 8.9 | 5.0 (3.5–7.6) | 4.0 (3.9–4.1) | 5.0 (5.0–5.2) | 0.56 (0.39–0.85) | 0.45 (0.44–0.46) | 0.57 (0.56–0.58) | |||
| MCH, pg | All | 6.0 | 2.5 (1.5–2.7) | 1.7 (1.7–1.8) | 1.6 (1.5–1.6) | 0.42 (0.25–0.46) | 0.29 (0.28–0.29) | 0.27 (0.26–0.27) | 0.18 | 0.14 |
| MCHC, g/dL | All | 4.2 | 3.6 (2.7–4.6) | 2.9 (2.9–3.0) | 2.1 (2.1–2.2) | 0.85 (0.63–1.09) | 0.70 (0.69–0.71) | 0.51 (0.50–0.51) | 0.71 | 0.47 |
| MCV, fL | All | 14.9 | 5.1 (3.4–6.3) | 3.8 (3.7–3.8) | 4.3 (4.2–4.4) | 0.34 (0.23–0.42) | 0.25 (0.25–0.26) | 0.29 (0.28–0.30) | 0.22 | 0.23 |
| RDW-SD, fL | All | 9.6 | 3.9 (3.1–5.0) | 3.3 (3.2–3.4) | 3.0 (3.0–3.1) | 0.41 (0.32–0.52) | 0.34 (0.33–0.35) | 0.32 (0.31–0.33) | 0.40 | 0.32 |
| WBC, ×103/µL | All | 5.94 | 3.5 (2.2–5.0) | 2.6 (2.3–2.7) | 3.0 (2.6–3.1) | 0.59 (0.37–0.85) | 0.44 (0.39–0.46) | 0.50 (0.45–0.52) | 0.66 | 0.58 |
| Neutrophil, ×103/µL | All | 4.01 | 2.5 (2.1–3.7) | 2.2 (1.9–2.4) | 2.2 (1.9–2.5) | 0.63 (0.51–0.93) | 0.55 (0.47–0.61) | 0.55 (0.48–0.62) | 0.59 | 0.65 |
| Lymphocyte, ×103/µL | All | 2.41 | 1.1 (0.8–1.6) | 1.0 (0.9–1.1) | 1.0 (0.9–1.1) | 0.46 (0.34–0.67) | 0.41 (0.37–0.46) | 0.42 (0.38–0.47) | 0.48 | 0.86 |
| Monocyte, ×103/µL | All | 0.58 | 0.3 (0.2–0.5) | 0.3 (0.2–0.3) | 0.3 (0.3–0.4) | 0.58 (0.40–0.78) | 0.47 (0.43–0.53) | 0.56 (0.51–0.63) | 0.60 | 0.68 |
| Eosinophil, ×103/µL | All | 0.44 | 0.17 (0.11–0.22) | 0.14 (0.07–0.19) | 0.10 (0.05–0.14) | 0.38 (0.25–0.51) | 0.31 (0.16–0.43) | 0.23 (0.13–0.32) | 0.23 | 0.28 |
| Platelets, ×103/µL | All | 205.3 | 79.0 (58.6–11.5) | 64.3 (59.7–74.9) | 87.7 (81.4–102.2) | 0.38 (0.29–0.54) | 0.31 (0.29–0.36) | 0.43 (0.40–0.50) | 0.41 | 0.33 |
| MPV, fL | All | 3.6 | 1.2 (1.0–1.4) | 1.0 (0.9–1.0) | 1.2 (1.1–1.2) | 0.32 (0.27–0.39) | 0.27 (0.25–0.28) | 0.32 (0.30–0.34) | 0.32 | 0.21 |
| PCT, % | All | 0.20 | 0.07 (0.05–0.11) | 0.07 (0.06–0.08) | 0.08 (0.07–0.09) | 0.35 (0.25–0.55) | 0.35 (0.31–0.39) | 0.41 (0.35–0.45) | 0.47 | 0.37 |
| PDW, fL | All | 7.2 | 2.8 (2.2–4.2) | 2.5 (2.3–2.8) | 2.28 (2.11–2.59) | 0.40 (0.31–0.59) | 0.34 (0.32–0.39) | 0.32 (0.29–0.36) | 0.31 | 0.19 |
| P-LCR, % | All | 30.3 | 9.3 (6.7–13.5) | 7.3 (6.2–8.8) | 9.5 (8.0–11.4) | 0.31 (0.22–0.45) | 0.24 (0.21–0.29) | 0.31 (0.27–0.38) | 0.33 | 0.19 |
Abbreviations: IQR, interquartile range; F, females; M, males; BUN, blood urea nitrogen; LDL, low-density lipoprotein; HDL, high-density lipoprotein; ALT, alanine aminotransferase; AST, aspartate aminotransferase; LDH, lactate dehydrogenase; ALP, alkaline phosphatase; CK, creatine kinase; TSH, thyroid-stimulating hormone; TT3, total triiodothyronine; FT3, free triiodothyronine; FT4, free thyroxine; PSA, prostrate-specific antigen; PTH, parathyroid hormone; RBC, red blood cell; MCH, mean corpuscular hemoglobin; MCHC, mean corpuscular hemoglobin concentration; MCV, mean corpuscular volume; RDW, red cell distribution width; WBC, white blood cell; MPV, mean platelet volume; PTC, plateletcrit; PDW, platelet distribution width; P-LCR, platelet-large cell ratio.
See Table 1.
RIIs based on CVP, CVI, and CVI-EFLM and calculated as where RII is the reference interval index defined as the ratio of the range of prRI [upper limit (UL) – lower limit (LL)] to the range of popRI.
PopRI reported separately for males and females when relevant.
II based on the CVI and CVG obtained from the present study.
The number of individuals in whom the range of prRI was larger than the range of popRI (RII > 1) is summarized in Table 4 for all measurands. The highest number was observed for glucose (15/35; 42.8%), calcium (14/36; 38.9%), and mean corpuscular hemoglobin concentration (13/35; 37.1%), respectively, when based on CVP. In Fig. 2, the number of measurands with a prRIs wider (RII > 1) (light columns) and narrower (RII < 1) (dark columns) than the corresponding popRIs is displayed for each study participant. When summarizing results for the RII for all individuals and all measurands, it was below 1 in 87.5% of cases.
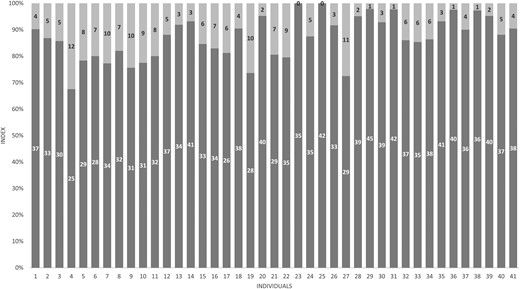
The number of measurands where the range of the prRIs, calculated based on within-person estimates (CVP) was wider (light columns) and narrower (dark columns) than the corresponding population-based reference intervals.
The number of participants (n) for whom a prRI was calculated and the number of participants with a prRI wider than the corresponding population-based reference interval (RII > 1). PrRI were calculated based on within-person estimates (CVP) and within-subject estimates derived from this study (CVI) and from the EFLM BV database (CVI-EFLM).
| Measurands | prRi calculated based on | Number of participants with prRI (n) | Number of participants with RII >1 (n) | Percentage of participants with RII >1 (%) |
|---|---|---|---|---|
| Glucose | CVP | 35 | 15 | 42.8 |
| CVI | 35 | 0 | 0 | |
| CVI-EFLM | 35 | 0 | 0 | |
| Hemoglobin A1c | CVP | 39 | 1 | 2.6 |
| CVI | 39 | 0 | 0 | |
| CVI-EFLM | 39 | 0 | 0 | |
| BUN | CVP | 34 | 7 | 20.6 |
| CVI | 36 | 0 | 0 | |
| CVI-EFLM | 36 | 0 | 0 | |
| Creatinine | CVP | 36 | 4 | 11.1 |
| CVI | 36 | 0 | 0 | |
| CVI-EFLM | 36 | 0 | 0 | |
| Uric acid | CVP | 36 | 3 | 8.3 |
| CVI | 36 | 0 | 0 | |
| CVI-EFLM | 36 | 0 | 0 | |
| Albumin | CVP | 35 | 5 | 14.3 |
| CVI | 35 | 0 | 0 | |
| CVI-EFLM | 35 | 0 | 0 | |
| Protein, total | CVP | 33 | 4 | 12.1 |
| CVI | 33 | 0 | 0 | |
| CVI-EFLM | 33 | 0 | 0 | |
| Total bilirubin | CVP | 25 | 2 | 8 |
| CVI | 38 | 4 | 10.5 | |
| CVI-EFLM | 38 | 1 | 2.6 | |
| Direct bilirubin | CVP | 32 | 0 | 0 |
| CVI | 35 | 0 | 0 | |
| CVI-EFLM | 35 | NA | NA | |
| Cholesterol, total | CVP | 37 | 1 | 2.7 |
| CVI | 37 | 0 | 0 | |
| CVI-EFLM | 37 | 0 | 0 | |
| LDL-cholesterol | CVP | 38 | 0 | 0 |
| CVI | 38 | 0 | 0 | |
| CVI-EFLM | 38 | 0 | 0 | |
| HDL-cholesterol | CVP | 36 | 0 | 0 |
| CVI | 36 | 0 | 0 | |
| CVI-EFLM | 36 | 0 | 0 | |
| Triglyceride | CVP | 32 | 1 | 3.1 |
| CVI | 38 | 2 | 5.3 | |
| CVI-EFLM | 38 | 2 | 5.3 | |
| ALT | CVP | 28 | 5 | 17.9 |
| CVI | 30 | 3 | 10.0 | |
| CVI-EFLM | 30 | 0 | 0 | |
| AST | CVP | 35 | 12 | 34.3 |
| CVI | 35 | 1 | 2.8 | |
| CVI-EFLM | 35 | 0 | 0 | |
| LDH | CVP | 31 | 2 | 6.5 |
| CVI | 32 | 0 | 0 | |
| CVI-EFLM | 32 | 0 | 0 | |
| ALP | CVP | 29 | 0 | 0 |
| CVI | 29 | 0 | 0 | |
| CVI-EFLM | 29 | 0 | 0 | |
| Amylase | CVP | 34 | 1 | 2.9 |
| CVI | 35 | 0 | 0 | |
| CVI-EFLM | 35 | 0 | 0 | |
| Lipase | CVP | 36 | 2 | 5.6 |
| CVI | 37 | 0 | 0 | |
| CVI-EFLM | 37 | 0 | 0 | |
| CK | CVP | 30 | 4 | 13.3 |
| CVI | 33 | 0 | 0 | |
| CVI-EFLM | 33 | 0 | 0 | |
| Calcium | CVP | 36 | 14 | 38.9 |
| CVI | 36 | 0 | 0 | |
| CVI-EFLM | 36 | 0 | 0 | |
| Magnesium | CVP | 38 | 11 | 28.9 |
| CVI | 38 | 0 | 0 | |
| CVI-EFLM | 38 | 0 | 0 | |
| TSH | CVP | 30 | 3 | 10.0 |
| CVI | 34 | 0 | 0 | |
| CVI-EFLM | 34 | 0 | 0 | |
| TT3 | CVP | 33 | 8 | 24.2 |
| CVI | 33 | 0 | 0 | |
| CVI-EFLM | 33 | 3 | 9.1 | |
| FT3 | CVP | 34 | 9 | 26.5 |
| CVI | 34 | 0 | 0 | |
| CVI-EFLM | 34 | 0 | 0 | |
| FT4 | CVP | 36 | 12 | 33.3 |
| CVI | 36 | 0 | 0 | |
| CVI-EFLM | 36 | 1 | 2.8 | |
| Insulin | CVP | 30 | 6 | 20.0 |
| CVI | 33 | 2 | 6.1 | |
| CVI-EFLM | 33 | 3 | 9.1 | |
| Testosterone, total | CVP | 36 | 7 | 19.4 |
| CVI | 36 | 0 | 0 | |
| CVI-EFLM | 36 | 0 | 0 | |
| PSA, total | CVP | 18 | 0 | 0 |
| CVI | 18 | 0 | 0 | |
| CVI-EFLM | 18 | 0 | 0 | |
| PSA, free | CVP | 15 | 0 | 0 |
| CVI | 15 | 0 | 0 | |
| CVI-EFLM | 15 | 0 | 0 | |
| PTH | CVP | 29 | 5 | 17.2 |
| CVI | 37 | 0 | 0 | |
| CVI-EFLM | 37 | 0 | 0 | |
| RBC | CVP | 33 | 2 | 6.1 |
| CVI | 33 | 0 | 0 | |
| CVI-EFLM | 33 | 0 | 0 | |
| Hemoglobin | CVP | 29 | 2 | 6.9 |
| CVI | 29 | 0 | 0 | |
| CVI-EFLM | 29 | 0 | 0 | |
| Hematocrit | CVP | 34 | 2 | 5.9 |
| CVI | 34 | 0 | 0 | |
| CVI-EFLM | 34 | 0 | 0 | |
| MCH | CVP | 36 | 0 | 0 |
| CVI | 36 | 0 | 0 | |
| CVI-EFLM | 36 | 0 | 0 | |
| MCHC | CVP | 35 | 13 | 37.1 |
| CVI | 35 | 0 | 0 | |
| CVI-EFLM | 35 | 0 | 0 | |
| MCV | CVP | 37 | 0 | 0 |
| CVI | 37 | 0 | 0 | |
| CVI-EFLM | 37 | 0 | 0 | |
| RDW-SD | CVP | 34 | 0 | 0 |
| CVI | 34 | 0 | 0 | |
| CVI-EFLM | 34 | 0 | 0 | |
| WBC | CVP | 35 | 5 | 14.3 |
| CVI | 35 | 0 | 0 | |
| CVI-EFLM | 35 | 0 | 0 | |
| Neutrophil | CVP | 39 | 9 | 23.1 |
| CVI | 39 | 0 | 0 | |
| CVI-EFLM | 39 | 0 | 0 | |
| Lymphocyte | CVP | 36 | 4 | 11.1 |
| CVI | 37 | 0 | 0 | |
| CVI-EFLM | 37 | 0 | 0 | |
| Monocyte | CVP | 38 | 2 | 5.3 |
| CVI | 38 | 0 | 0 | |
| CVI-EFLM | 38 | 0 | 0 | |
| Eosinophil | CVP | 29 | 2 | 6.9 |
| CVI | 35 | 1 | 2.8 | |
| CVI-EFLM | 35 | 0 | 0 | |
| Platelets | CVP | 38 | 2 | 5.3 |
| CVI | 38 | 0 | 0 | |
| CVI-EFLM | 38 | 0 | 0 | |
| MPV | CVP | 34 | 0 | 0 |
| CVI | 34 | 0 | 0 | |
| CVI-EFLM | 34 | 0 | 0 | |
| PCT | CVP | 33 | 1 | 3.0 |
| CVI | 33 | 0 | 0 | |
| CVI-EFLM | 33 | 0 | 0 | |
| PDW | CVP | 36 | 1 | 2.8 |
| CVI | 36 | 0 | 0 | |
| CVI-EFLM | 36 | 0 | 0 | |
| P-LCR | CVP | 36 | 0 | 0 |
| CVI | 36 | 0 | 0 | |
| CVI-EFLM | 36 | 0 | 0 |
Abbreviations: BUN, blood urea nitrogen; LDL, low-density lipoprotein; HDL, high-density lipoprotein; ALT, alanine aminotransferase; AST, aspartate aminotransferase; LDH, lactate dehydrogenase; ALP, alkaline phosphatase; CK, creatine kinase; TSH, thyroid-stimulating hormone; TT3, total triiodothyronine; FT3, free triiodothyronine; FT4, free thyroxine; PSA, prostrate-specific antigen; PTH, parathyroid hormone; RBC, red blood cell; MCH, mean corpuscular hemoglobin; MCHC, mean corpuscular hemoglobin concentration; MCV, mean corpuscular volume; RDW, red cell distribution width; WBC, white blood cell; MPV, mean platelet volume; PTC, plateletcrit; PDW, platelet distribution width; P-LCR, platelet-large cell ratio.
Except for glucose (II = 1.17), the II were lower than 1.0 for all included measurands (Table 3). The II of 8 measurands were between 0.6 and 1.0, with the remainder below 0.6.
The NHSPs within 5%, 10%, and 15% deviation based on the CVI and CVP derived from the present study are given in Supplemental Table 4. The CVI–derived NHSPs were 1 for all erythrocyte-related tests, which means that the result of one sample can predict the HSP within 5%. For total bilirubin, the NHSPs within 5%, 10%, and 15% deviations based on CVI estimates were 122, 31, and 14, respectively; i.e., 14 measurements are required to predict the HSP within 15%. For all measurands, the median NHSPCVP were similar or higher than the NHSPCVI.
Discussion
For the past 60 years, numerous papers reporting popRIs for different measurands have been published (15). However, using popRIs to interpret test results for an individual comes with a number of limitations (3). In our previous work, we developed a model delivering personalized RI (5). In this study, we calculated popRIs (Table 1) and prRIs for 48 commonly requested clinical chemistry and hematology measurands, based on prospectively collected samples from the same study population. Using results from duplicate analysis of 5 samples collected weekly from the 41 individuals included in study group 2, we estimated CVI, CVG, and CVA (Table 2) as well as the study subjects’ individual CVP. prRIs were thereafter calculated utilizing (a) the individual CVP, (b) the CVI estimates derived in our study (Table 2), and (c) meta-analysis derived CVI estimates obtained from the EFLM BV database (12). For most measurands, the individual prRI ranges were narrower than the popRI range, with median RII < 1.0 for all measurands (Tables 3 and 4). For some measurands, notably triglyceride, bilirubin, and insulin, some prRIs crossed upper and lower popRI limits, regardless of how they were calculated (Table 4). Basing prRI on CVP was more often the cause of a wider prRI than if based on CVI; for the latter all but 2 participants had a prRI > popRI for at least one measurand. Overall, about half the participants had a CVP-based prRI > popRI for at least 5 of 48 measurands (Fig. 2). This reflects how the CVI is an average estimate of the BV in a population, whereas the CVP enumerates the BV for one specific individual. This was particularly striking for glucose. When based on CVP, the RIIs of 15 of 35 subjects were >1, but if based on CVI, the RIIs were below 1 for all (Fig. 1A, Table 4). Though data were assessed for trends and outliers and participants reported on their clinical status, there may, for some measurands, be differences in metabolic regulation that influence the CVP in some individuals and the resulting prRI.
For most measurands where the median RII was around or above 0.80, such as glucose, calcium, magnesium, free thyroxine, and mean corpuscular hemoglobin concentration (Table 3), approximately one-third of the study participants had a prRI range wider than the popRI range. Thus, for these measurands, a high number of individuals would have their results flagged as outside the popRI when these results were within their own prRI. For measurands where the median RII was around 0.50 or lower, such as for prostate-specific antigen (total and free), alkaline phosphatase, and mean platelet volume, most study subjects’ prRIs were narrow compared to the popRI, indicating that clinically significant changes may be missed when using popRI for assessing results. Additionally, it is of importance that even when the RII was below 1.0 for all study participants, this does not mean that all prRIs fell within the limits of the popRIs. This is illustrated in Fig. 1C for low-density lipoprotein-cholesterol, where all subjects had a prRI range smaller than the popRI range (Table 4), but some individual prRIs crossed the upper or lower popRI limits. The variation in the HSP between different individuals is expressed by the CVG. Thus, the higher CVG, the larger the variation in prRI that can be expected.
The utility of popRI for monitoring has traditionally been evaluated by the II, and the use of popRI is not recommended for monitoring test results if II is lower than 0.6 (16). This was the case for most measurands included in our study (Table 3), underlining the need for another approach. Note that II is the ratio of the CVI to the CVG, and it is not directly related to popRIs. Theoretically, the median RII might be a better indicator for the evaluation of the utility of popRI than the II. Assessment of a patient is usually based on results from a single sample. Knowledge of the power of a single measurement result to estimate the HSP, within a certain deviation, is therefore of importance. Theoretically, using the individual's CVP will estimate the NHSP for a specific individual more precisely. Our results indicate that a higher number of samplings may be necessary to estimate the HSP of an individual within a certain deviation (Supplemental Table 4) than that indicated by the NHSP based on CVI data. We calculated the NHSPs based on CVP by t statistics because of the limited number of repeated measurement results available in our study. A higher number of repeated measurements would give a more accurate CVP and consequently a more accurate NHSP estimation.
For a number of subjects, prRIs could not be calculated for all measurands because of the identification of significant trends, outliers, or a CVP >30% (Supplemental Table 3). The most affected measurands were total bilirubin, alanine aminotransferase, and eosinophils, where prRIs could not be calculated for approximately one-third of the participants (Supplemental Table 3). All subjects reported being in good health during the study, and no clinical reason for the significant trends or outliers could be identified. However, subclinical diseases cannot be ruled out. In our previous prRI study, we extracted test results from the laboratory information system representing retrospective data collected 2 to 15 years prior to inclusion (5). In this study, on the other hand, we collected samples weekly. Using samples collected over a longer time period, a more relevant clinical scenario for many of the measurands included in our study could give raise to different CVP. Furthermore, both the CVP and the HSP can be influenced by age, life transitions, and seasonal and other long-term variations. These factors must all be taken into account when using already collected test results to derive prRIs. Further work is required to investigate the frequency of trends and-outliers when monitoring patients with different sampling intervals and over longer time periods to inform on the robustness of the CVP estimates and resulting prRI. The use of individualized, rather than population-based, decision limits, such as for hemoglobin A1c, should also be investigated further.
To calculate the prRI based on CVP, at least 5 previous measurement results from a steady-state situation must be available (3, 6). We calculated TVset based on t distribution, instead of the normal distribution, considering the relatively low number of samples collected for each study participant. Two main factors are critical in the uncertainty of TVset: t table value (Tα) and the number of measurement results (n) (Eq. 1 and Eq. 2). For 95% probability, the normal distribution cofactor (z value) is 1.96, whereas for the t distribution, it depends on n – 1 degrees of freedom. For example, Tα for 5 measurement results is 2.776, and for 10 it is 2.262. Therefore, increasing the number of repeated measurements reduces the uncertainty and may lead to a narrower prRI. However, in clinical practice, a higher number of previous measurements from steady state will typically not be available, and even the requirement of 5 previous test results will be a practical limitation for many patients and clinical settings. Previously we have shown that 3 previous measurement results derived from a steady-state situation are sufficient to estimate the prRI when based on CVI (5). Estimates of CVI are, for most measurands, available in the EFLM BV database. However, although using CVI is practically more easy, it represents an average estimate derived from a specific population and is not necessarily appropriate for all individuals, as illustrated by our and other studies (17). Generally, there is a lack of robust CVI data, in particular for different age and population subgroups, which is a limitation when using CVI estimates for prRI calculation and other BV applications. In principle, if sufficient data are available from a steady-state situation, the CVP provides the best-fitted prRI. As a second best option, CVI established from a sex-, age-, and ethnicity-matched population can be used and, third, global meta-analysis derived CVI estimates from the EFLM BV database. Further studies are required to investigate the benefit of using prRI, based on individual or group-based BV data in clinical practice for monitoring actual patients.
Conclusion
In our study, we compared popRI and prRI for 48 commonly requested clinical chemistry and hematology measurands based on samples derived from the same study population. As expected, we show that individual prRIs vary significantly between different individuals and that the individual prRIs relatively often cross the popRI limits. Our results highlight how popRIs may be unfit for interpreting test results of an individual for many commonly requested measurands. The CVP is, though associated with a higher uncertainty, the most representative BV estimate for the individual. Thus, if data from a steady-state situation are available, deriving prRIs from CVP will provide the best fitted RI for an individual. Further work is required to elucidate if using prRIs may lead to better patient outcomes.
Supplemental Material
Supplemental material is available at Clinical Chemistry online.
Nonstandard Abbreviations
popRI, population-based reference interval; BV, biological variation; RI, reference interval; prRI, personalized reference interval; HSP, homeostatic set point; CV, coefficient of variation; SDI/CVI, within-subject biological variation (variation within a single individual estimated as a pooled variation from a [homogenous] group of individuals), expressed as SD or CV; SDP/CVP, within-person biological variation (variation derived from an individual's own data), expressed as SD or CV; LOQ, limit of quantitation; EFLM, European Federation of Clinical Chemistry and Laboratory Medicine; SDA/CVA, analytical variation (analytical examination variation); SDG/CVG, between-subject biological variation (variation between the homeostatic set points of a group of individuals); TVset(), total variation around homeostatic set point ([I] within-subject, [P] within-person, [G] between-subject); NHSP, number of samples required to estimate the homeostatic set point; D, allowed percentage deviation from the true homeostatic set point; RII, reference interval index; II, index of individuality.
Author Contributions
The corresponding author takes full responsibility that all authors on this publication have met the following required criteria of eligibility for authorship: (a) significant contributions to the conception and design, acquisition of data, or analysis and interpretation of data; (b) drafting or revising the article for intellectual content; (c) final approval of the published article; and (d) agreement to be accountable for all aspects of the article thus ensuring that questions related to the accuracy or integrity of any part of the article are appropriately investigated and resolved. Nobody who qualifies for authorship has been omitted from the list.
Authors’ Disclosures or Potential Conflicts of Interest
Upon manuscript submission, all authors completed the author disclosure form. Disclosures and/or potential conflicts of interest:
Employment or Leadership
A.K. Aarsand, Chair of European Federation of Clinical Chemistry and Laboratory Medicine Task Group on the Biological Variation Database, Associate Editor for Clinical Chemistry, AACC. A. Coşkun, Chair of European Federation of Clinical Chemistry and Laboratory Medicine Task Group on Practical Guide to Implement Measurement Uncertainty in Laboratory Medicine.
Consultant or Advisory Role
None declared.
Stock Ownership
None declared.
Honoraria
None declared.
Research Funding
Siemens Healthineers Turkey, provision of chemistry and hormone measurands reagents included in the study.
Expert Testimony
None declared.
Patents
C. Cavusoglu, M. Serteser, A.K. Aarsand, A. Coşkun, S. Sandberg, I. Unsal, M. Kilercik, patent number: TR 2020 16430 B, A method to determine the personalized reference interval for medical laboratory tests.
Role of Sponsor
The funding organization played no role in the design of study, choice of enrolled patients, review and interpretation of data, preparation of manuscript, or final approval of manuscript.
