


Abstract
(S)-N-(1-amino-3,3-dimethyl-1-oxobutan-2-yl)-1-butyl-1H-indazole-3carboxamide (ADB-BUTINACA) is an emerging synthetic cannabinoid that was first identified in Europe in 2019 and entered Singapore's drug scene in January 2020. Due to the unavailable toxicological and metabolic data, there is a need to establish urinary metabolite biomarkers for detection of ADB-BUTINACA consumption and elucidate its biotransformation pathways for rationalizing its toxicological implications.
We characterized the metabolites of ADB-BUTINACA in human liver microsomes using liquid chromatography Orbitrap mass spectrometry analysis. Enzyme-specific inhibitors and recombinant enzymes were adopted for the reaction phenotyping of ADB-BUTINACA. We further used recombinant enzymes to generate a pool of key metabolites in situ and determined their metabolic stability. By coupling in vitro metabolism and authentic urine analyses, a panel of urinary metabolite biomarkers of ADB-BUTINACA was curated.
Fifteen metabolites of ADB-BUTINACA were identified with key biotransformations being hydroxylation, N-debutylation, dihydrodiol formation, and oxidative deamination. Reaction phenotyping established that ADB-BUTINACA was rapidly eliminated via CYP2C19-, CYP3A4-, and CYP3A5-mediated metabolism. Three major monohydroxylated metabolites (M6, M12, and M14) were generated in situ, which demonstrated greater metabolic stability compared to ADB-BUTINACA. Coupling metabolite profiling with urinary analysis, we identified four urinary biomarker metabolites of ADB-BUTINACA: 3 hydroxylated metabolites (M6, M11, and M14) and 1 oxidative deaminated metabolite (M15).
Our data support a panel of four urinary metabolite biomarkers for diagnosing the consumption of ADB-BUTINACA.
Introduction
Since the first detection of synthetic cannabinoids (SCs) in commercial products such as Spice in 2008, more than 208 new SCs have appeared in the drug market (1). Designed to mimic (−)-trans-Δ9-tetrahydrocannabinol (Δ9-THC) found in cannabis, SCs exert their psychoactive effects by binding to cannabinoid receptor 1 and thereby inducing euphoria (2, 3). To mitigate abuse, several countries have scheduled SCs as illicit drugs (4). Most SCs are extensively metabolized by cytochrome P450 enzymes (CYP450), carboxylesterases (CES), and UDP-glucuronosyltransferases (UGT), resulting in the parent SC being virtually undetectable in urine (5–7). Consequently, there is a need to identify the metabolites of SCs as optimal urinary biomarkers for their forensic management.
(S)-N-(1-amino-3,3-dimethyl-1-oxobutan-2-yl)-1-butyl-1H-indazole-3-carboxamide (ADB-BUTINACA) (Supplemental Fig. 1, A) is a new SC that has been increasingly detected in the illicit market (1, 8). Since 2020, ADB-BUTINACA has been listed in various legislative acts of controlled substances worldwide, including Singapore (9–11). There are currently 3 commercially available reference metabolites of ADB-BUTINACA: the N-4 hydroxybutyl metabolite, N-butanoic acid metabolite, and oxidative deaminated metabolite (Supplemental Fig. 1, B–D). These 3 metabolites were predicted according to the published metabolism of the structurally similar N-(1-amino-3,3-dimethyl-1-oxobutan-2-yl)-1-pentylindazole-3-carboxamide (ADB-PINACA) (12). Based on in-house observation, these metabolites were absent or detected at low concentrations in authentic urine samples of ADB-BUTINACA abusers. Hence, it is important to comprehensively elucidate the metabolism of ADB-BUTINACA to establish its urinary biomarkers and understand its toxicological implications.
An ideal scenario is to confirm the observed metabolites of SCs in human urine using commercially available reference metabolites. However, this is often impossible for novel SC where such reference metabolites are typically unavailable. In the context of ADB-BUTINACA, one viable alternative is to generate a pool of key metabolites in situ for determining their metabolic properties. Here we aimed to investigate the hepatic metabolism of ADB-BUTINACA systematically and establish its (1) major Phase I metabolites, (2) hepatic clearance, (3) key metabolic pathways and enzymes, (4) metabolic stability of key metabolites, and (5) optimal urinary biomarkers.
Materials and Methods
Chemicals and Reagents
ADB-BUTINACA, its N-4 hydroxybutyl, N-butanoic acid, oxidative deaminated metabolites and internal standard (IS) D5-AM2201 N-(4-hydroxypentyl) metabolite [(1-(5-fluoro-4-hydroxypentyl)-1H-indol-3-yl-2,4,5,6,7-d5)(naphthalene-1-yl)methanone] were kindly provided by the Health Sciences Authority, Singapore. UltraPool human liver microsomes (HLM), Supersomes human CYP450 and CES recombinant enzymes (CYP1A2, CYP2C8, CYP2C9, CYP2C19, CYP2D6, CYP3A4, CYP3A5, CES1b, and CES2), Gentest NADPH Regenerating System, and Gentest UGT Reaction Mix were purchased from Corning. CYP450-specific chemical inhibitors [α-naphthoflavone (CYP1A2), quercetin (CYP2C8), sulfaphenazole (CYP2C9), S-(+)-N-3-benzyl-nirvanol (CYP2C19), ticlopidine (CYP2C19 and CYP2D6), quinidine (CYP2D6), ketoconazole (CYP3A4 and CYP3A5)] were purchased from Sigma-Aldrich. High-performance chromatography-grade acetonitrile (ACN) was obtained from Merck. All other commercially available chemicals were of analytical grade.
Phase I Metabolite Profiling
ADB-BUTINACA was incubated in a mixture containing 86 μL of 100 mM potassium phosphate buffer (pH 7.4), 5 μL of HLM, 5 μL of NADPH solution A, and 1 μL of solution B to a total incubation volume of 100 μL and final substrate concentration at 10 μM (Supplemental Table 1). Another experiment was similarly performed replacing NADPH solutions with buffer to examine the production of metabolites via non-CYP450 pathway. For each experiment, the mixture was prewarmed at 37 °C and mixed at 120 rpm for 5 min in a shaking incubator. The reaction was initiated with the addition of the substrate. At 0, 1, and 2 h, 80 μL of the reaction mixture was transferred to an equal volume of ice-cold ACN. The quenched samples were centrifuged at 2775 g, 4 °C for 30 min and the supernatant was subjected to liquid chromatography Orbitrap mass spectrometry analysis (Supplemental Methods 1.1). The metabolites were putatively identified based on mass accuracy (<5 ppm), fragmentation pattern, minimum chromatographic peak intensity at 0.1% of the metabolite with the most intense signal, and comparison against negative control. An inclusion list was added to prioritize the fragmentations of expected metabolites based on the reported metabolites of ADB-PINACA excluding any potential Phase II metabolites (Supplemental Table 2).
Determination of Hepatic Clearance
The incubation experiments involving HLM and ADB-BUTINACA (0.5 μM final concentration) in the presence/absence of NADPH were performed in triplicate as previously described (Supplemental Table 1) (13). At stipulated time points, the reaction was terminated by transferring 80 μL of the reaction mixture to an equal volume of ice-cold ACN containing 0.25 μM of IS. The samples were centrifuged at 2775 g, 4 °C for 30 min, and the supernatant was analyzed by LC-MS/MS (Supplemental Methods). Multiple reaction monitoring was used to quantify ADB-BUTINACA. The compound-specific parameters are presented in Supplemental Table 3.
Reaction Phenotyping
The incubation experiments involving HLM and ADB-BUTINACA (0.5 μM final concentration) in the presence/absence of CYP450-specific chemical inhibitors were performed in triplicate as previously described (Supplemental Table 1) (13). The inhibitors were used at a concentration of at least 10-fold higher than their reported inhibition constant (Ki) values (15–18), and each of them was dissolved in substrate solution to initiate the reaction, apart from ticlopidine, which required a preincubation of 30 min at 37 °C with HLM. The respective biotransformation pathways were further determined by utilizing recombinant enzymes (CYP450 and CES) in incubation mixture as previously described (Supplemental Table 1) (13). Samples were processed at stipulated time points as described in the previous discussion.
Metabolic Stability of Key Metabolites
Based on reaction phenotyping results, CYP2C19 was selected to generate a pool of key metabolite M14 while CYP3A5 was selected to generate M6 and M12. The reaction mixture containing 728 μL of 100 mM buffer, 40 μL of NADPH solution A, 8 μL of NADPH solution B, 16 μL of recombinant CYP2C19 or CYP3A5 (20 pmol/mL final concentration), and 8 μL of ADB-BUTINACA (1 μM final concentration) were prepared in a total incubation volume of 800 μL. Samples were quenched with an equal volume of ice-cold ACN containing 0.25 μM of IS after 30 and 90 min incubation for CYP2C19 and CYP3A5, respectively, and centrifuged at 18 000 g, 4 °C for 15 min. Supernatant was then evaporated to dryness under nitrogen. Each residue was reconstituted with buffer containing HLM (0.5 mg/mL final concentration) with addition of NADPH or UGT cofactors to determine the Phase I or II metabolic stability, respectively (Supplemental Table 1). Eq. 1 was applied to calculate the in vitro t1/2 of the metabolites.
Authentic Urine Analysis
Anonymous authentic urine specimens from seven drug abusers were analyzed using liquid chromatography Orbitrap mass spectrometry. Since the study was performed retrospectively on previously acquired data obtained from the routine toxicology analysis of anonymized human subjects without involvement of prospective recruitment of human participants, neither informed consent nor ethical approval was required for the study. The sample preparation method was as described in the Supplemental Methods. Data were acquired using the full scan/data-dependent MS/MS, analyzed retrospectively, and processed using XCalibur software based on the identification criteria of mass error less than ± 5 ppm from the theoretical mass for both full mass spectrometry and MS/MS peaks and matching of MS/MS spectra of putative metabolites (Table 1).
Metabolite ID, biotransformation, accurate mass molecular ion, mass error, elemental composition, nominal mass of diagnostic product ions, retention time, peak area at 1 h and 2 h, and percentage of metabolite peak area after 2 h incubation in human liver microsomes.
| ID | Biotransformation | [M + H]+ (m/z) | Mass error (ppm) | Elemental composition | Nominal mass of diagnostic product ions (Da) | Retention time (min) | Peak area at 1 h | Peak area at 2 h | Percentage of metabolite peak area at 2 h (%) |
|---|---|---|---|---|---|---|---|---|---|
| Parenta | ADB-BUTINACA | 331.2126 | −0.764 | C18H26N4O2 | 145, 163, 201, 219, 286, 314 | 6.92 | 3.15 × 10⁷ | ||
| M1 | Dihydroxylation (N-butyl chain + tert-butyl chain) | 363.2019 | −2.15 | C18H26N4O4 | 145, 163, 217, 235, 288, 346 | 4.4 | 3.77 × 10⁷ | 6.29 × 10⁷ | 4.6 |
| M2 | Dihydrodiol formation (Indazole ring) | 365.2184 | 0.186 | C18H28N4O4 | 179, 235, 253, 320, 348 | 4.58 | 1.18 × 10⁷ | 1.16 × 10⁷ | 0.8 |
| M3 | Dihydroxylation (N-butyl chain + indazole ring) | 363.2019 | −2.15 | C18H26N4O4 | 161, 179, 233, 251, 318. 346 | 4.74 | 6.73 × 10⁶ | 1.05 × 10⁷ | 0.8 |
| M4 | N-debutylation | 275.1501 | −0.552 | C14H18N4O2 | 145, 163, 230, 258 | 4.81 | 1.22 × 10⁸ | 1.29 × 10⁸ | 9.4 |
| M5a | Hydroxylation (N4-butyl chain) | 347.2061 | −4.80 | C18H26N4O3 | 145, 163, 217, 235, 302, 330 | 5.08 | 6.11 × 10⁷ | 6.78 × 10⁷ | 4.2 |
| M6 | Hydroxylation (N-butyl chain) | 347.2061 | −4.80 | C18H26N4O3 | 145, 163, 217, 235, 302, 330 | 5.19 | 3.26 × 10⁸ | 3.34 × 10⁸ | 24.3 |
| M7 | Dihydroxylation (Tert-butyl chain + indazole ring) | 363.2019 | −2.15 | C18H26N4O4 | 161, 179, 217, 235, 288, 318, 346 | 5.23 | 1.18 × 10⁷ | 1.63 × 10⁷ | 1.2 |
| M8 | Ketone formation (N-butyl chain) | 345.1919 | −0.629 | C18H24N4O3 | 145, 163, 215, 233, 300, 328 | 5.44 | 4.70 × 10⁷ | 1.00 × 10⁸ | 7.3 |
| M9 | Hydroxylation (N-butyl chain) | 347.2061 | −4.80 | C18H26N4O3 | 145, 163, 217, 235, 302, 330 | 5.49 | 4.90 × 10⁷ | 5.33 × 10⁷ | 3.9 |
| M10 | Ketone formation (N-butyl chain) | 345.1919 | −0.629 | C18H24N4O3 | 145, 163, 215, 233, 300, 328 | 5.63 | 1.18 × 10⁷ | 2.34 × 10⁷ | 1.7 |
| M11 | Hydroxylation (Indazole ring) | 347.2061 | −4.80 | C18H26N4O3 | 161, 179, 217, 235, 302, 330 | 5.88 | 7.84 × 10⁷ | 5.16 × 10⁷ | 3.8 |
| M12 | Hydroxylation (tert-butyl chain) | 347.2061 | −4.80 | C18H26N4O3 | 145,163, 201, 219, 272, 302, 330 | 5.91 | 2.10 × 10⁸ | 1.10 × 10⁸ | 8.1 |
| M13 | Hydroxylation + dehydrogenation (tert-butyl chain) | 345.1919 | −0.629 | C18H24N4O3 | 145, 163, 201, 219, 327 | 5.96 | 4.52 × 10⁷ | 7.07 × 10⁷ | 5.1 |
| M14 | Hydroxylation (indazole ring) | 347.2061 | −4.80 | C18H26N4O3 | 161, 179, 217, 235, 302, 330 | 6.16 | 3.33 × 10⁸ | 2.61 × 10⁸ | 19.0 |
| M15a | Oxidative deamination | 332.1977 | 2.50 | C18H25N3O3 | 145, 163, 201, 219, 286 | 7.49 | 1.56 × 10⁷ | 1.61 × 10⁷ | 1.0 |
Peak area for ADB-BUTINACA at 0 min was 2.56 × 10⁹. Metabolites are listed by ascending retention time.
Results were confirmed by reference standards.
Results
ADB-BUTINACA is Metabolically Unstable Yielding Multiple Phase I Metabolites ADB-BUTINACA Fragmentation
ADB-BUTINACA (parent [M + H]+m/z 331.2126) was fragmented via loss of amine (m/z 314.1865), carboxamide (m/z 286.1916), dimethylbutanamide (m/z 219.1130), and aminodimethylbutamamide (m/z 201.1025) functional groups (Fig. 1, A). Further N-butyl chain loss from product ions at m/z 219.1130 and 201.1025 yielded secondary product ions at m/z 145.0398 and 163.0499. The fragmentation pattern was similar to that of ADB-PINACA with a 14.0156 Da difference observed for all product ions except ions at m/z 145.0398 and 163.0499 (12).
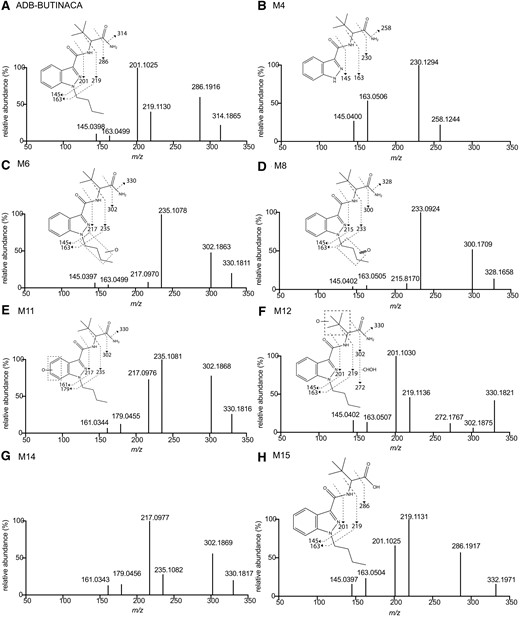
MS/MS spectra and assigned chemical structural fragmentation patterns of ADB-BUTINACA (A), M4 (B), M6 (C), M8 (D), M11 (E), M12 (F), M14 (G), and M15 (H). M11 and M14 as indazole ring hydroxylated metabolites had same fragmentation patterns.
Phase I Metabolites of ADB-BUTINACA
Forty metabolites were identified with 15 representing >94% total chromatographic peak area (Fig. 2). Biotransformation, m/z of parent ion, mass error, elemental composition, retention time, chromatographic peak area at 1 h and 2 h, and estimated percentage of metabolite at 2 h are summarized for metabolites M1 to M15 in Table 1. MS/MS spectra and fragmentation patterns are shown in Fig. 1 for the most abundant 5 metabolites (M4, M6, M8, M12, and M14), M11 and M15, and in Supplemental Figs. 2 and 3 for the other minor metabolites. Hydroxylation was the dominant Phase I reaction (M5, M6, M9, M11, M12, and M14), with sequential reactions producing ketone (M8, M10), dihydroxylated (M1, M3, and M7) and dehydrogenated (M13) metabolites (Fig. 2). Other reactions included N-debutylation (M4), dihydrodiol formation (M2), and oxidative deamination (M15).

(A) Combined extracted ion chromatogram and (B) proposed metabolic pathways of ADB-BUTINACA to 15 major metabolites post–2-h incubation with NADPH in human liver microsomes. Bold arrow indicates major pathway. Enzymes contributing to the formation of top 3 monohydroxylated metabolites (M6, M12, and M14) are shown.
Hydroxylation and Further Ketone Formation, Dihydroxylation or Dehydrogenation
M5, M6, M9, M11, M12, and M14 are monohydroxylated metabolites as indicated by +15.9949 Da mass shift from parent drug. Based on MS/MS spectra, these metabolites were further classified into 3 categories. For M5, M6, and M9, the mass shift was observed in all product ions, except m/z 145.0397 and m/z 163.0499, suggesting a hydroxylation at the N-butyl chain. M5 was identified as N-(4-hydroxybutyl) metabolite by comparison with retention time and MS/MS spectrum of the reference metabolite. For M11 and M14, the same mass difference was observed in all product ions, including m/z 161.0344 and 179.0450 (m/z 145.0398 and 163.0499 +O, respectively), suggesting a hydroxylation at the indazole moiety. For M12, its MS/MS spectrum presented the same product ions as ADB-BUTINACA except for m/z 330.1807 and 302.1860, which were associated with respective losses of amine and carboxamide, indicating that hydroxylation occurred at the tert-butyl chain. Notably, the product ion at m/z 302.1860 displayed a low signal intensity in favor of m/z 272.1766, which was produced by a sequential loss of hydroxymethyl (-CHOH). This phenomenon was similarly observed for ADB-PINACA (12) and ADB-FUBINACA (19).
M1, M3, and M7 were distinct dihydroxylated metabolites despite a common +31.9903 Da mass shift. Details of their fragmentation patterns are further described in the Supplemental Results.
Oxidation occurred for M6 and M9, resulting in ketone formation of M8 and M10 (+O −2H). The mass shifts of parent and product ions from ADB-BUTINACA, apart from ions at m/z 145.0401 and 163.0504, indicated ketone formation at the N-butyl chain. M13 presented the same mass shift (+13.9794 Da) for parent ion but was only observed at product ion of m/z 327.1826 (amine loss, m/z 313.1863, +O −2H), indicating hydroxylation and dehydrogenation at the tert-butyl chain. This reaction was likely an imine formation rather than ketone formation due to the stability of imine (12, 19).
N-Debutylation
M4 is an N-debutylated metabolite as indicated by the mass loss of 56.0631 Da (−C4H8). Major fragments were generated by losses of carboxamide (m/z 230.1294) and dimethylbutanamide (m/z 163.0502). This reaction is commonly observed for SCs with an N-aliphatic chain (12, 20–22) and for ADB-FUBINACA with a methylenefluorophenyl moiety (19).
Dihydrodiol Formation
M2 with a 34.0058 Da increase (+O +H2O) suggested a dihydrodiol formation. Details of the fragmentation patterns are further described in the Supplemental Results. This biotransformation is common among SCs with an indazole core (23, 24).
Oxidative Deamination
M15 is an oxidative deaminated metabolite that yielded −0.9851 Da shift (−NH2 +OH) of parent ion but same product ions as ADB-BUTINACA. This was the only prominent metabolite detected in HLM incubation without NADPH. This biotransformation is common among SCs containing terminal ester and amide, and CES is the typical enzyme catalyzing this reaction (13, 25).
CYP2C19, CYP3A4, and CYP3A5 are Key Metabolizing Enzymes of ADB-BUTINACA
In the presence of NADPH, t1/2 of ADB-BUTINACA was 14.74 min (95% CI 14.28 to 15.24 min). Its elimination rate constant k was 0.047 min−1, which was scaled to yield in vitro CLint, uninhibited of 0.094 mL/min/mg, CLint, liver of 6664 mL/min and CLH, parent of 715 mL/min with hepatic extraction ratio of 0.5. No observable metabolism of ADB-BUTINACA was seen in the absence of NADPH or in negative control (Supplemental Fig. 4), confirming that the metabolism of ADB-BUTINACA was mainly mediated by CYP450.
CYP450 selective inhibitors ticlopidine, S-(+)-N-3-benzyl-nirvanol and ketoconazole demonstrated substantial inhibition of metabolic activity, with twice the amount of ADB-BUTINACA remaining compared to control after 30 min incubation (P values <0.0001) (Fig. 3, A). The percentage of ADB-BUTINACA remaining postinhibition in the presence of α-naphthoflavone and quinidine was also higher compared to control albeit at a significance of P = 0.0506 and 0.0276, respectively. Involvement of CYP2C19, CYP3A4, and CYP3A5 in the metabolism of ADB-BUTINACA was further confirmed through respective recombinant enzyme incubation experiments (Fig. 3, B). These 3 CYP450 isoforms are the predominant metabolizing enzymes of ADB-BUTINACA (Fig. 3, C;Supplemental Table 4). Minor contributions of CYP2C8 and CYP2C9 were observed as well. Despite M15 being a minor metabolite, we investigated and confirmed CES1b but not CES2 was the isoform catalyzing this metabolism (Supplemental Fig. 5). Notably, the t1/2 of ADB-BUTINACA based on CES1b-mediated metabolism was prolonged at 508 min.
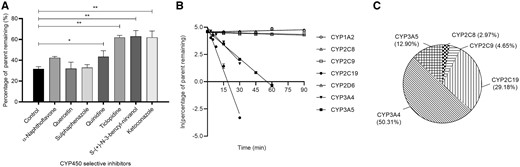
Contribution of CYP450 isoforms to the metabolism of ADB-BUTINACA. (A) The effect of CYP450-specific chemical inhibitors on the remaining amount of ADB-BUTINACA after 30 min incubation in human liver microsomes. Data are shown as mean ± SD. Results were compared between control and each inhibitor (*P = 0.0276; **P < 0.0001). (B) Remaining amount of ADB-BUTINACA for each recombinant CYP450 isoform vs incubation time. Data are shown as mean ± SD. Line represents linear regression curve. (C) Relative contribution of each CYP450 isoform to the overall metabolism of ADB-BUTINCA calculated via Eq. 2.
To further elucidate the contribution of enzymes to specific metabolite, we quantified the peak area ratio of the top 3 monohydroxylated metabolites, M6, M12, and M14, after 30 min incubation in various CYP450 incubation systems. CYP3A5 was found to be extensively involved in the formation of M6 with CYP3A4 and CYP2C8 contributing to a lesser extent (Supplemental Fig. 6, A). The formation of M12 was mainly mediated by CYP3A5 and to a lesser extent by CYP3A4 (Supplemental Fig. 6, B). Lastly, M14 formation was exclusively mediated by CYP2C19, with CYP2C9, CYP3A4, and CYP3A5 having marginal contributions (Supplemental Fig. 6, C).
M6 is Metabolically Stable Compared to M12 and M14
For Phase I metabolism, the key metabolite M6 was the most stable with t1/2 of 190 min while the other 2 key metabolites M12 and M14 yielded similar t1/2 of 58.8 min and 47.7 min, respectively (Fig. 4, A). For Phase II metabolism, M14 was the only metabolite highly susceptible to glucuronidation (Fig. 4, B), with t1/2 of 9.07 min while both M6 and M12 demonstrated negligible depletion.
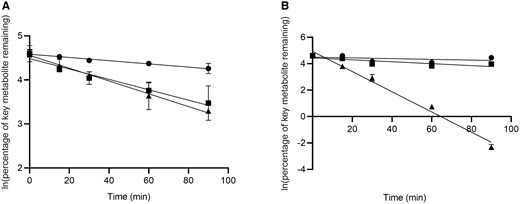
Metabolic stability of M6 (●), M12 (■) and M14 (▴) in (A) Phase I and (B) Phase II incubation systems. Data are shown as mean ± SD. Line represents linear regression curve.
M6, M11, M14, and M15 are Urinary Biomarkers of ADB-BUTINACA
M6 and M14 were the only 2 out of 5 key HLM-derived metabolites (M4, M6, M8, M12, and M14) that were detected in almost all urine samples (Fig. 5; Supplementary Table 5). M11 and M15 were present in all urine samples despite their apparently low abundances in vitro. Among the 3 reference metabolites available, M15 was the only one detected consistently. N-butanoic acid metabolite was detected in 3 samples. Secondary metabolites (M3, M7, M8, M10, and M13) were detected sparsely, except for M1 in 6 samples.

Number of occurrences of ADB-BUTINACA and its metabolite in authentic urine specimens associated with its abuse (dark grey bar).
aThree metabolites with commercially available reference standards.
Discussion
The extensive Phase I metabolism of ADB-BUTINACA in HLM mirrored the metabolism of ADB-PINACA in human hepatocytes (12). Because urine samples are commonly treated with β-glucuronidase to facilitate Phase I metabolite detection (26), Phase II glucuronidation with UGT cofactors was excluded in our HLM experiments. The 5 key Phase I metabolites of ADB-BUTINACA were M6, M14, M4, M12, and M8 (in descending order of peak area). Despite the apparent higher abundance of M4, it remains a nonspecific urinary biomarker of ADB-BUTINACA since it could be produced by ADB-PINACA and ADB-FUBINACA (12, 19). Conversely, M6, M12, and M14 retain the unique chemical scaffold of ADB-BUTINACA and their detection might be applied to confirm the intake of ADB-BUTINACA unambiguously.
For the 3 metabolites with available reference standards, only M5 and M15 were detected in HLM albeit their low abundances. Minor formation of M5 was in line with other nonhalogenated SCs such as JWH-018, JWH-073, and THJ-018 in which the penultimate (ω-1) carbon is preferentially oxidized compared to the terminal carbon (ω) (27, 28). The tert-butyl group replaced from iso-propyl group could suppress the metabolism of carboxamide by CES as observed for M15. This was similarly observed for other indazole carboxamide class of SCs, like ADB-PINACA (12) vs AB-PINACA (23) and ADB-FUBINACA (19) vs AB-FUBINACA (24). The absence of N-butanoic acid metabolite could be partly explained by both the low abundance of upstream M5 and absence of cytosolic alcohol and aldehyde dehydrogenases in HLM (29).
A previous study on 5F-MDMB-PINACA and 4F-MDMB-BINACA has validated the feasibility of using in vitro methodology to identify specific enzymes involved in the metabolism of SCs and determine their contribution to individual metabolic pathway (13). This knowledge is critical for evaluating the toxicological implications of SC–drug interactions. We therefore applied the same reaction phenotyping to elucidate the metabolic pathways of ADB-BUTINACA. Notably, our 2-pronged approach of using specific enzyme inhibitors and recombinant enzymes provided adequate evidence to ascertain the metabolic routes of ADB-BUTINACA. Our findings confirmed CYP450 is the main class of enzymes contributing to the elimination of ADB-BUTINACA. Specifically, we established that CYP3A4 (50.3%), CYP2C19 (29.2%), and CYP3A5 (12.9%) are key metabolizing enzymes of ADB-BUTINACA. As these are common drug-metabolizing enzymes, abusers of ADB-BUTINACA who are prescribed with drugs that are substrates, inhibitors, or inducers of these enzymes might potentially experience clinically significant SC–drug interactions and adverse effects.
The metabolic instability of ADB-BUTINACA (t1/2 < 30 min) highlighted hepatic metabolism as a key route of elimination and the importance of choosing metabolites as surrogate urinary biomarkers to determine consumption of ADB-BUTINACA. To ensure such biomarkers were appropriately selected, authentic urine samples should be used to corroborate with the metabolite identification studies. Our laboratory has demonstrated a quantitative in vitro methodology characterizing the disposition kinetics of metabolites that can help rationalize selection of urinary biomarkers (13). One caveat, however, in the current case is the lack of reference standards for the key metabolites of ADB-BUTINACA. To circumvent this problem, we generated the 3 key Phase I metabolites (M6, M12, and M14) in situ for metabolic stability tests. M6 was predicted to have a longer systemic exposure compared to M12 and M14, underscoring its potential as the specific urinary biomarker for ADB-BUTINACA. M14 is rapidly depleted by glucuronidation, highlighting the importance of processing urine samples with β-glucuronidase to facilitate Phase I metabolite detection.
We presented a feasible approach to combine in vitro HLM metabolite profiling with authentic human urine analysis for the comprehensive identification of urinary metabolites of ADB-BUTINACA. Three hydroxylated metabolites (M6, M11, and M14) and 1 oxidative deaminated metabolite (M15) of ADB-BUTINACA were present in most if not all the 7 clinical samples at apparently higher abundance based on peak area ratio. As the positions of hydroxylation are currently unknown for M6, M11, and M14, further structure identification and synthesis of reference metabolites are warranted.
Our work underscores the importance of correlating in vitro and in vivo findings for selecting optimal biomarkers of SCs. For instance, several key secondary metabolites (M3, M7, M8, M10, and M13) of ADB-BUTINACA observed in HLM were not detected in most urine samples. Additionally, despite their comparable in vitro t1/2 in Phase I metabolism, M12 was only detected in 2 samples while M14 was present in all 7 urine samples. One option is to consider the physiologically relevant primary human hepatocytes as a model instead of HLM if its higher cost is not a concern (30). Other options are human liver S9 fraction and zebrafish larvae (31, 32). More important, such a discrepancy is fundamentally associated with our lack of knowledge of the in vivo pharmacokinetics of these metabolites. Without establishing their sequential metabolic clearance, renal clearance, and volume of distribution, their potential roles as urinary biomarkers were poorly defined. It is tempting to posit, for instance, that the presence of the less abundant HLM-derived M15 in all 7 urine samples may possibly be due to its longer in vivo t1/2 and higher fraction of renal excretion (e.g., active tubular secretion via renal transporters), which are currently unknown.
In summary, our study established the metabolic profile of ADB-BUTINACA and defined its key metabolizing enzymes and metabolism pathways. Three key metabolites (M6, M12, and M14) were generated in situ and demonstrated relatively greater metabolic stability compared to ADB-BUTINACA. Coupling metabolite profiling with urinary analysis, we comprehensively identified 4 urinary biomarker metabolites of ADB-BUTINACA, namely 3 hydroxylated metabolites (M6, M11, and M14) and 1 oxidative deaminated metabolite (M15). Future structural elucidation and synthesis of these metabolites are essential to incorporate them as reference standards for the forensic surveillance of ADB-BUTINACA abuse.
Supplemental Material
Supplemental material is available at Clinical Chemistry online.
Author Contributions
All authors confirmed they have contributed to the intellectual content of this paper and have met the following 4 requirements: (a) significant contributions to the conception and design, acquisition of data, or analysis and interpretation of data; (b) drafting or revising the article for intellectual content; (c) final approval of the published article; and (d) agreement to be accountable for all aspects of the article thus ensuring that questions related to the accuracy or integrity of any part of the article are appropriately investigated and resolved.
C.H. Sia, C.Y. Fong, conducted experiments and data analysis; Z. Wang, conducted experiments; E.M.L. Goh, Y.L. Tan, C.Y. Fong, supported LC-MS analysis; C.H. Sia, Z. Wang, H.Y. Moy, E.C.Y. Chan, participated in research design, wrote, or contributed to manuscript writing.
Authors' Disclosures or Potential Conflicts of Interest
No authors declared any potential conflicts of interest.
Role of Sponsor
No sponsor was declared.
Acknowledgments
We acknowledge the support by the Singapore Health Sciences Authority.
References
European Monitoring Centre for Drugs and Drug Addiction. New psychoactive substances: global markets, glocal threats and the COVID-19 pandemic: an update from the EU Early Warning System.
Advisory Council on the Misuse of Drugs. Synthetic cannabinoid receptor agonists (SCRA): An updated harms assessment and a review of classification and scheduling under the Misuse of Drugs Act 1971 and its regulations.
Legislation Division of the Singapore Attorney-General’s Chambers. Misuse of Drugs Act.
Virginia General Assembly. 18VAC110-20-322. Placement of chemicals in Schedule I.
Ministry of Health and Social Affairs. Ordinance amending the Ordinance (1992:1554) on the control of narcotic drugs.
U.S. Food and Drug Administration. Drug development and drug interactions: Table of substrates, inhibitors and inducers.
Nonstandard Abbreviations:
- SC
synthetic cannabinoid
- CYP450
cytochrome P450 enzyme
- CES
carboxylesterase
- UGT
UDP-glucuronosyltransferase
- ADB-BUTINACA
(S)-N-(1-amino-3,3-dimethyl-1-oxobutan-2-yl)-1-butyl-1H-indazole-3-carboxamide
- IS
internal standard
- HLM
human liver microsomes
- ACN
acetonitrile
- k
elimination rate constant
- t1/2
half-life
- in vitro CLint
in vitro microsomal intrinsic clearance
- CLint
in vitro hepatic intrinsic clearance
- CLH
in vivo hepatic clearance
- in vitro CLint, rj
in vitro microsomal intrinsic clearance attributed to the jth recombinant enzyme
- CLint, j
in vitro intrinsic clearance mediated through individual CYP450 in HLM
Author notes
Chi Hon Sia and Ziteng Wang contributed equally.
