


ABSTRACT
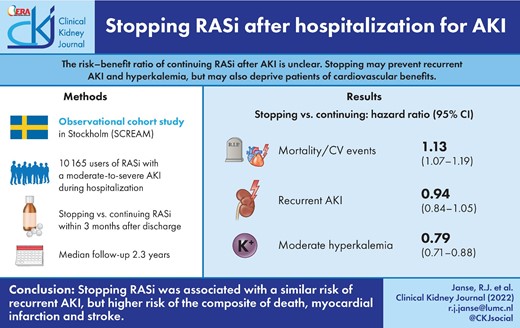
The risk–benefit ratio of continuing with renin–angiotensin system inhibitors (RASi) after an episode of acute kidney injury (AKI) is unclear. While stopping RASi may prevent recurrent AKI or hyperkalaemia, it may deprive patients of the cardiovascular benefits of using RASi.
We analysed outcomes of long-term RASi users experiencing AKI (stage 2 or 3, or clinically coded) during hospitalization in Stockholm and Sweden during 2007–18. We compared stopping RASi within 3 months after discharge with continuing RASi. The primary study outcome was the composite of all-cause mortality, myocardial infarction (MI) and stroke. Recurrent AKI was our secondary outcome and we considered hyperkalaemia as a positive control outcome. Propensity score overlap weighted Cox models were used to estimate hazard ratios (HRs), balancing 75 confounders. Weighted absolute risk differences (ARDs) were also determined.
We included 10 165 individuals, of whom 4429 stopped and 5736 continued RASi, with a median follow-up of 2.3 years. The median age was 78 years; 45% were women and median kidney function before the index episode of AKI was 55 mL/min/1.73 m2. After weighting, those who stopped had an increased risk [HR, 95% confidence interval (CI)] of the composite of death, MI and stroke [1.13, 1.07–1.19; ARD 3.7, 95% CI 2.6–4.8] compared with those who continued, a similar risk of recurrent AKI (0.94, 0.84–1.05) and a decreased risk of hyperkalaemia (0.79, 0.71–0.88).
Stopping RASi use among survivors of moderate-to-severe AKI was associated with a similar risk of recurrent AKI, but higher risk of the composite of death, MI and stroke.
INTRODUCTION
Acute kidney injury (AKI) is a common complication in hospitalized patients, which predicts worse outcomes, including a higher risk of death, cardiovascular events and chronic kidney disease (CKD) [1–6]. Renin–angiotensin system inhibitors (RASi) are a cornerstone of care in preventing cardiovascular events and progression of proteinuric CKD [7–13] and may also decrease the risk of events post-AKI, as found in intensive care settings [14–16]. However, RASi have also been associated with the development of AKI [17–19], and there is a belief that in the setting of acute intercurrent illness, RASi can cause recurrent AKI [20]. This leaves the risk–benefit ratio of RASi after an episode of AKI unclear.
Recent observational studies have tried to address this issue [20–24], but provided conflicting results of higher [20] and similar [22–24] risks of recurrent AKI. Differing results may be attributed to differences in study designs, as some studies excluded patients with heart failure [23] or focussed on veterans, the majority of whom are men [24]. Most studies also included participants after Kidney Disease: Improving Global Outcomes (KDIGO) stage 1 AKI [20, 22, 23]. Stage 1 AKI may reflect non-pathological changes in creatinine levels, for example, due to surgery, hydration or drugs, which may not be clinically relevant. Previous studies often included both prevalent and new users of RASi [20, 22, 23], and we argue that stopping versus continuing RASi is a different scenario from newly initiating versus never initiating RASi after AKI. Finally, the likelihood of stopping versus continuing therapy is influenced by whether patients needed RASi in the first place (i.e. whether they had a specific evidence-based indication).
In this study, we tried to overcome the identified limitations and investigated the association of stopping RASi within 3 months after hospital discharge with the risk of adverse clinical outcomes among long-term users of RASi who developed moderate or severe AKI during hospitalization.
MATERIALS AND METHODS
This studywas reported according to the REporting of studies Conducted using Observational Routinely collected health Data for PharmacoEpidemiology statement (RECORD-PE) [25]. A visual depiction of the study design and analysis is available in Supplementary data, Figure S1 [26]. Methods employed are elaborated in Supplementary data, Methods.
Data sources
We used data from the Stockholm CREAtinine Measurements (SCREAM) project, a healthcare utilization cohort of all residents in the region of Stockholm who accessed healthcare between 1 January 2006 and 31 December 2019 [27]. The region of Stockholm provided universal healthcare access to approximately 2.9 million citizens during the study period. Laboratory data were linked with other administrative databases to ascertain demographics, diagnoses, drug dispensations, healthcare use, vital status and the start of kidney replacement therapy (KRT).
Study design
We included all patients >18 years who were long-term prevalent users of RASi with a guideline indication for RASi treatment and who, between 1 January 2007 and 31 December 2018, survived stage 2 or 3 AKI or a clinically recognized AKI.
First, we identified all hospital admissions during which an AKI diagnosis was issued or where creatinine changes defining AKI stage 2 or 3 according to creatinine changes were detected [9]. Admission creatinine used in KDIGO AKI staging was defined as the mean of all creatinine measurements in the previous year up to 7 days before the index admission date. We then selected those participants who had an indication for RASi use [8–11, 13, 28]. For the definition of exposures, covariates and outcomes, see Supplementary data, Table S1 and Figure S1. Finally, we selected only those who had at least one dispensation for angiotensin-converting-enzyme inhibitors (ACEi) and angiotensin receptor blockers (ARB) in the year prior to hospitalization.
We excluded patients who did not reside in Stockholm at the time of AKI admission, whose baseline kidney function was <15 mL/min/1.73 m2 or who had ever undergone dialysis or kidney transplantation. We also excluded those in whom admission creatinine could not be calculated and those who died either during their hospital stay or within 90 days from hospital discharge (Supplementary data, Figure S1).
We applied a landmark design at 3 months to avoid immortal time bias, in which follow-up started at Day 91 after hospitalization. Study exposure was determined from Day 1 to Day 90 after hospitalization [29]. The landmark design assumed a fixed exposure and thereby simulated an intention-to-treat effect. Study participants were followed up until the occurrence of death, emigration, 5 years after the landmark or administrative censoring (31 December 2019).
Exposure
Stopping was defined as the absence of a pharmacy dispensation for RASi within the first 3 months after hospital discharge, indicating stopping RASi treatment. Continuing was defined as at least one pharmacy dispensation for RASi at any point during the first 3 months after hospital discharge.
Outcomes
The primary outcome was the composite outcome of stroke, myocardial infarction (MI) and all-cause mortality; the secondary outcome was recurrent AKI (by clinical diagnosis). We used only a clinical diagnosis because a first AKI obscures what can be considered ‘baseline creatinine’ needed to determine AKI based on creatinine changes. For completeness, and because previous studies have reported contradictory results for the risk of heart failure hospitalization (HHF) [20–22] and CKD progression [20, 22], we included these as tertiary outcomes. Finally, the risk of moderate hyperkalaemia (potassium ≥5.5 mmol/L) was selected as a positive control outcome, this being a recognized adverse event of RASi therapy (Supplementary data, Table S1).
Covariates
Covariates included age at discharge, sex, baseline estimated glomerular filtration rate (eGFR) (calculated from admission creatinine determined for KDIGO AKI criteria), eGFR at 90 days [calculated as the closest to (but not after) Day 90 post-discharge outpatient creatinine measurement], attained education, medical history (including events occurring up to discharge), medication use (between 180 days and 1 day before the index admission), healthcare access in the year prior to hospitalization, cause of and procedures and conditions during the index hospitalization, and laboratory values (Supplementary data, Figure S1, Table S1). eGFR was calculated using the 2009 Chronic Kidney Disease Epidemiology Collaboration formula without considerations for race [30].
Statistical analyses
Categorical variables are presented as proportions. Depending on the distribution, continuous variables are either presented as the mean with standard deviation (SD) or the median with interquartile range (IQR). Overlap weighted Cox regression with 75 covariates was used to estimate adjusted hazard ratios (HRs) [31]. Weighted absolute risks and absolute risk differences (ARDs) at 5 years after start of follow-up were also calculated for all outcomes and weighted cumulative incidence curves were computed for all outcomes.
We performed prespecified subgroup analyses stratified by age (<65 versus ≥65 years), heart failure, ischaemic heart disease, diabetes and moderately to severely decreased CKD (<45 versus ≥45 mL/min/1.73 m2). P-values for interaction in subgroups were calculated using a Wald test. We performed four sensitivity analyses: we (i) re-estimated our HRs with double robust Cox regression; (ii) additionally adjusted for albumin–creatinine ratio (ACR) categories; (iii) restricted analyses to participants with a diagnostic code N17 during their index AKI; and (iv) changed the landmark from 3 to 6 months. All statistical analyses were performed using R version 4.1.0 (R Foundation for Statistical Computing, Vienna, Austria).
RESULTS
Baseline characteristics
Between 2007 and 2018, we identified 10 165 prevalent users of RASi with an indication for the therapy and who survived for at least 3 months after discharge following a hospitalization that included a moderate to severe AKI. The frequency of indications overall and between stoppers and continuers is shown in Supplementary data, Table S2. A total of 71 study participants (1%) started maintenance dialysis during the landmark period. Of the 10 165 prevalent RASi users, 4429 stopped RASi and 5736 continued (Figure 1). The time course of restarting is shown in Supplementary data, Figure S2. The majority of continuers dispensed RASi already before the landmark and, among continuers, 608 (13%) discontinued for more than 30 days after the landmark with a median of 0.5 years until discontinuation. The study participants had a median (IQR) age of 78 (69–85) years, with the majority of participants being older than 80 years (Table 1) and 45% of participants being women. Median kidney function was 55 mL/min/1.73 m2. Common comorbidities included hypertension (91%), chronic heart failure (54%) and diabetes (45%). The most commonly used medications in the year prior to hospitalization were anticoagulants (71%), beta-blockers (66%) and loop diuretics (52%). After weighting, all baseline characteristics were well-balanced (Table 1 and Supplementary data, Table S3).
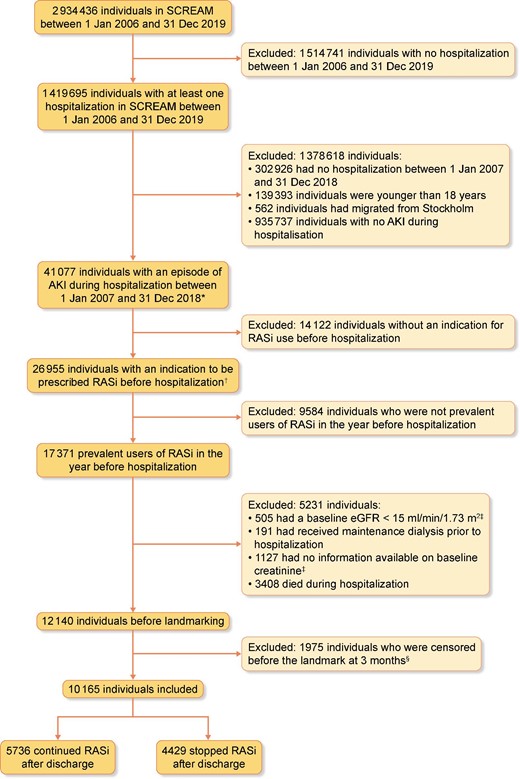
Flowchart showing patient selection. *Acute kidney injury (AKI) was defined as either AKI stage 2 or stage 3 using plasma creatinine changes according to KDIGO criteria or as an ICD-10 code N17 in any diagnostic position during hospitalization. †An indication for RASi use was defined as follows: (i) cardiovascular disease (i.e. ischaemic heart disease, peripheral vascular disease, or cerebrovascular disease), (ii) heart failure, (iii) diabetes mellitus with kidney function ≤60 mL/min/1.73 m2, (iv) diabetes mellitus with albuminuria ≥20 mg/L or with an albumin–creatinine ratio (ACR) ≥3 mg/mmol, (v) hypertension with kidney function ≤60 mL/min/1.73 m2 or (vi) albuminuria ≥200 mg/L or ACR >30 mg/mmol. ‡Baseline creatinine was defined as the mean of all creatinine measurements within the 365 to 7 days prior to hospital admission. Baseline eGFR was calculated from baseline creatinine. §A landmark design was applied in which at 3 months after the study start (Day 90), exposure was determined using the past 3 months and then fixed, with follow-up starting at Day 91.
Baseline characteristics (before and after weighting) of patients stopping or continuing RASi treatment 3 months after an AKI
| Before weighting | After weighting | ||||||
|---|---|---|---|---|---|---|---|
| Overall | Stopped RASi | Continued RASi | SMDa | Stopped RASi | Continued RASi | SMDa | |
| Number of individuals | 10 165 | 4429 | 5736 | 4429 | 5736 | ||
| Median ageb (IQR) (years) | 78 (69, 85) | 79 (70, 85) | 77 (69, 84) | 0.111 | 78 (69, 85) | 78 (70, 85) | <0.001 |
| Age category, % | 0.104 | 0.025 | |||||
| <50 years | 2 | 2 | 2 | <0.001 | 2 | 2 | <0.001 |
| 50–59 years | 5 | 4 | 6 | 0.092 | 5 | 5 | <0.001 |
| 60–69 years | 18 | 18 | 19 | 0.026 | 18 | 18 | <0.001 |
| 70–79 years | 31 | 30 | 32 | 0.043 | 30 | 31 | 0.022 |
| >80 years | 44 | 46 | 42 | 0.081 | 44 | 44 | <0.001 |
| Women | 45 | 46 | 45 | 0.024 | 46 | 46 | <0.001 |
| Highest level of education achieved,c % | 0.064 | 0.035 | |||||
| Compulsory school | 36 | 36 | 36 | <0.001 | 36 | 36 | <0.001 |
| Secondary school | 40 | 39 | 41 | 0.041 | 40 | 40 | <0.001 |
| University | 20 | 22 | 19 | 0.074 | 21 | 20 | 0.025 |
| Missing | 3 | 3 | 3 | <0.001 | 3 | 3 | <0.001 |
| Median admission eGFRb, d (IQR) (mL/min/1.73 m2) | 55 (41, 74) | 53 (39, 70) | 57 (43, 76) | 0.193 | 55 (40, 73) | 55 (41, 73) | <0.001 |
| eGFR categories in mL/min/1.73 m2, % | 0.191 | 0.016 | |||||
| ≥90 | 9 | 7 | 10 | 0.108 | 9 | 8 | 0.036 |
| ≥60–<90 | 32 | 29 | 34 | 0.108 | 31 | 31 | <0.001 |
| ≥45–<60 | 27 | 28 | 27 | 0.022 | 28 | 28 | <0.001 |
| ≥30–<45 | 22 | 24 | 21 | 0.072 | 22 | 23 | 0.024 |
| ≥15–<30 | 10 | 12 | 8 | 0.134 | 10 | 10 | <0.001 |
| Median eGFR at 90 days post-discharge (IQR) (mL/min/1.73 m2)b,c,g | 50.7 (36.0, 69.6) | 48.7 (33.9, 67.3) | 52.3 (37.7, 71.2) | 0.136 | 50.5 (35.9, 69.4) | 50.4 (35.7, 68.7) | 0.021 |
| Medical history, % | |||||||
| Hypertension | 91 | 91 | 91 | 0.017 | 91 | 91 | <0.001 |
| Diabetes mellitus | 45 | 42 | 47 | 0.108 | 45 | 45 | <0.001 |
| Chronic heart failure | 54 | 52 | 56 | 0.072 | 54 | 54 | <0.001 |
| MI | 28 | 27 | 30 | 0.064 | 28 | 28 | <0.001 |
| Arrhythmia | 45 | 45 | 46 | 0.018 | 45 | 45 | <0.001 |
| Cerebrovascular disease | 27 | 26 | 28 | 0.043 | 27 | 27 | <0.001 |
| Peripheral vascular disease | 20 | 20 | 20 | 0.013 | 20 | 20 | <0.001 |
| Ischaemic heart disease | 43 | 41 | 45 | 0.082 | 42 | 42 | <0.001 |
| Extracranial haemorrhage | 1 | 1 | 1 | 0.029 | 1 | 1 | <0.001 |
| Valvular heart disease | 12 | 11 | 12 | 0.027 | 12 | 12 | <0.001 |
| COPD | 20 | 19 | 20 | 0.020 | 20 | 20 | <0.001 |
| Cancer | 28 | 32 | 26 | 0.132 | 29 | 29 | <0.001 |
| Liver disease | 5 | 5 | 5 | 0.001 | 5 | 5 | <0.001 |
| Dyslipidaemia | 37 | 35 | 39 | 0.090 | 37 | 37 | <0.001 |
| Hypothyroidism | 13 | 13 | 13 | 0.028 | 13 | 13 | <0.001 |
| Prior medication use, % | |||||||
| Beta blockers | 66 | 63 | 68 | 0.100 | 65 | 65 | <0.001 |
| Calcium channel blockers | 33 | 33 | 34 | 0.032 | 33 | 33 | <0.001 |
| Loop diuretics | 52 | 51 | 53 | 0.038 | 52 | 52 | <0.001 |
| Thiazide diuretics | 6 | 6 | 6 | 0.018 | 6 | 6 | <0.001 |
| Potassium-sparing diuretics | 21 | 20 | 23 | 0.083 | 21 | 21 | <0.001 |
| NSAIDs | 13 | 13 | 14 | 0.011 | 13 | 13 | <0.001 |
| Lipid-lowering agents | 49 | 45 | 52 | 0.127 | 48 | 48 | <0.001 |
| Alpha blockers | 8 | 8 | 8 | 0.004 | 8 | 8 | <0.001 |
| Nitrate | 18 | 17 | 18 | 0.051 | 17 | 17 | <0.001 |
| MRAs | 21 | 19 | 22 | 0.084 | 20 | 20 | <0.001 |
| Hydralazine | 0 | 0 | 0 | 0.019 | 0 | 0 | <0.001 |
| Antiarrythmics | 1 | 1 | 1 | 0.008 | 1 | 1 | <0.001 |
| Digoxin | 8 | 7 | 9 | 0.061 | 8 | 8 | <0.001 |
| Anticoagulants | 71 | 69 | 73 | 0.089 | 71 | 71 | <0.001 |
| Diabetes medication | 33 | 30 | 36 | 0.119 | 33 | 33 | <0.001 |
| Opioids | 30 | 31 | 30 | 0.006 | 31 | 31 | <0.001 |
| Characteristics of index hospitalization | |||||||
| Median length of stayb (IQR) (days) | 8 (4, 17) | 10 (5, 18) | 8 (4, 16) | 0.156 | 9 (4, 17) | 8 (4, 17) | <0.001 |
| AKI as a cause of admission, % | 19 | 22 | 17 | 0.139 | 20 | 20 | <0.001 |
| Stage of AKI,e % | 0.126 | 0.045 | |||||
| N17 | 28 | 28 | 28 | <0.001 | 28 | 27 | 0.022 |
| Stage 2 | 49 | 46 | 51 | 0.100 | 47 | 49 | 0.040 |
| Stage 3 | 24 | 27 | 21 | 0.141 | 25 | 23 | 0.047 |
| Need for acute dialysis, % | 2 | 2 | 1 | 0.060 | 2 | 2 | <0.001 |
| Median of average plasma creatinineb,f (IQR) (µmol/L) | 180 (135, 251) | 191 (142, 273) | 171 (131, 238) | 0.196 | 184 (138, 255) | 179 (134, 253) | <0.001 |
| Median of peak plasma creatinineb (IQR) (µmol/L) | 231 (170, 334) | 246 (179, 362) | 221 (164, 309) | 0.178 | 235 (174, 342) | 231 (170, 332) | <0.001 |
| Mean potassiumc,g (mmol/L) | 4.4 (0.7) | 4.4 (0.7) | 4.3 (0.7) | 0.106 | 4.4 (0.7) | 4.3 (0.7) | 0.049 |
| Peak potassiumc,g (mmol/L) | 4.9 (1.0) | 4.9 (1.0) | 4.8 (1.0) | 0.119 | 4.9 (1.0) | 4.8 (1.0) | 0.054 |
| Missing potassium,g % | 1 | 1 | 1 | ||||
Categorical variables are presented as percentage. Continuous variables are presented as mean (SD) or as median (IQR) if specified.
RASi, renin–angiotensin system inhibitors; SMD, standardized mean difference; IQR, interquartile range; eGFR, estimated glomerular filtration rate; COPD, chronic obstructive pulmonary disease; NSAID, non-steroidal anti-inflammatory drugs; MRA, mineralocorticoid receptor antagonist; AKI, acute kidney injury; KDIGO, Kidney Disease: Improving Global Outcomes.
A standardized mean difference >0.1 indicates meaningful imbalance between groups.
Standardized difference for the mean was calculated for age, eGFR at admission, eGFR at Day 90 after discharge, healthcare access in the past year, duration of stay and plasma creatinine during admission.
Education, eGFR at Day 90 after discharge and potassium were missing in 3%, 17% and 1%, respectively.
Admission eGFR was calculated from the mean of all creatinine measurements a year prior to hospitalization with exclusion of the measurements 7 days prior to admission.
If an individual met criteria for AKI according to serum creatinine changes and had had a diagnostic code defining AKI during the same hospitalization, the AKI was typed according to serum creatinine changes.
The median of the average plasma creatinine was calculated as follows: for each individual, the average of all creatinine measurements during their hospitalization was calculated. Then, because the distribution of these average values was non-normal, we calculated the median of the values.
Not adjusted for in analyses.
Association of stopping versus continuing RASi with the composite of death, myocardial infarction and stroke
During a median (IQR) follow-up of 2.3 years (1.0–4.4), 3020 individuals in the continuation group and 2613 individuals in the stopping group developed our primary study outcome, corresponding with an incidence rate [95% confidence interval (CI)] of 19.8 (19.1–20.5) and 24.6 (23.7–25.6) per 100 person-years, respectively. Of the 5633 events, 4489 were deaths, 591 were MIs and 553 were strokes. After weighting, the adjusted HR (95% CI) was 1.13 (1.07–1.19) for the stopping group compared with the continuation group (Table 2). The weighted cumulative incidence curve is shown in Figure 2A and shows a consistent difference in the risk of death, MI and stroke over time with a higher risk in the stopping group. Correspondingly, the weighted 5-year absolute risk (95% CI) was 63% (61–64%) in those who continued and 66% (65–68%) in those who stopped: a difference of 3.7% (2.6, 4.8%) higher for the stopping group compared with the continuation group. Results for the individual components of the composite outcome are reported in Supplementary data, Table S4.
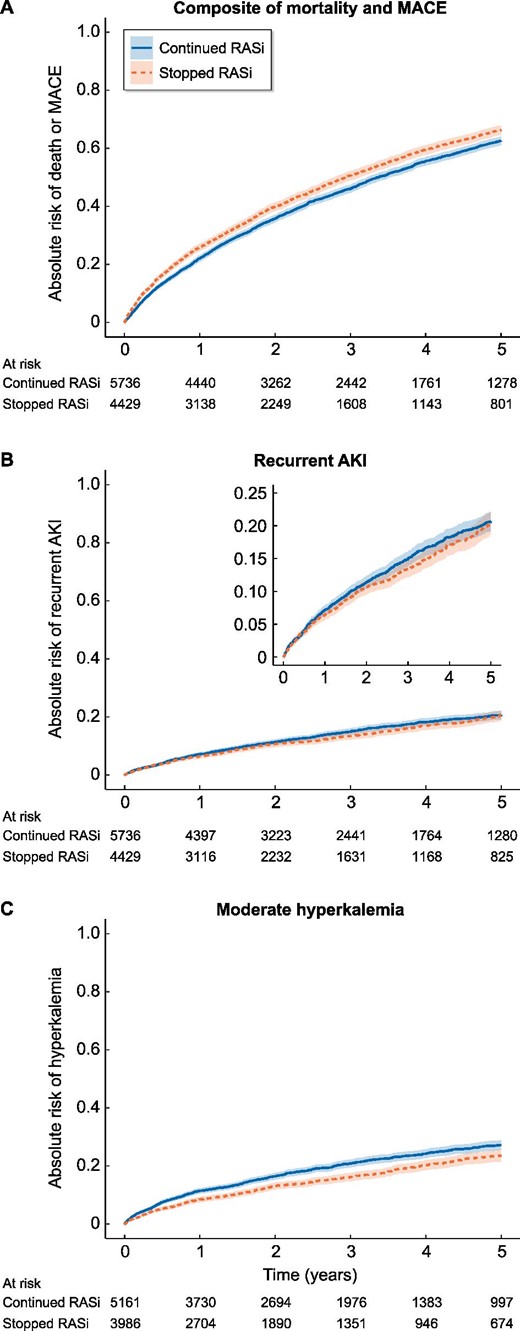
Weighted cumulative incidence curves showing the risk (line) and confidence interval (band) of outcomes stratified by stopping versus continuing RASi for the primary outcome of composite death, MI and stroke, the secondary outcome recurrent AKI and the positive control outcome hyperkalaemia. Time 0 refers to start of follow-up (i.e. 90 days post-discharge). MACE, major adverse cardiac event.
Number of events, incidence rates, crude and adjusted HRs, and weighted ARDs for the association between stopping versus continuing RASi and adverse outcomes
| N | Events | Py | Incidence rate per 100 py | Crude HR (95% CI) | OW adjusted HRa (95% CI) | Absolute risk (95% CI) | ARD (95% CI) | |
|---|---|---|---|---|---|---|---|---|
| Primary outcome: composite of death, MI and stroke | ||||||||
| Overall | 10 165 | 5633 | 25 872 | 21.8 (21.2–22.3) | ||||
| Continued RASi | 5736 | 3020 | 15 257 | 19.8 (19.1–20.5) | 1 (Reference) | 1 (Reference) | 62.6 (61.1–64.0) | |
| Stopped RASi | 4429 | 2613 | 10 614 | 24.6 (23.7–25.6) | 1.23 (1.17–1.30) | 1.13 (1.07–1.19) | 66.3 (64.6–67.9) | 3.7 (2.6, 4.8) |
| Secondary outcome: recurrent AKI | ||||||||
| Overall | 10 165 | 1332 | 25 815 | 5.2 (4.9–5.4) | ||||
| Continued RASi | 5736 | 780 | 15 195 | 5.1 (4.8–5.5) | 1 (Reference) | 1 (Reference) | 20.7 (19.2–22.1) | |
| Stopped RASi | 4429 | 552 | 10 620 | 5.2 (4.8–5.7) | 1.00 (0.90–1.11) | 0.94 (0.84–1.05) | 20.4 (18.7–22.2) | −0.2 (−1.4, 0.9) |
| Positive control outcome: moderate hyperkalaemia | ||||||||
| Overall | 9147 | 1530 | 21 788 | 7.0 (6.7–7.4) | ||||
| Continued RASi | 5161 | 943 | 12 703 | 7.4 (7.0–7.9) | 1 (Reference) | 1 (Reference) | 27.2 (25.5–28.9) | |
| Stopped RASi | 3986 | 587 | 9085 | 6.5 (5.9–7.0) | 0.86 (0.77–0.95) | 0.79 (0.71–0.88) | 23.6 (21.6–25.6) | −3.6 (−5.0, −2.3) |
| Tertiary outcomes: HHF and progression of CKD | ||||||||
| HHF | ||||||||
| Overall | 10 165 | 4245 | 20 624 | 20.6 (20.0–21.2) | ||||
| Continued RASi | 5736 | 2474 | 12 090 | 20.5 (19.7–21.3) | 1 (Reference) | 1 (Reference) | 52.5 (50.9–54.2) | |
| Stopped RASi | 4429 | 1771 | 8533 | 20.8 (19.8–21.7) | 0.98 (0.93–1.05) | 1.01 (0.94–1.07) | 53.3 (51.4–55.3) | 0.8 (−0.5, 2.1) |
| Progression of CKD | ||||||||
| Overall | 9147 | 1999 | 20 665 | 9.7 (9.3–10.1) | ||||
| Continued RASi | 5161 | 1116 | 12 268 | 9.1 (8.6–9.6) | 1 (Reference) | 1 (Reference) | 30.2 (28.5–31.9) | |
| Stopped RASi | 3986 | 883 | 8396 | 10.5 (9.8–11.2) | 1.11 (1.02–1.22) | 1.05 (0.96–1.15) | 31.4 (29.3–33.4) | 1.2 (−0.2, 2.5) |
py, person-years; HR, hazard ratio; CI, confidence interval; OW, overlap weights; ARD, absolute risk difference; RASi, renin–angiotensin system inhibitors; AKI, acute kidney injury; CKD, chronic kidney disease.
Adjusted for age, age categories, sex, education, eGFR at admission, eGFR category at admission, medical history of diabetes, hypertension, MI, arrhythmia, cerebrovascular disease, peripheral vascular disease, ischaemic heart disease, chronic obstructive pulmonary disease, cancer, liver disease, chronic heart failure, dyslipidaemia, hypothyroidism, extracranial haemorrhage, and valvular heart disease, use in the year prior to admission of beta blockers, calcium channel blockers, loop diuretics, thiazide diuretics, potassium-sparing diuretics, NSAIDs, antilipids, alpha blockers, nitrate, mineralocorticoid receptor antagonists, hydralazine, antiarrhythmics, digoxin, anticoagulants, diabetes medication and opioids, health care access in the year prior in primary care context, specialist care context and hospitalizations, primary cause of admission, complications during admission (i.e. sepsis, cardiac surgery, cardiac catheterization, abdominal aortic aneurysm repair, pneumonia, liver failure, acute MI and non-cardiac surgery) and characteristics of admission including duration of stay, AKI as cause of admission, stage of AKI according to KDIGO and average and peak creatinine during hospitalization.
Association of stopping versus continuing RASi with recurrent AKI
Total 780 individuals in the continuation group and 552 individuals in the stopping group had a recurrent AKI episode, corresponding with incidence rates (95% CI) of 5.1 (4.8–5.5) and 5.2 (4.8–5.7) per 100 person-years, respectively. The adjusted HR (95% CI) was 0.94 (0.84–1.05) for the stopping group compared with the continuation group. The weighted cumulative incidence curve shown in Figure 2B shows no consistent difference over time in the risk of recurrent AKI between the two groups. Correspondingly, at 5 years, the ARD (95% CI) was 0.2% (−0.9, 1.4%) lower for the stopping group compared with the continuing group.
Association of stopping versus continuing RASi with other outcomes
The adjusted HR (95% CI) for the positive control outcome hyperkalaemia was 0.79 (0.71–0.88). The adjusted HRs (95% CI) for the association of stopping versus continuing RASi with tertiary outcomes were 1.01 (0.94–1.07) for HHF and 1.05 (0.96–1.15) for CKD progression. The weighted cumulative incidence curves are shown in Figure 2C for hyperkalaemia and in Supplementary data, Figure S3A–B for the tertiary outcomes.
Subgroup analyses
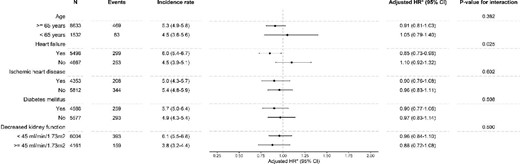
The increased risk of the primary outcome among stoppers was observed among subgroups of age, HHF, ischaemic heart disease and diabetes mellitus with P-values for interaction >0.05 (Figure 3). For decreased kidney function, there was a statistically significant interaction with the risk being higher among study participants with a higher kidney function. A statistically significant interaction was observed for the history of heart failure and stopping versus continuing for the recurrent AKI outcome (Figure 4). No interactions were observed for the outcomes hyperkalaemia and HHF. For the outcome CKD progression, there was an interaction between decreased kidney function and stopping versus continuing (Supplementary data, Figures S4–S6).
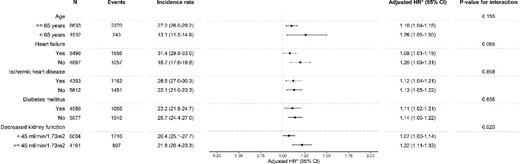
Forest plot showing the association of stopping versus continuing RASi on the composite outcome of death, MI and stroke, stratified by subgroups. *Adjusted for age, age categories, sex, education, eGFR at admission, eGFR category at admission, medical history of diabetes, hypertension, MI, arrhythmia, cerebrovascular disease, peripheral vascular disease, ischaemic heart disease, chronic obstructive pulmonary disease, cancer, liver disease, chronic heart failure, dyslipidaemia, hypothyroidism, extracranial haemorrhage and valvular heart disease, use in the year prior to admission of beta blockers, calcium channel blockers, loop diuretics, thiazide diuretics, potassium-sparing diuretics, non-steroidal anti-inflammatory drugs (NSAIDs), antilipids, alpha blockers, nitrate, mineralocorticoid receptor antagonists, hydralazine, antiarrhythmics, digoxin, anticoagulants, diabetes medication and opioids, health care access in the year prior in primary care context, specialist care context and hospitalizations, primary cause of admission, complications during admission (i.e. sepsis, cardiac surgery, cardiac catheterization, abdominal aortic aneurysm repair, pneumonia, liver failure, acute MI and non-cardiac surgery) and characteristics of admission including duration of stay, AKI as cause of admission, stage of AKI according to KDIGO and average and peak creatinine during hospitalization, with exception of the indicator of the subgroup per subgroup (e.g. we did not adjust for diabetes mellitus in the diabetes mellitus subgroup).
Forest plot showing the association of stopping versus continuing RASi on recurrent AKI. *Adjusted for age, age categories, sex, education, eGFR at admission, eGFR category at admission, medical history of diabetes, hypertension, MI, arrhythmia, cerebrovascular disease, peripheral vascular disease, ischaemic heart disease, chronic obstructive pulmonary disease, cancer, liver disease, chronic heart failure, dyslipidaemia, hypothyroidism, extracranial haemorrhage and valvular heart disease, use in the year prior to admission of beta blockers, calcium channel blockers, loop diuretics, thiazide diuretics, potassium-sparing diuretics, NSAIDs, antilipids, alpha blockers, nitrate, mineralocorticoid receptor antagonists, hydralazine, antiarrhythmics, digoxin, anticoagulants, diabetes medication and opioids, healthcare access in the year prior in primary care context, specialist care context and hospitalizations, primary cause of admission, complications during admission (i.e. sepsis, cardiac surgery, cardiac catheterization, abdominal aortic aneurysm repair, pneumonia, liver failure, acute MI and non-cardiac surgery) and characteristics of admission including duration of stay, AKI as cause of admission, stage of AKI according to KDIGO and average and peak creatinine during hospitalization, with exception of the indicator of the subgroup per subgroup (e.g. we did not adjust for diabetes mellitus in the diabetes mellitus subgroup).
Sensitivity analyses
When using double robust Cox regression, adjusting for ACR categories, restricting the analysis to individuals with an N17 diagnostic code or moving the landmark from 3 to 6 months provided results consistent in magnitude, direction and significance similar to our main analysis (Supplementary data, Figures S2, S7–S9, Tables S5–S10).
DISCUSSION
No randomized trials inform the decision of stopping versus continuing RASi in patients following AKI, a clinical uncertainty that is reflected in the practice variation observed in our study, in which 44% stopped and 56% continued. We explored clinical outcomes associated with stopping versus continuing RASi therapy among 10 165 survivors of a moderate to severe AKI. We observed that compared with continuing RASi, stopping this medication was associated with an increased risk of death, MI and stroke, but with a similar risk of recurrent AKI. We also observed similar risks of HHF or CKD progression. As expected, stopping RASi was associated with a lower risk of hyperkalaemia, though, in keeping with other studies, the residual risk of hyperkalaemia is high [32]. Results supporting the continuation of RASi after AKI were robust across most subgroups and all sensitivity analyses.
Brar et al. evaluated Canadian survivors of AKI during a hospital stay [20] and observed a lower risk (HR, 95% CI) of mortality (0.85, 0.81–0.89), but at a higher risk of recurrent AKI (1.25, 1.08–1.46) for RASi users compared with non-users. We believe that combining prevalent and new users of RASi in the study of Brar et al. combines two different questions in one analysis. Brar et al. did, however, also stratify their treatment groups in a sensitivity analysis, in which they found increased risks for hospitalization for a renal cause for new users (1.32, 1.03–1.69) and continuers (1.34, 1.16–1.55) compared with never users. However, hospitalization for a renal cause as an outcome was defined as a composite of hospitalization for AKI, congestive heart failure, hypervolaemia, hyperkalaemia and malignant hypertension, reducing the ability to make inferences about AKI alone.
Though the use of RASi has been associated with AKI in patients undergoing cardiac surgery [17], surprisingly few studies have explored the risk of AKI associated with RASi. One such study, from UK primary care, reported an increased risk of AKI associated with RASi, which was confined to patients who did not have an established indication [33]. Neither intervention studies nor the current study observed an increased risk of recurrent AKI among prevalent users with AKI who continued with their RASi. In Assessment, Serial Evaluation, and Subsequent Sequelae in AKI (ASSESS-AKI), a North American prospective cohort study, 769 RASi users with prior AKI were compared with clinically matched non-users [22]; risk of death was decreased (0.62, 0.46–0.84) and the risk of recurrent AKI was similar (0.88, 0.69–1.13) for RASi users compared with non-users. Siew et al. evaluated prevalent users of RASi who developed AKI stage 2–3 during hospitalization in the Veterans Affairs system in the USA [24] and reported an increased risk of mortality (1.33, 1.26–1.41) with a similar risk of recurrent AKI (0.98, 0.91–1.05) for those who stopped compared with those who continued. Hsu et al. selected AKI survivors from another health system in the USA and observed no increased risk of recurrent AKI (0.71, 0.45–1.12) for RASi users compared with non-users [23]. Bidulka et al. studied stopping versus continuing RASi in both an English cohort (n = 8566) and a Swedish cohort (n = 2024) [21]. Our findings are in accordance with those from the English cohort, which reported a higher risk (HR, 95% CI) of mortality (1.27, 1.15–1.41) and similar risks of recurrent AKI (0.90, 0.77–1.05). In the Swedish cohort; however, no association with mortality (0.94, 0.78–1.13) or with recurrent AKI (0.81, 0.54–1.21) was found at that time. Although the Swedish cohort from Bidulka et al. was derived from the same data source as our study, differences in results are likely attributable to differences in population selection. Bidulka et al. identified AKI cases solely as an AKI diagnosis coded as the primary cause for hospital admission and limited follow-up to 2 years. In addition, the data collection period was more remote from present day practice (2006–11). Collectively, we interpret that the majority of observational evidence to date, including this study, supports continued RASi use in this population at high cardiovascular risk, on the basis of consistent associations with decreased cardiovascular events and death, and uncertain, variable effects on recurrent AKI.
Some of the previous studies evaluated risks of heart failure or CKD progression, reaching opposing conclusions. We regarded them as tertiary outcomes for in our understanding the effectiveness of RASi in preventing heart failure has mainly been seen in patients in trials of heart failure patients [34, 35] and the effect of RASi on delaying CKD progression is moderately certain and well known, but unlikely to be the reason for which RASi was initiated in this general population cohort. The increased heart failure risk reported by Brar et al. among those who stopped RASi [20], was not seen in our study, nor in previous analyses [21, 22]. This is somewhat surprising; however, the evidence that RASi reduces outcomes in patients with heart failure is limited to the study of participants with low ejection fraction and we do not know what proportion of our participants have low ejection fraction. The lower risk of CKD progression reported by Brar et al. among those who stopped [20] was also not seen in our study nor in previous analyses [22]. The differences between studies in populations (particularly the selection of both prevalent and incident users in Brar et al.) may account for the differences in findings.
Our study has a number of strengths: we focussed on evaluating long-term RASi users with moderate to severe AKI, a population in whom this research question is of clinical relevance. We were able to utilize complete healthcare records for a population of a whole region in a country with universal healthcare access; this possibly reduced the risk of healthcare use bias, allowed rich adjustment for confounders and improved the ascertainment of outcomes. Our study also has limitations: it is observational in nature and therefore residual confounding cannot be excluded; recurrent AKI was identified using only diagnostic codes and had a low event rate, which reduces precision and power; we used a time-fixed exposure that may result in misclassification, although in a sensitivity analysis we reduced the misclassification and results remained robust; we were unable to identify all indications for RASi use (e.g. hypertension based on blood pressure); and we were unable to adjudicate the cause of the AKI during the index hospitalization, creating possible heterogeneity in the population. Extrapolation to other health systems, countries and periods should be done with caution, but concordance with previous studies suggests that our findings may have generalizability.
To conclude, our study of prevalent users of RASi with a guideline indication for the treatment showed that stopping RASi treatment was associated with an increased risk of death, MI and stroke, but with a similar risk of recurrent AKI. These results may inform physicians in their clinical decision-making whilst randomized clinical trials remain unavailable.
FUNDING
Research reported in this article was supported by the Swedish Research Council (#2019-01059), the Swedish Heart and Lung Foundation and the Westman Foundation. R.J.J. is supported by grants from the Minerva Scholarship Fund and the Leiden University Fund (LUF) International Study Fund (LISF). The funders of this study had no role in the study design, data collection, analysis, interpretation, writing of the report, or the decision to submit the report for publication.
DATA AVAILABILITY STATEMENT
The datasets supporting the conclusions of this article are not publicly available; however, study materials are available to other researchers for collaborative projects. Requests should be sent to the SCREAM steering committee group ([email protected]).
CONFLICT OF INTEREST STATEMENT
J.-J.C. has received consultation, advisory board membership or research funding from AstraZeneca, Viforpharma, Astellas, Bayer, Abbott and Baxter, all outside the submitted work. C.M.C. has received consultation, advisory board membership or research funding from the Ontario Ministry of Health, Sanofi, Pfizer, Leo Pharma, Astellas, Janssen, Amgen, Boehringer-Ingelheim and Baxter. The rest of authors declare no conflict of interest.


Comments