


Abstract
End-stage renal disease (ESRD) is strongly associated with cardiovascular disease (CVD) risk. Advanced glycation endproducts (AGEs) and dicarbonyls, major precursors of AGEs, may contribute to the pathophysiology of CVD in ESRD. However, detailed data on the courses of AGEs and dicarbonyls during the transition of ESRD patients to renal replacement therapy are lacking.
We quantified an extensive panel of free and protein-bound serum AGEs [N∈-(carboxymethyl)lysine (CML), N∈-(carboxyethyl)lysine (CEL), Nδ-(5-hydro-5-methyl-4-imidazolon-2-yl)ornithine (MG-H1)], serum dicarbonyls [glyoxal (GO), methylglyoxal (MGO), 3-deoxyglucosone (3-DG)] and tissue AGE accumulation [estimated by skin autofluorescence (SAF)] in a combined cross-sectional and longitudinal observational study of patients with ESRD transitioning to dialysis or kidney transplantation (KTx), prevalent dialysis patients and healthy controls. Cross-sectional comparisons were performed with linear regression analyses, and courses following renal replacement therapy were analysed with linear mixed models.
Free and protein-bound AGEs, dicarbonyls and SAF were higher in chronic kidney disease (CKD) Stage 5 non-dialysis (CKD 5-ND; n = 52) and CKD Stage 5 dialysis (CKD 5-D; n = 35) than in controls (n = 42). In addition, free AGEs, protein-bound CML, GO and SAF were even higher in CKD 5-D than in CKD5-ND. Similarly, following dialysis initiation (n = 43) free and protein-bound AGEs, and GO increased, whereas SAF remained similar. In contrast, following KTx (n = 21), free and protein-bound AGEs and dicarbonyls, but not SAF, markedly declined.
AGEs and dicarbonyls accumulate in uraemia, which is even exaggerated by dialysis initiation. In contrast, KTx markedly reduces AGEs and dicarbonyls. Given their associations with CVD risk in high-risk populations, lowering AGE and dicarbonyl levels may be valuable.
INTRODUCTION
End-stage renal disease (ESRD) is strongly associated with cardiovascular disease (CVD) risk. This risk is not entirely attenuated by renal replacement therapy [1, 2].
Advanced glycation endproducts (AGEs) and reactive dicarbonyls may be involved in the pathophysiology of CVD in ESRD [3, 4]. AGEs represent a heterogeneous family of products that are formed by the non-enzymatic reaction of proteins with reducing sugars (i.e. the classical Maillard reaction) or from dicarbonyls, including glyoxal (GO), methylglyoxal (MGO) and 3-deoxyglucosone (3-DG), which are highly reactive intermediates derived from glucose and lipid oxidation [5, 6].
AGEs may increase CVD risk through cross-linking of extracellular matrix proteins and thereby stiffening of the vessel wall, by interaction with the receptor for AGEs (RAGE) and activation of cells including endothelial dysfunction and by increasing low-grade inflammation [3, 5]. In addition, dicarbonyls may enhance AGE formation and/or have direct effects on endothelial dysfunction and induction of low-grade inflammation [7–9].
Previous research has shown higher levels of plasma AGEs [10, 11] and dicarbonyls [12] and higher skin autofluorescence (SAF) [13], a biomarker of tissue AGE accumulation [13, 14], in individuals with ESRD than in healthy controls. However, limited data are available on courses of AGEs and dicarbonyls during the transition to chronic dialysis [15] and kidney transplantation (KTx) [16–18]. In particular, the available studies examined only limited numbers of AGEs or dicarbonyls or only the protein-bound fractions of AGEs. This is important since different AGEs and dicarbonyls may reflect different metabolic and kinetic pathways and do not have comparable biological consequences in relation to CVD [9]. In addition, kidney function and renal replacement therapies may divergently affect free and protein-bound fractions of AGEs [11, 19, 20].
We quantified an extensive panel of free and protein-bound serum AGEs [i.e. N∈-(carboxymethyl)lysine (CML), N∈-(carboxyethyl)lysine (CEL), Nδ-(5-hydro-5-methyl-4-imidazolon-2-yl)ornithine (MG-H1)], serum dicarbonyls (i.e. GO, MGO and 3-DG) and tissue AGE accumulation (i.e. SAF) in individuals with ESRD transitioning to renal replacement therapy (dialysis or KTx), prevalent dialysis patients and healthy controls. First, we examined differences in serum AGEs, serum dicarbonyls and tissue AGE accumulation between chronic kidney disease (CKD) Stage 5 non-dialysis (CKD5-ND), CKD Stage 5 dialysis (CKD5-D) and controls. Secondly, we examined courses of serum AGEs, serum dicarbonyls and tissue AGE accumulation in the first year following dialysis initiation and KTx.
MATERIALS AND METHODS
Study population and design
This study consisted of a cross-sectional and a longitudinal part, and included participants from three separate observational studies that have been performed in the southern part of the Netherlands and focused on dialysis initiation [haemodialysis (HD) and peritoneal dialysis (PD)], KTx and chronic dialysis (HD and PD), respectively. The methodology of the individual studies has been published previously [21, 22] (for in- and exclusion criteria please see Supplementary methods).
Supplementary data, Figure S1 is a flowchart showing the derivation of the cross-sectional study population. For the cross-sectional part, we included baseline data of incident dialysis patients and kidney transplant recipients and data of prevalent dialysis patients. In addition, we included baseline data of healthy kidney donors and data of healthy controls, which together formed a healthy control group.
In incident dialysis patients, kidney transplant recipients and healthy kidney donors, baseline data had been collected a maximum of 4 weeks prior to the first dialysis session, a maximum of 5 days before KTx (with the exception of one patient who had been examined 5 weeks before KTx) and within 1 month before kidney donation, respectively.
The cross-sectional analyses were performed in the subpopulation with data on serum AGEs, dicarbonyls or SAF. Patients receiving nocturnal HD were excluded as previous research has shown that extended HD increases clearance of AGEs and dicarbonyls [19], while the number of participants on nocturnal HD was too low for a comparison with conventional HD. Some individuals participated in more than one study. Only data from their first study were analysed.
Supplementary data, Figure S1 is a flowchart showing the derivation of the longitudinal study population. For the longitudinal part, we included incident dialysis patients and kidney transplant recipients who had complete baseline data on serum AGEs, dicarbonyls or SAF. Participants who participated in both the study on dialysis initiation and KTx were included as both dialysis patients and kidney transplant recipients since there was no direct statistical comparison between groups.
Incident dialysis patients were followed prospectively with assessments at 1, 6 and 12 months after dialysis initiation. Kidney transplant recipients were followed prospectively with assessments at 3, 6 and 12 months post-transplantation.
Written informed consent was obtained from each patient prior to participation. The studies were approved by the Ethical Committee (NL43381.068.13, NL33129.068.10 and NL35039.068.10) and the Hospital Board of the Maastricht University Medical Center+.
Dialysis therapy modalities
Detailed information on dialysis therapy modalities (HD and PD) are provided in the Supplementary methods.
Study measurements
Serum AGEs and dicarbonyls
Serum AGEs and dicarbonyls were measured in stored frozen (−80°C) serum samples.
Serum protein-bound CML, CEL, MG-H1 and lysine, and free CML, CEL and MG-H1 were analysed as described in detail previously (described in the supplementary material of Hanssen et al. [23]). In short, for measurement of protein-bound CML, CEL, MG-H1 and lysine, 25 μL serum was mixed with 50 μL water. After addition of 200 μL sodium borohydride (100 mmol/L) dissolved in borate buffer (pH 9.2, 200 mmol/L), samples were incubated at room temperature for 2 h. Next, samples were deproteinized with 1000 μL cold (4°C) trifluoroacetic acid. After centrifugation (14 000 rpm, 4°C, 20 min), the supernatant was carefully removed. Samples were then hydrolysed by adding 500 μL 6 N HCl to the protein pellet and incubated for 20 h at 90°C. After hydrolysis, 40 μL hydrolysate and 20 μL internal standard were mixed in a reaction vial. For CML, CEL and MG-H1, this mixture was evaporated to dryness under a stream of nitrogen at 70°C and subsequently derivatized with 100 μL 1-butanol: HCl (3:1, v/v) for 90 min at 70°C. Samples were then evaporated to dryness under nitrogen and redissolved in 200 μL water. For measurement of lysine, 10 μL hydrolysate was diluted in 800 μL water. Twenty microlitres of this mixture and 20 μL internal standard were diluted in 500 μL 10 mmol/L ammonia. Derivatized CML, CEL and MG-H1 and underivatized lysine were analysed by ultra-performance liquid chromatography (UPLC) tandem mass spectrometry (MS). For measurement of free CML, CEL and MG-H1 50 µL serum were mixed with 25 µL internal standard and subsequently deproteinized with 600 μL of a mixture of methanol and acetonitrile (1:3, by volume) and centrifuged at 14 000 rpm for 20 min at room temperature. The supernatant was transferred to a reaction vial and further treated as described for the protein-bound AGEs.
Intra- and inter-assay coefficients of variation were 3.2 and 8.1% for free CML, 3.6 and 8.0% for free CEL, 3.3 and 4.2% for free MG-H1, 2.0 and 5.3% for protein-bound CML, 3.7 and 10.7% for protein-bound CEL, 5.3 and 8.7% for protein-bound MG-H1, and 2.7 and 4.5% for protein-bound lysine, respectively. All protein-bound fractions of AGEs were expressed per millimoles lysine to adjust for the amount of protein per sample [23].
Serum levels of the dicarbonyls GO, MGO and 3-DG were measured with UPLC tandem MS as well, as described previously [24]. Intra- and inter-assay coefficients of variation were 4.3 and 14.3% for GO, 2.9 and 7.3% for MGO, and 2.4 and 12.0% for 3-DG, respectively.
SAF
AGE accumulation in skin was estimated by SAF with the AGE Reader CU™ Software version 1.2.0.3, June 2010 (DiagnOptics Technologies BV, Groningen, The Netherlands). The AGE Reader CU™ is a small desk top unit that measures SAF non-invasively and thereby assesses skin AGE levels, as described previously [14]. Patients were examined in a seated position with the patients’ forearm placed on top of the AGE-reader device [25]. In HD patients, measurements took place on the contralateral side of the shunt arm. In PD patients and healthy controls, there were no restrictions with regard to the measurement arm. SAF was measured three times by the device. The mean SAF of three measurements was used for the statistical analyses.
Other laboratory parameters and clinical characteristics
In healthy controls and in participants with CKD5-ND, estimated glomerular filtration rate (eGFR) was calculated with the serum creatinine-based CKD Epidemiology Collaboration (CKD-EPI) equation (eGFRCKD-EPI) [26]. In participants with CKD5-D, residual GFR was estimated with an equation based on serum β2-microglobulin (eGFRresidual) [27]. For an overview of other laboratory measurements and clinical characteristics, please see Supplementary methods.
All participants were requested to be in a fasting state during the measurements. For practical reasons, not all patients were in a fasting state as requested, for example, individuals with diabetes. In participants on HD, study measurements and blood sampling were performed prior to one of their dialysis sessions in a protocolized way.
Statistical analyses
For the cross-sectional analyses, participants were stratified into controls, CKD5-ND (i.e. baseline data of incident dialysis patients and future kidney transplant recipients) and CKD5-D (i.e. prevalent dialysis patients including future kidney transplant recipients who were on dialysis at baseline).
Differences in levels of serum AGEs, serum dicarbonyls and SAF between CKD5-ND, CKD5-D and controls were compared with linear regression analyses. For these analyses, serum AGEs, serum dicarbonyls and SAF were natural log transformed. The regression coefficients were exponentiated to obtain the ratio of (geometric mean) biomarker levels in CKD5-ND and CKD5-D relative to controls and in CKD5-D relative to CKD5-ND. Linear regression analyses were conducted unadjusted and adjusted for age, sex and diabetes mellitus.
Longitudinal analyses were conducted stratified for incident dialysis patients and kidney transplant recipients. Courses of natural log-transformed serum AGEs, serum dicarbonyls and SAF over time following dialysis initiation and KTx were analysed with linear mixed models to account for within-person correlations between repeated measurements and missing data. The fixed effects part contained time as categorical variable (baseline served as reference), and the random effects parts included a random intercept. Regression coefficients were exponentiated to obtain the ratio of (geometric mean) biomarker levels relative to baseline levels.
We performed several additional analyses. First, we examined Spearman’s rank correlation coefficients among baseline levels of serum AGEs, serum dicarbonyls and SAF, stratified by participant group. Secondly, we repeated the cross-sectional analyses with linear mixed models that included a random intercept to take into account correlations among participants who were in the same group in the original cohorts. Thirdly, we additionally adjusted for current smoking in Model 2. Fourthly, we examined associations of eGFRCKD-EPI with baseline serum AGEs, serum dicarbonyls and SAF in controls and participants with CKD5-ND. Fifthly, we examined the role of measures of residual kidney function (i.e. eGFRresidual, β2-microglobulin and residual urine output) and dialysis vintage in the associations of dialysis with serum AGEs, serum dicarbonyls and SAF. Sixthly, we compared HD and PD in both prevalent and incident dialysis patients by adding interaction terms to the models described above.
A P < 0.050 was considered statistically significant, except for interaction analyses for which 0.100 was used as a cut-off.
Analyses were conducted in R version 3.5.1 [28] with RStudio version 1.1.456 [29] combined with the packages tidyverse, haven, nlme, ggpubr and corrplot.
RESULTS
Population characteristics—cross-sectional analyses
Forty-two controls, 52 participants with CKD5-ND and 35 participants CKD5-D were included in the cross-sectional analyses (Table 1). Participants with CKD5-ND and CKD5-D were more often men and current smoker, had higher blood pressure and more often had a history of diabetes and CVD than controls. Among participants with CKD-5D, those on PD were younger (57.3 ± 11.4 versus 61.5 ± 13.6 years), less often men (60% versus 70%) and had higher eGFRresidual [9.3 (4.7–18.8) versus 3.6 (1.9–4.4) mL/min/1.73 m2] and shorter dialysis vintage [14 (6–22) versus 27 (22–54) months] than those on HD.
Population characteristics cross-sectional analyses
| Controls | CKD5-ND | CKD5-D | |
|---|---|---|---|
| Clinical characteristics | (n = 42) | (n = 42) | (n = 35) |
| Age (years) | 57.5 ± 12.4 | 59.3 ± 13.3 | 59.7 ± 12.7 |
| Men, n (%) | 21 (50.0) | 35 (67.3) | 23 (65.7) |
| Origin of ESRD, n (%) | |||
| Nephrosclerosis | NA | 8 (15.4) | 0 (0.0) |
| Glomerulosclerosis | NA | 2 (3.9) | 0 (0.0) |
| Hypertensive nephropathy | NA | 3 (5.8) | 9 (25.7) |
| Renovascular disease | NA | 0 (0.0) | 2 (5.7) |
| Diabetic nephropathy | NA | 3 (5.8) | 7 (20.0) |
| Polycystic kidney disease | NA | 14 (26.9) | 6 (17.1) |
| Immunoglobulin A nephropathy | NA | 4 (7.7) | 1 (2.9) |
| Glomerulonephritis | NA | 4 (7.7) | 6 (17.1) |
| Nephrotic syndrome | NA | 6 (11.5) | 0 (0.0) |
| Other | NA | 7 (13.5) | 1 (2.9) |
| Unknown | NA | 1 (1.9) | 3 (8.6) |
| Current dialysis modality, n (%) | |||
| HD | NA | NA | 20 (57.1) |
| PD | NA | NA | 15 (42.9) |
| History of KTx | NA | 10 (19.2) | 6 (17.1) |
| First future treatment modality, n (%) | |||
| HD | NA | 21 (40.3) | NA |
| PD | NA | 22 (42.3) | NA |
| Preemptive KTx | NA | 9 (17.3) | NA |
| Non-preemptive KTx | NA | 0 (0) | NA |
| Dialysis vintage (months)a | NA | NA | 23 (14–39) |
| Kt/V HD (single-pool)/PD (weekly)a | NA | NA | 2.2 ± 0.1 versus 2.3 ± 0.7 |
| eGFRCKD-EPI (mL/min/1.73 m2)a | 82.0 ± 13.1 | 8.7 ± 3.1 | NA |
| eGFRresidual (mL/min/1.73 m2)a | NA | NA | 4.1 (2.3–9.3) |
| Residual urine outputa | 42 (100) | 45 (100) | 29 (82.9) |
| Residual urine output (mL/24 h)a | 1600 (1212–2289) | 2000 (1500–2338) | 1050 (250–1600) |
| Diabetes mellitus | 0 (0.0) | 7 (13.5) | 13 (37.1) |
| Cardiovascular disease | 3 (7.1) | 15 (28.8) | 11 (31.4) |
| Current smoking | 3 (7.1) | 9 (17.3) | 8 (22.9) |
| BMI (kg/m2) | 26.2 ± 4.2 | 25.1 ± 4.0 | 27.8 ± 4.6 |
| SBP (mmHg) | 140.0 ± 17.6 | 146.3 ± 21.5 | 156.5 ± 28.4 |
| DBP (mmHg) | 85.3 ± 11.1 | 83.7 ± 13.0 | 83.9 ± 11.4 |
| AGEs and dicarbonyls at baseline | |||
| CMLfree (nmol/L)a | 127.4 (91.4–168.9) | 1142.2 (774.0–1539.4) | 1754.3 (1354.2–2338.4) |
| CMLprotein-bound (nmol/mmol lysine)a | 82.4 (73.7–92.2) | 197.3 (162.7–251.2) | 271.3 (191.6–352.0) |
| CELfree (nmol/L)a | 70.8 (56.9–114.1) | 725.6 (550.1–924.4) | 1175.8 (953.9–1658.3) |
| CELprotein-bound (nmol/mmol lysine)a | 48.1 (38.0–59.3) | 58.0 (42.8–72.5) | 58.2 (52.2–68.8) |
| MG-H1free (nmol/L)a | 213.6 (135.8–316.6) | 2244.4 (1657.7–3120/8) | 3551.0 (2354.1–4989.1) |
| MG-H1protein-bound (nmol/mmol lysine)a | 35.4 (30.4–38.8) | 57.0 (47.6–69.6) | 59.9 (52.2–71.5) |
| GO (nmol/L)a | 737.5 (592.7–853.2) | 1692.5 (1291.9–2128.4) | 2320.1 (1786.6–3007.2) |
| MGO (nmol/L)a | 358.1 (334.2–394.2) | 1082.0 (847.2–1384.7) | 1197.4 (932.3–1461.2) |
| 3-DG (nmol/L)a | 1261.7 (1115.5–1382.7) | 1635.8 (1364.9–1987.7) | 1563.6 (1397.0–1893.8) |
| SAF (AU)a | 2.4 ± 0.4 | 3.3 ± 0.7 | 3.5 ± 0.7 |
Data are presented as n (%), mean ± standard deviation or median (25th percentile–75th percentile).
AU, arbitrary units; DBP, diastolic blood pressure; NA, not applicable; SBP, systolic blood pressure.
Available in (controls/CKD5-ND/CKD5-D): n = NA/NA/27 for dialysis vintage, n = NA/NA/24 for Kt/V, n = 42/45/NA for eGFRCKD-EPI, n = NA/NA/25 for eGFRresidual, n = 22/45/35 for residual urine output (dichotomous), n = 20/33/35 for residual urine output (continuous), n = 40/48/33 for serum AGEs, n = 40/44/33 for dicarbonyls and n = 42/47/27 for SAF.
AGEs and dicarbonyls in ESRD
Figure 1 shows the distributions of serum AGEs, dicarbonyls and SAF.
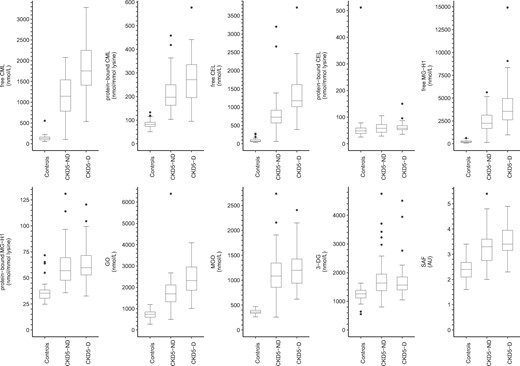
Boxplots of serum AGEs, dicarbonyls and SAF stratified according to participant group. AU, arbitrary units.
As compared with controls and after adjustment for age, sex and diabetes mellitus (Table 2), all measured serum AGEs (both free and protein-bound), dicarbonyls and SAF were higher in CKD5-ND and CKD-5D, except for protein-bound CEL. In addition, protein-bound CEL was higher in CKD5-D but not in CKD5-ND, albeit not statistically significantly.
Associations of ESRD with AGEs and dicarbonyls
| CKD5-ND versus controlsa | CKD5-D versus controlsa | CKD5-D versus CKD5-NDa | |||||
|---|---|---|---|---|---|---|---|
| Biomarker | Model | Ratio (95% CI) | P-value | Ratio (95% CI) | P-value | Ratio (95% CI) | P-value |
| CMLfree | 1 | 8.10 (6.59–9.96) | <0.001 | 13.23 (10.55–16.60) | <0.001 | 1.63 (1.31–2.03) | <0.001 |
| 2 | 7.95 (6.43–9.83) | <0.001 | 12.93 (10.04–16.67) | <0.001 | 1.63 (1.29–2.05) | <0.001 | |
| CMLprotein-bound | 1 | 2.50 (2.18–2.86) | <0.001 | 3.14 (2.71–3.64) | <0.001 | 1.26 (1.09–1.45) | 0.002 |
| 2 | 2.47 (2.15–2.83) | <0.001 | 3.05 (2.59–3.59) | <0.001 | 1.24 (1.06–1.43) | 0.006 | |
| CELfree | 1 | 8.44 (6.73–10.58) | <0.001 | 15.01 (11.71–19.25) | <0.001 | 1.78 (1.40–2.26) | <0.001 |
| 2 | 8.26 (6.55–10.41) | <0.001 | 14.66 (11.11–19.35) | <0.001 | 1.78 (1.38–2.29) | <0.001 | |
| CELprotein-bound | 1 | 1.16 (0.99–1.36) | 0.064 | 1.24 (1.04–1.50) | 0.016 | 1.07 (0.90–1.26) | 0.440 |
| 2 | 1.13 (0.96–1.32) | 0.132 | 1.18 (0.98–1.43) | 0.080 | 1.05 (0.88–1.25) | 0.588 | |
| MG-H1free | 1 | 10.20 (7.92–13.14) | <0.001 | 16.62 (12.59–21.95) | <0.001 | 1.63 (1.25–2.13) | <0.001 |
| 2 | 9.96 (7.68–12.92) | <0.001 | 16.27 (11.93–22.19) | <0.001 | 1.63 (1.23–2.17) | <0.001 | |
| MG-H1protein-bound | 1 | 1.64 (1.46–1.83) | <0.001 | 1.69 (1.50–1.92) | <0.001 | 1.03 (0.92–1.17) | 0.568 |
| 2 | 1.65 (1.46–1.85) | <0.001 | 1.71 (1.49–1.97) | <0.001 | 1.04 (0.92–1.18) | 0.519 | |
| GO | 1 | 2.39 (2.04–2.79) | <0.001 | 3.25 (2.75–3.84) | <0.001 | 1.36 (1.16–1.60) | <0.001 |
| 2 | 2.27 (1.96–2.64) | <0.001 | 2.84 (2.37–3.39) | <0.001 | 1.25 (1.06–1.47) | 0.009 | |
| MGO | 1 | 2.98 (2.61–3.40) | <0.001 | 3.35 (2.90–3.87) | <0.001 | 1.12 (0.98–1.29) | 0.102 |
| 2 | 2.92 (2.56–3.35) | <0.001 | 3.24 (2.76–3.80) | <0.001 | 1.11 (0.95–1.28) | 0.179 | |
| 3-DG | 1 | 1.42 (1.24–1.62) | <0.001 | 1.40 (1.22–1.62) | <0.001 | 0.99 (0.86–1.14) | 0.890 |
| 2 | 1.35 (1.20–1.51) | <0.001 | 1.19 (1.04–1.37) | 0.012 | 0.89 (0.78–1.01) | 0.061 | |
| SAF | 1 | 1.36 (1.25–1.48) | <0.001 | 1.46 (1.33–1.61) | <0.001 | 1.08 (0.98–1.19) | 0.117 |
| 2 | 1.34 (1.24–1.45) | <0.001 | 1.47 (1.34–1.63) | <0.001 | 1.10 (1.00–1.21) | 0.040 | |
Ratios represent the ratio of (geometric mean) levels of the biomarkers in the respective ESRD group relative to controls and relative to individuals with CKD5-ND.
Model 1: unadjusted; Model 2: adjusted for age, sex and diabetes mellitus.
Analyses based on (controls/CKD5-ND/CKD5-D): n = 40/48/33 for serum AGEs, n = 40/44/33 for dicarbonyls and n = 42/47/27 for SAF.
Population characteristics longitudinal analyses
| Incident dialysis | Kidney transplant recipients | |
|---|---|---|
| Characteristic | (n = 43) | (n = 21) |
| Clinical characteristics | ||
| Age (years) | 61.4 ± 12.1 | 54.0 ± 12.5 |
| Men, n (%) | 32 (74.4) | 10 (47.6) |
| Origin of ESRD, n (%) | ||
| Nephrosclerosis | 7 (16.3) | 1 (4.8) |
| Glomerulosclerosis | 2 (4.7) | 1 (4.8) |
| Hypertensive nephropathy | 3 (7.0) | 4 (19.0) |
| Renovascular disease | 0 (0.0) | 0 (0.0) |
| Diabetic nephropathy | 2 (4.7) | 2 (9.5) |
| Polycystic kidney disease | 12 (27.9) | 5 (23.8) |
| Immunoglobulin A nephropathy | 3 (7.0) | 3 (14.3) |
| Glomerulonephritis | 3 (7.0) | 2 (9.5) |
| Nephrotic syndrome | 5 (11.6) | 1 (4.8) |
| Other | 1 (2.3) | 0 (0.0) |
| Unknown | 5 (11.6) | 2 (9.5) |
| Treatment modality, n (%) | ||
| HD | 21 (48.8) | NA |
| PD | 22 (51.2) | NA |
| Preemptive KTx | NA | 9 (42.9) |
| Non-preemptive KTx | NA | 12 (57.1) |
| Prior dialysis modality, n (%) | ||
| None | NA | 9 (42.9) |
| HD | NA | 6 (28.6) |
| PD | NA | 6 (28.6) |
| History of KTx | 10 (23.3) | 3 (14.3) |
| eGFRCKD-EPI (mL/min/1.73 m2)a | 8.1 ± 2.8 | 8.7 ± 7 3.6 |
| Residual urine output,an (%) | 36 (100) | 21 (100) |
| Residual urine output (mL/24 h)a | 2050 (1650–2385) | 1500 (300–1850) |
| Diabetes mellitus, n (%) | 6 (14.0) | 3 (14.3) |
| Cardiovascular disease, n (%) | 15 (34.9) | 3 (14.3) |
| Current smoking, n (%) | 9 (20.9) | 1 (4.8) |
| BMI (kg/m2) | 25.7 ± 3.8 | 24.5 ± 4.5 |
| SBP (mmHg) | 147.5 ± 22.6 | 149.6 ± 24.4 |
| DBP (mmHg) | 83.7 ± 13.4 | 86.3 ± 12.4 |
| AGEs and dicarbonyls at baseline | ||
| CMLfree (nmol/L)a | 1177.9 (868.2–1541.8) | 1174.8 (639.0–1646.8) |
| CMLprotein-bound (nmol/mmol lysine)a | 203.9 (162.9–266.5) | 187.3 (162.1–305.6) |
| CELfree (nmol/L)a | 762.6 (611.4–973.1) | 905.6 (636.6–1462.6) |
| CELprotein-bound (nmol/mmol lysine)a | 58.1 (43.1–75.2) | 55.6 (42.9–67.3) |
| MG-H1free (nmol/L)a | 2292.1 (1993.7–3178.5) | 2116.8 (1663.9–4102.9) |
| MG-H1protein-bound (nmol/mmol lysine)a | 56.4 (47.7–72.9) | 57.5 (53.1–68.8) |
| GO (nmol/L)a | 1843.6 (1482.1–2253.8) | 1530.0 (1141.2–2036.0) |
| MGO (nmol/L)a | 1127.9 (887.4–1431.7) | 1074.5 (783.7–1438.0) |
| 3-DG (nmol/L)a | 1641.5 (1476.8–2086.7) | 1334.2 (1092.9–1787.1) |
| SAF (AU)a | 3.4 ± 0.7 | 3.1 ± 0.8 |
Data are presented as n (%), mean ± standard deviation or median (25th–75th percentile).
Available in (incident dialysis patients/kidney transplant recipients): n = 36/21 for eGFRCKD-EPI, n = 36/21 for residual urine output (dichotomous), n = 26/19 for residual urine output (continuous), n = 41/17 for serum AGEs, n=37/17 for dicarbonyls and n = 38/20 for SAF.
AU, arbitrary units; DBP, diastolic blood pressure; NA, not applicable; SBP, systolic blood pressure.
As compared with CKD5-ND and after adjustment for age, sex and diabetes mellitus (Table 2), free CML, protein-bound CML, free CEL, free MG-H1 and GO were higher in CKD5-D. In addition, 3-DG was lower (but not statistically significantly) and SAF was higher in CKD5-D, but only after adjustment for diabetes mellitus. Furthermore, protein-bound CEL, protein-bound MG-H1 and MGO were similar.
Population characteristics—longitudinal analyses
Forty-three participants with CKD5-ND who initiated dialysis (21 HD, 22 PD), 9 participants with CKD5-ND who received a kidney transplant and 8 participants with CKD5-D who received a kidney transplant were included in the longitudinal analyses. Four participants who, firstly, initiated dialysis and later received a kidney transplant were also included as kidney transplant recipients (Table 3 andSupplementary data, flowchart in Figure S1).
Courses of AGEs and dicarbonyls following dialysis initiation and KTx
| Ratios of biomarker levels following dialysis initiation relative to baseline levelsa | ||||||
|---|---|---|---|---|---|---|
| 1 month versus baseline | 6 months versus baseline | 12 months versus baseline | ||||
| Biomarkers | Ratio (95% CI) | P-value | Ratio (95% CI) | P-value | Ratio (95% CI) | P-value |
| CMLfree (nmol/L) | 0.88 (0.74–1.04) | 0.120 | 1.13 (0.96–1.34) | 0.142 | 1.19 (1.00–1.42) | 0.048 |
| CMLprotein-bound (nmol/mmol lysine) | 0.92 (0.85–1.01) | 0.070 | 1.18 (1.08–1.28) | <0.001 | 1.24 (1.14–1.36) | <0.001 |
| CELfree (nmol/L) | 0.86 (0.71–1.04) | 0.117 | 1.08 (0.89–1.31) | 0.411 | 1.13 (0.92–1.38) | 0.242 |
| CELprotein-bound (nmol/mmol lysine) | 1.04 (0.93–1.16) | 0.494 | 1.11 (1.00–1.24) | 0.055 | 1.11 (0.99–1.24) | 0.070 |
| MG-H1free (nmol/L) | 0.94 (0.76–1.16) | 0.560 | 1.15 (0.93–1.42) | 0.196 | 1.21 (0.97–1.50) | 0.089 |
| MG-H1protein-bound (nmol/mmol lysine) | 0.95 (0.88–1.02) | 0.173 | 1.04 (0.96–1.12) | 0.374 | 1.07 (0.99–1.16) | 0.098 |
| GO (nmol/L) | 0.87 (0.76–1.00) | 0.043 | 1.22 (1.06–1.40) | 0.005 | 1.24 (1.08–1.43) | 0.003 |
| MGO (nmol/L) | 0.83 (0.73–0.94) | 0.003 | 1.02 (0.90–1.16) | 0.720 | 1.07 (0.94–1.22) | 0.285 |
| 3-DG (nmol/L) | 0.95 (0.86–1.04) | 0.246 | 0.95 (0.87–1.05) | 0.307 | 0.89 (0.81–0.98) | 0.018 |
| SAF (AU) | 0.99 (0.93–1.04) | 0.629 | 0.98 (0.93–1.04) | 0.512 | 0.97 (0.92–1.03) | 0.276 |
Ratios of biomarker levels following KTx relative to baseline levelsb | ||||||
3 months versus baseline | 6 months versus baseline | 12 months versus baseline | ||||
| Biomarkers | Ratio (95% CI) | P-value | Ratio (95% CI) | P-value | Ratio (95% CI) | P-value |
| CMLfree (nmol/L) | 0.26 (0.20–0.34) | <0.001 | 0.21 (0.17–0.28) | <0.001 | 0.23 (0.17–0.29) | <0.001 |
| CMLprotein-bound (nmol/mmol lysine) | 0.50 (0.42–0.60) | <0.001 | 0.45 (0.38–0.53) | <0.001 | 0.40 (0.34–0.47) | <0.001 |
| CELfree (nmol/L) | 0.33 (0.24–0.46) | <0.001 | 0.22 (0.16–0.30) | <0.001 | 0.23 (0.17–0.32) | <0.001 |
| CELprotein-bound (nmol/mmol lysine) | 0.76 (0.61–0.94) | 0.012 | 0.77 (0.62–0.95) | 0.0143 | 0.77 (0.62–0.95) | 0.016 |
| MG-H1free (nmol/L) | 0.26 (0.18–0.39) | <0.001 | 0.18 (0.12–0.26) | <0.001 | 0.17 (0.12–0.25) | <0.001 |
| MG-H1protein-bound (nmol/mmol lysine) | 0.65 (0.59–0.72) | <0.001 | 0.69 (0.62–0.76) | <0.001 | 0.65 (0.59–0.72) | <0.001 |
| GO (nmol/L) | 0.48 (0.36–0.63) | <0.001 | 0.44 (0.34–0.57) | <0.001 | 0.51 (0.39–0.66) | <0.001 |
| MGO (nmol/L) | 0.40 (0.33–0.49) | <0.001 | 0.39 (0.32–0.47) | <0.001 | 0.43 (0.36–0.52) | <0.001 |
| 3-DG (nmol/L) | 1.03 (0.90–1.17) | 0.705 | 0.99 (0.87–1.12) | 0.820 | 0.89 (0.78–1.02) | 0.085 |
| SAF (AU) | 0.96 (0.87–1.06) | 0.414 | 0.94 (0.86–1.04) | 0.254 | 0.94 (0.85–1.03) | 0.174 |
Ratios represent the ratio of (geometric mean) levels of the biomarkers at the respective time point after dialysis initiation or KTx relative to baseline levels based on a linear mixed model containing categorical time and a random intercept.
Analyses based on (baseline/1/6/12 months): n = 41/41/40/35 for serum AGEs, n = 37/41/40/35 for dicarbonyls and n = 38/37/40/34 for SAF, respectively.
Analyses based on (baseline/3/6/12 months): n = 17/16/18/17 for serum AGEs, n = 17/16/18/17 for dicarbonyls and n = 20/16/16/17 for SAF, respectively.
AU, arbitrary units; NA, not applicable.
Incident dialysis patients were older, more often men and more often had a history of CVD than kidney transplant recipients. Baseline eGFRCKD-EPI was similar and all participants had residual urine output. Among incident dialysis patients, those on PD were younger (59.0 ± 12.2 versus 63.8 ± 11.8 years) and less often men (68.2% versus 81.0%) and had higher baseline eGFRCKD-EPI (8.7 ± 2.9 versus 7.6 ± 2.6 mL/min/1.73 m2), lower residual urine output [1812 (1500–2246) versus 2100 (1700–2400) mL/24 h] and lower body mass index (BMI) (24.5 ± 3.4 versus 27.0 ± 3.7 kg/m2), than those on HD.
Residual kidney function decreased over time in incident dialysis patients (HD more than PD) (Supplementary data, Table S1), whereas kidney function markedly improved in kidney transplant recipients (Supplementary data, Table S1). Importantly, a transient decrease in serum creatinine at 1 month after dialysis initiation was not paralleled by changes in β2-microglobulin or body weight (Supplementary data, Tables S1 and S2).
AGEs and dicarbonyls after dialysis initiation
Figure 2 shows the distributions of serum AGEs, dicarbonyls and SAF in incident dialysis patients from baseline up to 12 months after dialysis initiation.
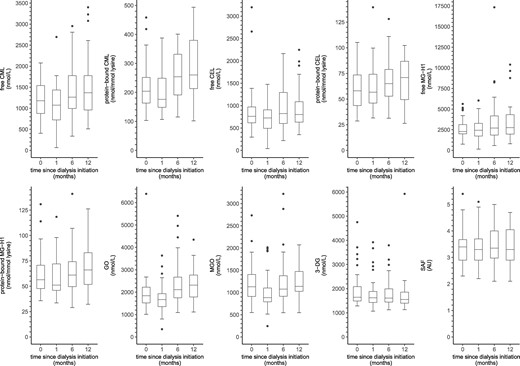
Boxplots of serum AGEs, dicarbonyls and SAF over time in incident dialysis patients. Boxplots based on (0/1/6/12 months): n = 41/41/40/35 for serum AGEs, n = 37/41/40/35 for dicarbonyls and n = 38/37/40/34 for SAF, respectively. AU, arbitrary units.
In linear mixed model analyses (Table 4), incident dialysis patients showed an increase in free CML, protein-bound CML and GO over time (∼20–25% increase after 12 months). In addition, levels of protein-bound CEL, free MG-H1 and protein-bound MG-H1 were higher after 12 months of follow-up, albeit not statistically significantly (∼5–20% increase after 12 months).
In contrast, MGO was lower at 1 month after dialysis initiation, but returned to baseline levels during further follow-up. In addition, 3-DG was lower at 12 months after dialysis initiation. Furthermore, there was no statistically significant change in free CEL and SAF from baseline during the first 12 months since dialysis initiation.
AGEs and dicarbonyls after KTx
Figure 3 shows the distributions of serum AGEs, dicarbonyls and SAF in kidney transplant recipients from baseline up to 12 months post-transplantation.
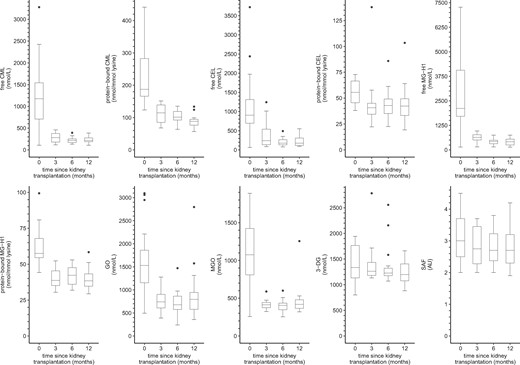
Boxplots of serum AGEs, dicarbonyls and SAF over time in kidney transplant recipients. Boxplots based on (0/3/6/12 months): n = 17/16/18/17 for serum AGEs, n = 17/16/18/17 for dicarbonyls and n = 20/16/16/17 for SAF, respectively. AU, arbitrary units.
In linear mixed model analyses (Table 4), kidney transplant recipients showed a marked reduction in free CML, protein-bound CML, free CEL, protein-bound CEL, free MG-H1, protein-bound MG-H1, GO and MGO at 3 months post-transplantation, which was still present after 12 months of follow-up (∼25–75% decrease after 12 months). In addition, 3-DG was lower after 12 months of follow-up, albeit not statistically significantly. Furthermore, there was no statistically significant change in SAF from baseline during the first 12 months since transplantation.
Additional analyses
First, Supplementary data, Figure S2 is a correlation matrix of baseline levels of AGEs and dicarbonyls stratified by participant group.
Secondly, linear mixed models that took into account the cohort of origin provided similar results as the ordinary linear regression models (Supplementary data, Table S2). However, non-converge or wide 95% confidence intervals (CIs) for some AGEs indicated that these models were over-parameterized.
Thirdly, associations of CKD5-ND and CKD5-D with AGEs and dicarbonyls were similar after additional adjustment for current smoking (Supplementary data, Table S4).
Fourthly, in CKD5-ND, but not in controls, lower eGFRCKD-EPI was associated with higher levels of free and protein-bound serum AGEs and dicarbonyls (Supplementary data, Table S5).
Fifthly, in CKD5-D, lower eGFRresidual, lower residual urine output and longer dialysis vintage were associated with higher levels of serum AGEs and/or serum dicarbonyls (Supplementary data, Tables S6–S8). In addition, lower eGFRresidual was associated with lower SAF (Supplementary data, Table S6). Results were similar when residual kidney function was expressed by serum β2-microglobulin (data not shown). In addition, adjustment for eGFRresidual or β2-microglobulin in the linear mixed model analyses explained the increase of serum AGEs and GO over time (data not shown).
Sixthly, prevalent PD patients had lower levels of free serum AGEs than HD patients (Supplementary data, Table S9). These differences were attenuated by ∼30–50% and no longer statistically significant after additional adjustment for eGFRresidual (data not shown).
Seventhly, in incident dialysis patients, levels of free and protein-bound serum AGEs and GO increased in HD but remained relatively stable in PD (Supplementary data, Figure S3 and Table S10; adjusted for age, sex and diabetes mellitus; Pinteraction between time and dialysis modality <0.100). Adjustment for eGFRresidual (partially) attenuated changes over time in some of the serum AGEs and GO in HD while showing improvement in levels of serum AGEs in PD. This was even more pronounced after adjustment for β2-microglobulin instead of eGFRresidual (Supplementary data, Tables S11 and S12).
DISCUSSION
This study on AGEs and dicarbonyls during the transition of individuals with ESRD to renal replacement therapy had three main findings. First, levels of serum AGEs (both free and protein-bound), serum dicarbonyls and SAF were higher in participants with CKD5-ND and CKD5-D than in healthy controls. Secondly, levels of free AGEs, protein-bound CML, GO and SAF were higher in CKD5-D than in CKD5-ND. Similarly, following dialysis initiation levels of free and protein-bound AGEs and GO (somewhat) increased (∼5–25% after 12 months; albeit not all statistically significant), whereas SAF remained similar. Thirdly, following KTx levels of serum AGEs (both free and protein-bound fractions) and dicarbonyls, but not SAF, markedly declined (∼25–75% after 12 months).
The increases in free and protein-bound serum AGEs, serum dicarbonyls and SAF in CKD5-ND agree with studies in untreated ESRD and earlier CKD stages that examined only the free fraction of plasma AGEs and dicarbonyls [20], examined CML [30] or pentosidine [31] with a technique that does not distinguish between free and protein-bound fractions, or only examined SAF [32].
Reduced (renal) elimination and/or increased production may explain accumulation of AGEs and dicarbonyls in ESRD [7]. This may include reduced detoxification of dicarbonyls by downregulation of metabolic enzymes with subsequent AGE formation [7].
The transient improvement in some AGEs and dicarbonyls may reflect positive effects of dialysis initiation on their clearance. Indeed, an acute but transient improvement of plasma-free AGEs and dicarbonyls has been reported after a single dialysis session [10, 12, 19, 20, 33]. In addition, this finding could represent (transient) changes in dietary habits, which is a source of AGEs and dicarbonyls [34, 35]. The latter may be somewhat supported by a similarly transient decrease in serum creatinine, although nutritional data are not available for this study.
However, the cross-sectional comparison of CKD5-D with CKD5-ND and the results in incident dialysis patients suggested a negative long-term effect of dialysis marked by accumulation of AGEs and dicarbonyls. Indeed, dialysis may stimulate AGE accumulation, for example, due to systemic absorption of dicarbonyls from PD fluids [15], the oxidative burst and low-grade inflammation related to bio-incompatibility of dialysis membranes and dialysis fluid impurity [36, 37], and loss of residual kidney function resulting from repetitive intradialytic hypotension and dehydration [38]. In this regard, additional analyses and previous studies stress the relevance of preserving residual kidney function to keep serum AGEs and dicarbonyls low in dialysis patients [15, 31, 39].
Nevertheless, the clinical relevance of the observed increases in AGEs and dicarbonyls following dialysis initiation deserves further study.
Additional analyses suggested that in particular, HD had negative long-term effects on accumulation of serum AGEs. This agrees with the previously reported higher levels of free AGEs in HD than in PD [16, 20]. However, in this study, the loss of residual kidney function paralleled increases in serum AGEs and serum dicarbonyls. Indeed, among both prevalent and incident dialysis patients, differences between HD and PD were related to measures of residual kidney function. In this regard, although absolute values of eGFRresidual in incident dialysis patients were higher than expected (e.g. relative to baseline eGFRCKD-EPI), a stronger decline in HD than in PD is consistent with literature [38].
KTx led to a reduction in all serum AGEs and dicarbonyls. This extends results of studies that examined a more limited panel of AGEs [16–18]. After 12 months of follow-up, protein-bound AGEs and 3-DG even returned to the levels observed in controls, in contrast to free AGEs, GO and MGO, which remained numerically higher. This finding fits the stronger association of kidney function with free AGEs than with protein-bound AGEs [20, 40] as GFR does not completely normalize after KTx [41]. Apart from improved renal clearance, it may be speculated that improvement of the uraemic milieu reduces AGE production through, for example, improved enzymatic detoxification of dicarbonyls.
The relatively short follow-up time may explain the absence of a reduction in SAF as extracellular matrix proteins are long-lived proteins [42]. Indeed, a cross-sectional study showed lower SAF in kidney transplant recipients with an average transplant age of almost 8 years than dialysis patients, although analyses were not adjusted for age [43].
Key strengths of this study are the assessment of an extensive panel of AGEs, both as their free and protein-bound forms, and dicarbonyls with state-of-the-art techniques and the combination of studies on incident and prevalent patients on renal replacement therapy. Thereby, this study provided unique detailed information on the course of AGEs and dicarbonyls during the transition of ESRD patients to renal replacement therapy.
This study also had some limitations. First, sample sizes per patient group were small, in particular for the group of kidney transplant recipients and for the subgroups in the additional analyses. This limited study power. Secondly, participants with CKD5-ND were not randomized between KTx and dialysis. Therefore, possible differences in eligibility may have led to selection bias. Together with differences in the timing of follow-up assessments, this hampers a direct comparison between both renal replacement therapies. Thirdly, data on pentosidine would have facilitated the comparison with previous studies, which are for a large part based on pentosidine, and may have shed more light on the correlation of SAF with serum AGEs in this population as it is both a cross-linker of extracellular matrix proteins and a fluorophore. Nevertheless, with regard to the former, differences in AGEs between ESRD patients and controls, and changes in AGEs following renal replacement therapy were in the same direction as previous studies. Fourthly, the distribution of causes of ESRD, with varying prognosis, in this study may hamper generalizability. For example, the prevalence of polycystic kidney disease among participants with CKD5-ND and CKD5-D was high, whereas that of diabetic nephropathy was low.
In conclusion, CKD5-ND was associated with accumulation of free and protein-bound serum AGEs, serum dicarbonyls and tissue AGEs. In addition, higher levels of free and protein-bound AGEs and GO in participants with CKD5-D than in those with CKD5-ND and an increase in these biomarkers following dialysis initiation suggested that dialysis may stimulate accumulation of AGEs and dicarbonyls on top of uraemia per se. In contrast, serum AGEs and dicarbonyls markedly improved following KTx. Associations of the measured AGEs and dicarbonyls with CVD in other high-risk populations [44–46] suggest that AGEs and dicarbonyls may contribute to the high CVD risk in ESRD and that lowering these levels could be clinically relevant. In this regard, this study highlights the crucial role of preserving residual kidney function [47] to contain circulating levels of AGEs and dicarbonyls in dialysis patients.
ACKNOWLEDGEMENTS
We kindly acknowledge Nanda M.P. Diederen for her contribution to the data acquisition.
FUNDING
The studies included in this article were supported by an unrestricted grant from Fresenius Medical Care Deutschland GmbH (study NL33129.068.10 and NL43381.068.13), a Baxter extramural grant (study NL35039.068.10) and the Dutch Kidney Foundation (study NL35039.068.10).
AUTHORS’ CONTRIBUTIONS
R.J.H.M., N.J.H.B., M.H.L.C. and J.P.K. designed this study; N.J.H.B. collected the data; C.G.S. and J.L.J.M.S. conducted the measurements of serum AGEs and dicarbonyls; R.J.H.M., N.J.H.B., J.P.K. and C.G.S. formulated the research questions; R.J.H.M. analysed the data; R.J.H.M. drafted and revised the manuscript; N.J.H.B., B.C., M.H.L.C., T.C., A.G., M.M.H.H., C.J.A.M.K., F.M.vd.S., J.L.J.M.S., F.S., J.P.K. and C.G.S. reviewed the manuscript. All authors approved the final version of the manuscript.
CONFLICT OF INTEREST STATEMENT
R.J.H.M., N.J.H.B. and J.P.K. are supported by an (un)restricted grant from Fresenius Medical Care. R.J.H.M., N.J.H.B. and J.P.K. received lectures fees from Fresenius Medical Care. B.C. and A.G. are employees of Fresenius Medical Care and hold shares in the company. The other authors report no financial conflicts of interest. B.C. and A.G., who are employees of Fresenius Medical Care and hold shares in the company, reviewed the manuscript. However, the funding sources had no role in this study design, collection, preparation or analysis of data and the decision to publish. The results presented in this article have not been published previously in whole or part, except in abstract format.
REFERENCES
DiagnOptics Technologies BV Groningen The Netherlands. AGE reader CU user manual—instructions for use—version 1.2. Groningen, the Netherlands: DiagnOptics Technologies BV
R Core Team.
RStudio Team.


Comments