


Abstract
Non-invasive cardiovascular disease (CVD) risk prediction, in subclinical stages, aiming to stratify patients and tailor interventions remains an unmet need in chronic kidney disease (CKD). In this meta-analysis, we summarize the association of carotid intima–media thickness (cIMT), coronary artery calcium score (CACS) and pulse wave velocity (PWV) with all-cause mortality, cardiovascular (CV) mortality and CV events in non-dialysis CKD and patients on haemodialysis.
Systematic review and meta-analysis of prospective cohort studies.
Out of 27 984 records, a total of 45 studies were eligible for quantitative synthesis; 11 for cIMT, 18 for CACS and 16 for PWV involving 2235, 4904 and 5717 patients, respectively. Meta-analysis was possible from pooled data of five cIMT studies (708 subjects), eight CACS studies (862 subjects) and nine PWV studies (1508 subjects). In dialysis patients, cIMT was associated with all-cause mortality [relative risk (RR) per unit increase: 1.08, 95% confidence interval (CI) 1.00–1.17, I2: 68%] and CV mortality (RR: 1.29, 95% CI 1.14–1.47, I2: 0%). High versus low CACS was associated with all-cause mortality (RR: 2.51, 95% CI 1.66–3.79, I2: 5.7%) and CV events (RR: 3.77 95% CI 2.16–6.58, I2: 20.2%). High versus low PWV was associated with all-cause (RR: 5.34, 95% CI 3.01–9.47, I2: 0%) and CV mortality (RR: 8.55, 95% CI 4.37–16.73, I2: 0%). The combined estimated for all-cause mortality per 1 m/s increment unit in PWV was 1.25 (95% CI 1.17–1.34, I2: 0%) and for CV mortality was 1.24 (95% CI 1.16–1.34, I2: 15.5%). In non-dialysis patients, CACS was associated with CV events (RR: 4.02, 95% CI 1.57–10.29, I2: 63.4%). High versus low PWV was associated with all-cause mortality (RR: 2.52, 95% CI 1.40–4.55, I2: 62.6%).
Non-invasive measures of atherosclerosis and arterial stiffening are associated with all-cause and CV mortality as well as CV events among patients with all stages of CKD. These markers could be considered for the evaluation of CV morbidity and mortality risks. Moreover, the results of this meta-analysis support the study of interventions, with effect on these markers of vascular disease, on long-term CVD outcomes.
INTRODUCTION
Chronic kidney disease (CKD) is a major public health problem with a growing worldwide incidence [1, 2]. Patients with CKD have increased burden of cardiovascular disease (CVD) and their risk of dying from a cardiovascular (CV) event is greater than reaching end-stage renal disease (ESRD) [3]. In patients who progress to ESRD, CV mortality accounts for up to 50% of deaths [4]. Uniform and non-invasive CVD risk prediction at the early subclinical stages aiming to stratify patients and tailor interventions to mitigate this risk remains an unmet need in CKD.
The two distinct vascular changes occurring in CKD are arteriosclerosis, characterized by arterial stiffening with loss of the arterial cushioning effect, and atherosclerosis, which is characterized by intima thickening and loss of conduit function [5]. Atherosclerosis, as an intimal process, can be detected non-invasively with the use of ultrasound by measuring intima–media thickness (IMT) and atherosclerotic plaques. The stiffening and large-vessel remodelling of arteriosclerosis is accelerated by the mineral–bone disturbance of CKD and can be detected through measurements of pulse wave velocity (PWV). Atherosclerosis and arteriosclerosis cause calcification in different vascular layers. Coronary artery calcium score (CACS), as measured through non-contrast computed tomography (CT), is especially relevant in this patient group presenting with disturbed bone–mineral metabolism. These distinct but coexisting pathogenic vascular processes could explain why CVD prediction based on traditional risk factors, such as the Framingham score, underperform in CKD [6].
Importantly, modifying these traditional factors is not adequate in CKD to improve mortality. This was exemplified by the Study of Heart and Renal Protection (SHARP) in which the reduction of low-density lipoprotein and cholesterol levels did not improve overall survival, despite reducing atherothrombotic events [7]. In the general population, recent meta-analyses support the predictive roles for IMT, CACS and PWV [8–11], however, systematic information on the predictive value of these measurements, either individually or especially in comparison in CKD and ESRD, is missing. Nonetheless, early detection of atherosclerosis, arterial stiffness and coronary calcification in CKD and ESRD in their asymptomatic or subclinical phase may improve CVD risk prediction and guide clinicians on more targeted interventions to improve CV mortality in all CKD stages.
The aims of this systematic review and meta-analysis are (i) to provide robust quantitative estimates on the association between carotid IMT (cIMT), CACS and PWV in CKD and ESRD with CVD and all-cause mortality and (ii) to provide a combined report of the three methods in different CKD stages (dialysis versus non-dialysis).
MATERIALS AND METHODS
Search strategy
This study was performed according to the Preferred Reporting Items for Systematic Reviews and Meta-Analyses (PRISMA) guidelines [12]. In three separate literature searches (Supplementary data, Figure S1 and Table S1), the electronic databases PubMed and Google Scholar were searched from inception until December 2018 using custom designed search algorithms consisting of Medical Subject Headings (MeSH) terms, relevant short terms and combinations of terms either in the title or abstract. For each literature review, two reviewers (for cIMT: P.K. and A.G.P., for CACS: P.K. and A.Kanari and for PWV: A.Kousios and A.G.P.) independently evaluated the title and abstract of the obtained electronic search results and final selection was based on full-text evaluation. Disagreements were resolved with consensus. Reference lists of selected studies were further searched for additional eligible studies. The study is registered with the International Prospective Register of Systematic Reviews (PROSPERO, www.crd.york.ac.uk/prospero/CRD42018105909).
Study selection
Studies were considered eligible if they described the association between cIMT, CACS or PWV with all-cause mortality, CV mortality or CV events in the form of hazard ratio (HR) or relative risk (RR). Selected studies were restricted to studies of prospective cohorts of CKD patients. Studies including a patient population of transplanted CKD patients, studies with CKD patients as a subset of a more general population and studies with combined outcomes (such as combinations of CV events and CV mortality or CV events and all-cause mortality) were excluded from meta-analysis. Quality characteristics of the included studies were addressed descriptively using the methodological index for non-randomized studies (MINORS) published criteria for observational studies to allow for the identification of any low-quality evidence [13].
Quantitative synthesis and statistical analysis
The risk estimates from each study were reported as HR or RR. For the purposes of the quantitative synthesis, we treated HR as RR and patients were allocated to high or low comparison groups based on the cut-offs provided by each study, as no uniform cut-off values are available for cIMT, CACS or PWV. When available, adjusted estimates from multivariate models were used in the analysis. Based on the way of reporting for most of the studies in the literature, it was decided that for cIMT, only studies reporting RR from continuous analysis (per unit change in cIMT) would be used in the quantitative meta-analysis, while for CACS, only studies reporting RR from cut-off analysis would be used. In the case of PWV, quantitative meta-analysis was repeated for studies reporting RR from continuous analysis (per unit change in PWV) and separately for studies reporting RR from cut-off analysis, as enough studies were identified to carry out both types of quantitative synthesis.
Pooled estimates were calculated with a random effects model (DerSimonian–Laird method) to account for both within and between study variability. Separate pooled estimates were calculated for each type of outcome (all-cause mortality, CV mortality and CV events) and separately for cIMT, CACS or PWV. Heterogeneity between synthesized studies was calculated using the I2 statistic and the presence of publication bias was investigated graphically by precision funnel plots. To assess the association between cIMT, CACS or PWV and outcomes in clearly defined groups of kidney disease patients, the analysis was carried separately for studies that recruited only haemodialysis (HD) patients or only non-HD patients. All statistical analyses were performed using STATA (Version 12, StataCorp, College Station, TX, USA) [14].
RESULTS
Literature search
Results from the literature search for cIMT, CACS and PWV are shown in Supplementary data, Figures S2–S4, respectively. Briefly, for cIMT, a total of 8659 records were identified, with 51 undergoing full assessment. After full review, 19 remained for qualitative and 11 for quantitative synthesis (Supplementary data, Figure S2). For CACS, a total of 10 957 records were retrieved for preliminary review. Of those, 93 were identified for full review, after which 63 were excluded and 30 remained for qualitative and 18 for quantitative synthesis (Supplementary data, Figure S3). For PWV, a total of 8368 records were identified for preliminary review; of those 132 were identified for full review and 33 remained for qualitative and 14 for quantitative synthesis (Supplementary data, Figure S4). For cIMT, CACS and PWV, the basic characteristics of studies that were excluded at the last step prior to quantitative synthesis, as well as the main reason for their exclusion, are presented separately in Supplementary data, Tables S2–S4, respectively.
Study characteristics
The quantitative synthesis for cIMT included 11 original articles on the relationship between cIMT and all-cause mortality, CV mortality and CV events [15–25]. In total, the included studies analysed 2235 subjects with a mean follow-up of 46 months. Details of the included studies are shown in Table 1. Of the 11 studies, 7 reported RR for continuous measurements of cIMT, with 5 reporting results for all-cause mortality (708 subjects), 2 for CV mortality (357 subjects) and 2 for CV events (340 subjects).
Study characteristics for studies examining the relationship between cIMT and mortality/morbidity outcomes
| Study | Sample size | Age (years)† | Female (%) | CKD stage* | DM (%) | CVD (%) | IMT (μm) | Outcome | Comparison | Effect estimate (95% CI) | Follow-up duration (months) |
|---|---|---|---|---|---|---|---|---|---|---|---|
| He et al. [15] | 128 | 56 | 54 | Hemodialysis | 13.3 | NA | NA | All-cause mortality |
|
| 24 |
| Hinderliter et al. [16] | 198 | 61 | 47 | Non-hemodialysis | 26 | 42 | 1210 | CV events (cardiac death, myocardial infarction, coronary revascularization, stroke, heart failure and peripheral vascular disease) |
|
| 29 |
| Yu et al. [17] | 145 | 55 | 45.5 | Hemodialysis | 11 | 13.7 | NA |
|
|
| 73 |
| Karras et al. [18] | 439 | 60 | 26 | CKD Stage 3–5, not on dialysis | 27 | 28 | NA |
|
|
| NA |
| Nakayama et al. [19] | 133 | NA | 42 | Hemodialysis | 43 | 39 | NA |
|
|
| 49 |
| Papagianni et al. [20] | 112 | 59 | 46.4 | Hemodialysis | NA | 34.8 | NA |
|
|
| 46 |
| Zoungas et al. [25] | 207 | 57 | 32 | General CKD | NA | 72 | NA |
|
|
| 60 |
| London et al. [21] | 78 | 54 | 30.7 | Hemodialysis | 8.9 | 0 | 800 ± 98 | All-cause mortality |
|
| 60 |
| Kato et al. [22] | 219 | 58 | 34.2 | Hemodialysis | 16 | NA | NA |
|
|
| 60 |
| Nishizawa et al. [23] | 438 | 60 | 40 | Hemodialysis | 30 | NA | 980 ± 430 | CV mortality |
|
| 30 |
| Benedetto et al. [24] | 138 | 60 | 41 | Hemodialysis | 14 | 57 | NA |
|
|
| 30 |
DM, diabetes mellitus.
The quantitative assessment for CACS included 18 original articles assessing the relationship between CACS and all-cause mortality, CV mortality and CV events [19, 26–42]. In total, the included studies analysed 4904 subjects with a mean follow-up of 52 months. Details of the individual studies are shown in Table 2. Sixteen out of the 18 studies reported RR for cut-off values of CACS and 11 of these reported results on all-cause mortality (2904 subjects) and CV events (3706 subjects) and 1 on CV mortality (74 subjects).
Study characteristics for studies examining the relationship between CACS and mortality/morbidity outcomes
| Study | Sample size | Age (years)† | Female (%) | CKD stage* | DM (%) | CVD (%) | CACS (AU) | Outcome | Comparison | Effect estimate (95% CI) | Follow-up duration (months) |
|---|---|---|---|---|---|---|---|---|---|---|---|
| Lamarche et al. [42] | 178 | 61 | 38 | Non-hemodialysis | 44 | 18 | 217 (9–746) | All-cause mortality |
|
| 120 |
| Mukai et al. [41] | 296 | 55 | 33 | General CKD | 19 | NA |
| All-cause mortality |
|
| 35 |
| Chen et al. [26] | 1541 | 57.2 | 47 | Mild to moderate CKD | 42 | 0 | NA |
|
|
| 71 |
| Winther et al. [27] | 154 | 54 | 32 | Hemodialysis | 32.5 | 15.6 | 137 (0–561) |
|
|
| 44 |
| Matsushita et al. [28] | 1284 | 69 | 54 | General CKD | 23 | NA | 31 (0–224) |
| Quartiles |
| 100 |
| Havel et al. [29] | 77 | 59.5 | 31 | Hemodialysis | 45.5 | 7.80 | 886 ± 1324 | CV events (cardiac death, myocardial infarction and coronary revascularization) |
|
| 26 |
| Chaikriangkrai et al. [30] | 145 | NA | NA | Non-hemodialysis | NA | NA | NA |
|
|
| 43 |
| Liabeuf et al. [31] | 143 | 66.7 | 39 | General CKD | 43 | 31 | NA | CV events (cardiac death, stroke, angina pectoris, myocardial infarction, congestive cardiac failure, peripheral ischemia or new-onset arrhythmia) |
|
| 29 |
| Janda et al. [32] | 53 | 52 | 47 | Hemodialysis | 23 | 0 | 92 |
|
|
| 72 |
| Guney et al. [33] | 72 | 44 | 54 | Hemodialysis | NA | NA | 127 (0–657) | All-cause mortality |
|
| 77 |
| Nakayama et al. [19] | 133 | NA | 42 | Hemodialysis | 43 | 39 | NA |
|
|
| 49 |
| Russo et al. [40] | 181 | NA | NA | Non-hemodialysis | NA | NA | 107 |
|
|
| 25 |
| Ohtake et al. [34] | 74 | 66 | 36 | Hemodialysis | 39.6 | NA | 1853 ± 3262 |
|
|
| 40 |
| Shantouf et al. [35] | 166 | 53 | 41 | Hemodialysis | 50.9 | 24.7 | NA | All-cause mortality |
|
| 72 |
| Watanabe et al. [36] | 117 | 57 | 39 | Non-hemodialysis | 23 | NA |
|
|
|
| 24 |
| Fensterseifer et al. [37] | 59 | 48.8 | 41 | Hemodialysis | 28. | 23.7 |
| All-cause mortality |
|
| 24 |
| Block et al. [38] | 127 | 56 | 39 | Hemodialysis | 58 | NA | NA | All-cause mortality |
|
| 44 |
| Matsuoka et al. [39] | 104 | 56 | 40 | Hemodialysis | 38 | NA | NA | All-cause mortality |
|
| 44 |
DM, diabetes mellitus; STEMI, ST segment elevation myocardial infarction.
The quantitative synthesis for PWV included 14 original studies on the relationship between PWV and all-cause mortality, CV mortality and CV events [15, 18, 25, 43–53]. In total, the included studies analysed 5184 subjects with a mean follow-up of 43 months. Details of the included studies are shown in Table 3. Of the 14 studies, 9 reported RR for a cut-off value of PWV, while 7 studies reported RR per 1 m/s increment unit in PWV. Nine studies reported results for all-cause mortality (4463 subjects), eight for CV mortality (1380 subjects) and four for CV events (965 subjects).
Study characteristics for studies examining the relationship between PWV and mortality/morbidity outcomes
| Study | Sample size | Age (years) | Female (%) | CKD Stage* | DM (%) | CVD (%) | PWV (m/s) | Outcome | Comparison | Effect estimate (95% CI) | Follow-up duration (months) |
|---|---|---|---|---|---|---|---|---|---|---|---|
| Dimkovic et al. [53] | 220 | 58.9 | 46 | Hemodialysis | 11.8 | 20 | 9.68 ± 2.12 | CV mortality |
|
| 76 |
| Premuzic et al. [51] | 96 | 66 | 50 | Hemodialysis | NA | NA | 10.5 ± 1.9 | CV mortality |
|
| 25 |
| Nemcsik et al. [50] | 100 | 66 | 52 | Non-hemodialysis | 44 | 64 |
|
|
|
| NA |
| Townsend et al. [52] | 2795 | 59.9 | 43.6 | Non-hemodialysis | 47.3 | NA | NA | All-cause mortality |
|
| 65 |
| Sarafidis et al. [43] | 170 | 63.8 | 69 | Hemodialysis | 54 | NA | 9.4 (2.2) |
|
|
| 28 |
| Chiu et al. [44] | 219 | 64.2 | 32.3 | Hemodialysis | 39.4 | NA | 8.81 (2.08) |
|
|
| 28 |
| He et al. [15] | 128 | 56 | 54 | Hemodialysis | 13.3 | NA | NR | All-cause mortality |
|
| 24 |
| Baumann et al. [45] | 135 | 59.2 | 54 | Non-hemodialysis | 47 | NA | 10.5 (3.0) | All-cause mortality |
|
| 42 |
| Avramovski et al. [46] | 80 | 59.3 | 34 | Hemodialysis | 20 | NA | 12.5 (2.01) |
|
|
| 36 |
| Karras et al. [18] | 439 | 59.8 | 26 | Non-hemodialysis | 27 | 28 | 11.9 (3.4) |
|
|
| 56 |
| Othmane et al. [47] | 98 | 63.4 | 39 | Hemodialysis | 40.8 | 60.2 | 11.2 (3.25) | CV mortality |
|
| 29 |
| Zoungas et al. [25] | 207 | 57 | 32 | Non-hemodialysis | NA | 72 | NA |
|
|
| 60 |
| Shoji et al. [48] | 256 | 55.4 | 59 | Hemodialysis | 19.5 | NA | 8.64 ± 2.16 |
|
|
| 63 |
| Blacher et al. [49] | 241 | 51.5 | 39 | Hemodialysis | 7 | 24 | 11.1 ± 3.1 |
|
|
| 72 |
DM, diabetes mellitus; OR, odds ratio.
Risk of bias assessment
All studies selected for quantitative synthesis (Tables 1–3) also underwent a quality assessment based on the MINORS published criteria [13]. Results of the quality assessment are shown in Supplementary data, Table S5. Overall, all included studies had good quality, with a mean MINORS score of 19.1 (out of 24) for cIMT, 19.3 for CACS studies and 19.1 for PWV studies. None of the included studies performed a prospective sample size calculation.
Meta-analysis results in HD and non-HD patient populations
cIMT
HD patients
The pooled estimate for all-cause mortality was 1.08 (95% CI 1.00–1.17) per unit change in cIMT in HD patients [15, 17, 21, 22, 24]. For CV mortality, the combined effect estimate was 1.29 (95% CI 1.13–1.47) with only two studies included in the meta-analysis (Figure 1) [22, 24]. No model was run for CV events as only one study was included (RR: 1.83, 95% CI 0.55–6.63) [19]. I2 was 68% (P-value = 0.014) for all-cause mortality and 0% (P-value = 0.365) for CV mortality.
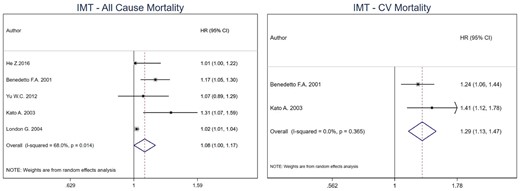
Pooled effect of cIMT on all-cause mortality and CV mortality in HD patients (per unit increase in cIMT). Forest plot of the effect of cIMT on all-cause mortality (left) and CV mortality (right) across studies with CKD patients undergoing hemodialysis.
Non-HD patients
A separate meta-analysis was not carried out for non-HD patients as only two studies recruited non-HD patients. Both studies examined the association of high versus low cIMT with specific outcomes. More specifically Hinderliter et al. reported an HR of 2.75 (95% CI 1.41–5.38) for CV events risk among 198 non-HD patients [16], while Karras et al. reported an HR of 3.18 (95% CI 1.08–9.39) for the risk of all-cause mortality among 439 non-HD patients [18].
CACS
HD patients
For CACS, the combined HR for all-cause mortality was 2.51 (95% CI 1.78–3.72) for high versus low CACS in HD patients [19, 27, 33–35, 37, 38]. For CV events [19, 27, 29, 34], the combined effect estimate was 3.77 (95% CI 2.16–6.58), with no heterogeneity among included studies for both outcomes (I2: 0%, P-value = 0.384 for all-cause mortality and I2: 20.2%, P-value = 0.288 for CV events). No model was run for CV mortality as only one study was included (Figure 2).
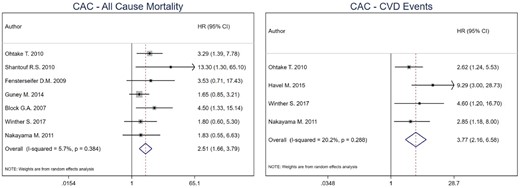
Pooled effect of CACS on all-cause mortality and CV events in HD patients (high versus low CACS). Forest plot of the effect of CACS on all-cause mortality (left) and CV events (right) across studies with CKD patients undergoing hemodialysis.
Non-HD patients
Among non-HD patients, the combined HR for CV events was 4.02 (95% CI 1.57–10.29) for high versus low CACS [26, 28, 30, 31, 36, 40]. Heterogeneity among included studies was high (I2: 63.4% for CV events). No model was run for all- cause mortality and CV mortality due to low number of studies.
PWV
HD patients
For PWV cut-off analysis, the combined estimate for all-cause mortality was 5.34 (95% CI 3.01–9.47) for high versus low PWV in HD patients [43, 46, 49]. For CV mortality, the combined effect estimate was 8.55 (95% CI 4.37–16.73) [43, 46, 49, 51]. Heterogeneity was 0% for both all-cause (P-value = 0.754) and CV mortality (P-value = 0.532) combined estimates. No model was run for CV events as only one study was included (Figure 3). Per 1 m/s increment unit increase in PWV [15, 44, 46, 48, 49], the combined estimate for all-cause mortality was 1.25 (95% CI 1.17–1.34), while for CV mortality was 1.24 (95% CI 1.16–1.34) [44, 46–48, 53]. Heterogeneity was 0% for all-cause mortality (P-value = 0.426) and 15.5% for CV mortality (P-value = 0.316) (Figure 4).

Pooled effect of PWV on all-cause mortality and CV mortality in HD patients (high versus low PWV). Forest plot of the effect of PWV on all-cause mortality (left) and CV mortality (right) across studies with CKD patients undergoing hemodialysis.
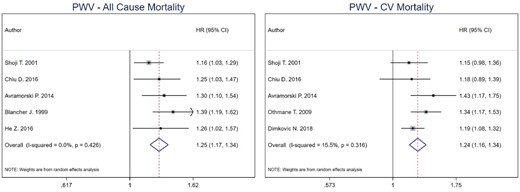
Pooled effect of PWV on all-cause mortality and CV mortality in HD patients (per increase in PWV). Forest plot of the effect of PWV on all-cause mortality (left) and CV mortality (right) across studies with CKD patients undergoing hemodialysis.
Non-HD patients
Among non-HD patients, the combined HR for all-cause mortality was 2.52 (95% CI 1.40–4.55) for high versus low PWV [18, 45, 52]. There was no heterogeneity among the included studies (I2: 0% for all-cause mortality). No model was run for CV mortality and CV events due to low number of studies.
Table 4 presents a summary of the meta-analysis results for all three outcomes for HD and non-HD patients separately.
Meta-analysis results for all three outcomes, shown separately for HD and non-HD patients
| All-cause mortality [RR (95% CI) (I2)] | CVD mortality [RR (95% CI) (I2)] | CVD events [RR (95% CI) (I2)] | ||||
|---|---|---|---|---|---|---|
| HD patients | Non-HD patients | HD patients | Non-HD patients | HD patients | Non-HD patients | |
| cIMTa |
| NA |
| NA | NA | NA |
| CACb |
| NA | NA | NA |
|
|
| PWVb |
|
|
| NA | NA | NA |
| PWVa |
| NA |
| NA | NA | NA |
Per unit increase analysis.
Cut-off analysis.
NA, not enough data available to perform meta-analysis.
DISCUSSION
This is the first systematic review and meta-analysis on the predictive effect of three non-invasive imaging modalities for all-cause mortality, CV mortality and CV events in patients with CKD. Meta-analysis for cIMT included pooled data from five studies in 708 individuals; for CACS we included eight studies with 862 subjects and for PWV nine studies with 1508 subjects.
For all three markers, the risk for both all-cause and CV mortality in patients on HD increased with increasing values (data were not sufficient for CACS and CV mortality). Specifically, for every unit change (either mm or SD) in cIMT, the risk for all-cause mortality increased by 8% and for CV mortality by 29%. HD patients in both the high CACS and PWV group had higher risk for all-cause mortality (2.5- and 5-fold increased risk, respectively) and CV mortality (8-fold for PWV), indicating that even in this high-risk group of ESRD patients, there is a benefit of using these imaging modalities to better stratify patients and identify measures that can improve outcomes. Regarding CV events, we were only able to perform a meta-analysis for CACS, again showing an increased risk for high versus low values of CACS in HD patients (∼4-fold). For non-HD patients, we were able to perform a meta-analysis of the effect of PWV on all-cause mortality and of CACS on CV events (3.5- and 4-fold increased risk, respectively). A summary of the results is shown in Table 4.
The hallmark of atherosclerosis is the thickening of the arterial wall. In their landmark study, Pignoli et al. demonstrated that the measurement of the IMT of the common carotid artery by B-mode real-time ultrasonography corresponds well with histological specimens [54]. cIMT can be used as a surrogate of subclinical atherosclerosis, calculated by the distance between the luminal border of the intima and the outer border of the media of the carotid artery far wall and represented as a double-line pattern on the ultrasound image [55]. It is important to highlight the necessity of a homogenized approach for image acquisition, data analysis and reporting methods, as well as the use of unified criteria to distinguish early atherosclerotic plaques from increased IMT [56]. Additionally, age and sex differences in cIMT should be taken into consideration [57, 58].
Several large clinical studies have demonstrated associations between cIMT and CV events in the general population [59, 60]. In a meta-analysis, Lorenz et al. have shown that the RR of myocardial infarction and stroke were 1.15 and 1.18, respectively, for every 0.1 mm increase in cIMT [9]. Whether cIMT improves CVD prediction when added to traditional risk factors, such as the Framingham risk score, has been questioned [61]. Den Ruijter et al. showed only a small improvement in 10-year CVD risk prediction when adding cIMT to conventional risk prediction models in a meta-analysis of general population studies [62]. Importantly, in most of the studies, renal function is not accounted for and CKD patients are underrepresented or not included at all. Nonetheless, in this group of patients, risk prediction tools are lacking as the current traditional factors underestimate the CV burden especially in asymptomatic individuals [6, 63]. In the Mannheim Carotid Intima Thickness and Plaque Consensus, it is recommend that asymptomatic individuals with risk factors or at intermediate risk should be screened for CVD risk with cIMT and plaque presence [64]. There is paucity of comparable studies on the use of cIMT risk prediction in non-dialysis CKD patients that can be used for meta-analyses. For patients on HD, the pooled RR estimate per cIMT unit increase for all-cause mortality and CV mortality of 1.08 and 1.29, respectively, indicates that cIMT is useful tool to identify patients for targeted interventions to mitigate CVD risk.
Arterioslcerosis is the predominant vascular pathophysiologic process in CKD starting as early as Stage 1 with a stepwise increase to Stage 5 in the clinical course of CKD [65–67]. It is characterized by thickening and calcification of the medial arterial layer that results in increased arterial stiffness. This loss of arterial distensibility dampens the protective ‘cushioning effect’ of the aorta and the major arteries from high and fluctuating systolic pressures on the renal, cardiac and cerebral microvasculature. Additionally, it disrupts the balance between the physiologically matched left ventricular and arterial elastance (arterial–ventricular interaction), causing increased left ventricular afterload and resulting in increased systolic pressure, lower diastolic pressure and reduced diastolic coronary perfusion [68]. The clinical manifestations of these processes are congestive heart failure, lethal arrhythmias, progressive renal and cognitive impairment.
Although several methods exist to measure arterial stiffness, such as pulse pressure, the ambulatory arterial stiffness index and augmentation index, the non-invasive gold standard for measuring arterial stiffness is PWV. It is assessed by the velocity of pulse wave travel in a defined arterial segment. In 2015, the American Heart Association with a scientific statement recommended measurement of carotid–femoral PWV (cfPWV) and provided a comprehensive document on physiology, the various methodologies and devices, and standardization of measurements [69]. Arterial stiffness increases with age and blood pressure; however, in patients with CKD it occurs in an accelerated rate. Normal and reference PWV value per age decade and blood pressure category in a large European population were published in 2010 [70]. Similar to cIMT studies, the presence of renal impairment is rarely reported and estimated glomerular filtration rate is not accounted for in the majority of PWV studies. The proposed cut-off value of cfPWV is 10 m/s based on the general population Framingham Heart Study [71], although in CKD this cut-off remains to be determined. Moreover, we found heterogeneity in the methodology of PWV measurement used in individual studies (Supplementary data, Table S4) [72]. Nonetheless, our meta-analysis demonstrates that PWV is a strong predictor of CVD and all-cause mortality in CKD and the effect estimate is even higher in HD patients. Strategies to prevent arterial stiffness progression remain an area of increased interest at least in ESRD [73]. Whether the use of PWV performs over and above the assessment of common risk factors in the prediction of CVD in dialysis patients remains an area of debate [74] and larger scale studies are needed (Supplementary data, Table S4).
Atherosclerosis and arteriosclerosis in CKD result in accelerated intimal and medial arterial layer calcium deposition. Calcification in the coronary arteries can be detected with low radiation exposure non-contrast multidetector CT and quantified using the Agatston method [75]. In the general population, CACS greater than 400 U are associated with a 4.3- to 17-fold higher RR for CV events [11]. CACS testing is an established risk prediction tool to guide treatment decisions in asymptomatic individuals at intermediate risk [76]. However, the clinical utility of CACS in CKD has been questioned due to substantially higher CACS in CKD patients compared with the general population, which reduces its discriminatory power. Additionally, there are conflicting data of small CKD studies on the correlation between CACS and coronary angiography findings, and thus the usefulness of CACS for pre-transplantation cardiovascular risk assessment is uncertain [77]. Nonetheless, in the current meta-analysis, higher CACS is associated with 2.5-fold risk increase for all-cause mortality and 4-fold increase for CV events. Interestingly, the Chronic Renal Insufficiency Cohort (CRIC) study showed that higher CACS was associated with increased risk of CVD independent of atherosclerotic and mineral–bone metabolism factors, a finding that warrant further studies on the role of CACS on CVD in patients with CKD [26].
Overall, included studies showed low heterogeneity (I2 < 50% overall), with PWV studies having an especially low heterogeneity (I2: 0%). Nevertheless, we used the random effects model in order to account for the clinical heterogeneity between the study populations.
Strengths of our study include the systematic nature of the analysis performed separately for HD and non-HD patients and the use of appropriate statistical methodology. Several limitations, however, also exist. Aggregate estimates of studies were used in the analysis (versus individual patient data), thus issues with original studies remain; however, the quality of included studies was assessed based on specific criteria and all studies had an overall good quality. Not all studies reported adjusted estimates, and the majority only adjusted for a few confounders, such as age, sex, etc.; therefore, we cannot rule out that results could be due to residual confounding. We were also unable to look at sex-specific associations as effects were not reported separately for men and women, with men generally overrepresented in patient groups with CKD. Additionally, publication bias for ‘positive’ studies should be taken into account.
Although cut-offs have been previously proposed in guidelines for all three markers, these are not always followed (especially in the case of cIMT and PWV) and we therefore used the cut-off points as analysed by each study [8], which may have introduced exposure misclassification bias. However, the replication of our findings in separate continuous analyses (per unit increase for PWV; data not shown) limit the possible effect of such bias, although it cannot be ruled out completely. As single reference values and cut-off points are being proposed, future studies are expected to be more directly comparable. An additional limitation comes from the fact that especially for CV events, definitions differed among included studies, which may be a source of bias as specific markers may be associated with certain CV events. However, such an effect should dilute our results towards the null, therefore the actual effect sizes may be even larger. Methods used to assess exposures also differed by study.
CONCLUSION/IMPLICATIONS
The present systematic review and meta-analysis show that cIMT, CACS and PWV are associated not only with CV mortality but also with all-cause mortality. Importantly, all three methods are non-invasive, reproducible, safe (albeit a small radiation exposure of CACS) and easily transferable to daily practice. Moreover, they can be used to identify subclinical changes in different vascular layers at stages, where targeted interventions may be of greater benefit in the clinical course of CKD. This is particularly important in view of the increasing CKD incidence, the high CVD burden in this population and the lack of clinical tools to aid better stratification and monitoring and guide therapeutic interventions. The results of this meta-analysis support the study of interventions with effect on these indices of vascular disease and subsequent long-term CVD outcomes.
ACKNOWLEDGEMENTS
The datasets used and analysed during the current study are available from the corresponding author on reasonable request. We thank Professor Rob Walker, University of Otago, New Zealand, for his support and Professor Suetonia Palmer, University of Otago, New Zealand, for her review of the manuscript and comments.
FUNDING
This research did not receive any specific grant from funding agencies in the public, commercial or not-for-profit sectors.
AUTHORS’ CONTRIBUTIONS
A.G.P. and A.Kousios conceived the hypothesis for this manuscript. P.K., A.Kousios and A.G.P. performed the search and extraction of information from the papers and organized the material with the help of A.Kanari and D.K. P.K. performed the statistical analysis under the guidance of S.I.P. A.Kousios, P.K. and A.G.P. prepared the first draft of the manuscript. All authors assisted in the interpretation of findings and critically revised the manuscript. All authors have read and approved the final version of the manuscript.
CONFLICT OF INTEREST STATEMENT
None declared.
REFERENCES
References [51–77] provided in Supplementary data.
Author notes
Panayiotis Kouis and Andreas Kousios contributed equally to this work.


Comments