


Abstract
End-stage renal disease yields susceptibility to both ischemia and bleeding. The optimal duration of dual antiplatelet therapy (DAPT) after drug-eluting stent (DES) implantation is not established in dialysis patients, who are usually excluded from randomized studies. Since recent studies implied the benefits of prolonged DAPT >12 months in chronic kidney disease, we investigated the effectiveness and safety of prolonged DAPT in dialysis patients with higher cardiovascular risks.
In this nationwide population-based study, we analyzed dialysis patients who underwent DES implantation from 2008 to 2015. Continued DAPT was compared with discontinued DAPT using landmark analyses, including free-of-event participants at 12 (n = 2246), 15 (n = 1925) and 18 months (n = 1692) after DES implantation. The primary outcome was major adverse cardiovascular events (MACEs): a composite of mortality, nonfatal myocardial infarction, coronary revascularization and stroke. Major bleeding was a safety outcome. Inverse probability of treatment weighting Cox regression was performed.
Mean follow-up periods were 278.3–292.4 days, depending on landmarks. Overall, incidences of major bleeding were far lower than those of MACE. Continued DAPT groups showed lower incidences of MACE and higher incidences of major bleeding, compared with discontinued DAPT groups. In Cox analyses, continued DAPT reduced the hazards of MACE at the 12- [hazard ratio (HR) = 0.74, 95% confidence interval (CI) 0.61–0.90; P = 0.003], 15- (HR = 0.78, 95% CI 0.64–0.96; P = 0.019) and 18-month landmarks (HR = 0.79, 95% CI 0.63–0.99; P = 0.041), but without a significant increase in major bleeding at 12 (HR = 1.39, 95% CI 0.90–2.16; P = 0.14), 15 (HR = 1.13, 95% CI 0.75–1.70; P = 0.55) or 18 months (HR = 1.27, 95% CI 0.83–1.95; P = 0.27).
Prolonged DAPT reduced MACE without significantly increasing major bleeding in patients who were event-free at 12 months after DES implantation. In deciding on DAPT duration, prolonged DAPT should be considered in dialysis patients.
INTRODUCTION
Cardiovascular disease is the most common cause of mortality in end-stage renal disease (ESRD) [1, 2], ∼20% of which is attributable to coronary heart disease (CHD). Currently, percutaneous coronary intervention (PCI) with drug-eluting stents (DESs) is increasingly performed in ESRD patients [3], partly due to the high prevalence of CHD and complex comorbidities along with advances in the field of PCI. Nevertheless, these patients show poorer prognosis than those without renal dysfunction, with higher mortality and hemorrhage after PCI [4].
Optimal duration of dual antiplatelet therapy (DAPT) after DES implantation is still under vigorous investigation in the general population. Current guidelines generally recommend at least 6 months for stable CHD and 12 months for acute coronary syndrome (ACS) [5, 6]. Recent studies advocated that prolonged DAPT >12 months could be reasonable for avoiding major adverse cardiovascular events (MACEs), as well as other ischemic complications, such as adverse limb events, in high-risk patients [7–9]. In this regard, renal dysfunction is an independent risk factor of subsequent MACE after PCI, and ESRD patients are at the highest risk [10, 11].
Establishing DAPT duration is more difficult in ESRD, as these patients are usually excluded from randomized clinical trials (RCTs) [12]. Furthermore, platelet and endothelial dysfunction, abnormal coagulation and attenuated response to clopidogrel contribute to increased cardiovascular and bleeding risks in ESRD, creating dilemmas for care providers [12–14]. Although several studies limited to chronic kidney disease (CKD) patients, including post hoc analyses of RCTs, have been performed, the results may not be directly applicable to ESRD patients [15–20]. Still, because renal dysfunction had little effect on fatal bleeding, extended DAPT could be more favorable among CKD patients, considering the net effect on MACE and bleeding [18–20].
Previously, two observational studies explored the topic specifically in ESRD [21, 22]. However, they could not demonstrate the effectiveness of prolonged DAPT due to unsuitable study designs and small numbers of participants maintaining DAPT >12 months. Thus, in this study, we used landmark analyses to investigate the effectiveness and safety of prolonged DAPT >12 months after DES implantation in dialysis patients.
MATERIALS AND METHODS
Data source and study population
The study protocol complies with the Declaration of Helsinki and received approval from the Institutional Review Boards of Seoul National University Hospital (E-1602-006-737). The requirement for informed consent was waived by the boards.
Detailed information is included in Supplementary data, Supplementary Materials and Methods.
In this population-based retrospective cohort study, we used the national health insurance registry covering all kinds of health service claims data of the entire Korean population from 2007 to 2016 [23]. Patients who had been on hemodialysis (HD) or peritoneal dialysis (PD) for >90 days from 2008 to 2015 were initially included. Among them, a total of 9287 patients underwent DES implantation during the period while on dialysis. Flow diagram of the study is illustrated in Figure 1.
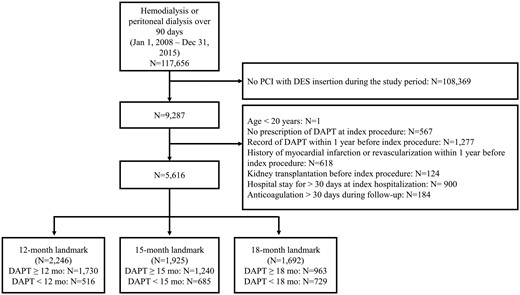
Flow diagram of the study.
Exposure ascertainment
DAPT was defined as concomitant prescription of aspirin and one of the following three drugs: (i) clopidogrel; (ii) prasugrel; or (iii) ticagrelor. More than a 30-day grace period until subsequent DAPT prescription was considered discontinuation [21, 22].
Baseline characteristics
Comorbidities were defined by more than one record of diagnostic codes from the International Classification of Diseases, 10th revision for a previous year from each landmark (Supplementary data, Table S1). Baseline medication use was ascertained by more than one prescription of each drug category for a previous year. Other variables were based on the values at the index procedure.
Outcome measures
The primary outcome was MACE: a composite of mortality, nonfatal myocardial infarction (MI), coronary revascularization and stroke. Nonfatal MI and stroke events were verified by hospitalization with corresponding diagnostic codes (I21 and I63, respectively). Coronary revascularization was detected using procedure codes for PCI and operation codes for coronary artery bypass surgery. We also analyzed major bleeding as a safety outcome. Participants were followed-up from each landmark until 1 year or the occurrence of any event, whichever came first.
Landmark cohorts
To investigate the effectiveness and safety of prolonged DAPT, we constructed landmark cohorts at prespecified landmarks of 12, 15, 18 and 24 months after DES implantation. Participants who were free of events and kidney transplantation before the landmark points were included in the landmark cohorts. Participants who stopped DAPT within 3 months were excluded. We compared hazards of MACE or major bleeding between continued and discontinued DAPT groups, determined according to the DAPT status at the landmark points.
Statistical analyses
Baseline characteristics are described as the mean ± standard deviation (SD) for normally distributed continuous variables and median with interquartile ranges for skewed variables. Differences between groups were analyzed using the t-test and Mann–Whitney test as appropriate. Categorical data are expressed as a count with percentage and were compared using the Chi-squared or Fisher’s exact test, as appropriate.
In time-to-event analyses, Cox regression using the Fine and Gray subdistribution hazards model was adopted to calculate hazard ratios (HRs) for the risks of clinical outcomes, whereas separate Cox regression models were used for each outcome with censoring of other events [24, 25]. Participants who underwent kidney transplantation during follow-up were censored. Cumulative incidence functions were plotted based on the cumulative incidence competing risk method [26]. Proportionality assumption was assessed by log-minus-log plots and Schoenfeld residuals.
Multivariable analyses were performed, adjusting for all baseline variables. Concerning residual selection biases due to the retrospective design, we additionally conducted inverse probability of treatment weighting (IPTW) analyses with stabilized weights. We estimated the propensity scores of treatment groups from multivariable logistic regression models including all baseline variables [27]. Balances were tested with standardized differences.
A two-tailed P < 0.05 was considered statistically significant. Statistical analyses were conducted with SAS (SAS Institute).
RESULTS
Baseline characteristics
Baseline characteristics of participants at each landmark are described in Table 1 according to DAPT status. Regardless of DAPT, >70% were indicated for DES implantation because of ACS. Slightly >50% of participants were diabetic at all landmarks. Most subjects were undergoing HD in both groups.
Baseline characteristics of participants according to the status of DAPT at each landmark
| Characteristics | 12 months | 15 months | 18 months | |||
|---|---|---|---|---|---|---|
| ≥12 months (n = 1730) | <12 months (n = 516) | ≥15 months (n = 1240) | <15 months (n = 685) | ≥18 months (n = 963) | <18 months (n = 729) | |
| Age, years | 62.3 ± 10.2 | 63.2 ± 10.1 | 62.5 ± 10.0 | 62.0 ± 10.4 | 62.5 ± 10.0 | 61.9 ± 10.4 |
| Male, n (%) | 1121 (64.8) | 325 (63.0) | 821 (66.2) | 430 (62.8) | 641 (66.6) | 459 (63.0) |
| HD (versus PD), n (%) | 1480 (85.6) | 433 (83.9) | 1072 (86.5) | 577 (84.2) | 834 (86.6) | 614 (84.2) |
| Information about index event | ||||||
| ACS, n (%) | 1271 (73.5) | 364 (70.5) | 916 (73.9) | 483 (70.5) | 707 (73.4) | 523 (71.7) |
| Second-generation DES (versus first-generation), n (%) | 1453 (84.0) | 413 (80.0) | 1022 (82.4) | 569 (83.1) | 786 (81.6) | 610 (83.7) |
| Number of DES | 1 (1–6) | 1 (1–4) | 1 (1–6) | 1 (1–4) | 1 (1–6) | 1 (1–4) |
| Hospital days (days)a | 8 (1–30) | 9 (1–29) | 8 (1–30) | 8 (1–29) | 8 (1–30) | 8 (1–29) |
| Comorbidities, n (%) | ||||||
| Hypertension | 1535 (88.7) | 456 (88.4) | 1103 (89.0) | 614 (89.6) | 849 (88.2) | 652 (89.4) |
| Atrial fibrillation | 55 (3.2) | 10 (1.9) | 39 (3.2) | 16 (2.3) | 26 (2.7) | 19 (2.6) |
| Valvular heart diseases | 20 (1.2) | 3 (0.6) | 17 (1.4) | 5 (0.7) | 14 (1.5) | 4 (0.6) |
| Lipid disorders | 1060 (61.3) | 294 (57.0) | 756 (61.0) | 391 (57.1) | 577 (59.9) | 422 (57.9) |
| CHF | 207 (12.0) | 67 (13.0) | 150 (12.1) | 87 (12.7) | 120 (12.5) | 89 (12.2) |
| PVD | 186 (10.8) | 46 (8.9) | 126 (10.2) | 68 (9.9) | 99 (10.3) | 68 (9.3) |
| CVA | 276 (16.0) | 90 (17.4) | 193 (15.6) | 106 (15.5) | 146 (15.2) | 108 (14.8) |
| Dementia | 37 (2.1) | 22 (4.3) | 29 (2.3) | 22 (3.2) | 21 (2.2) | 18 (2.5) |
| Pulmonary diseases | 439 (25.4) | 132 (25.6) | 303 (24.4) | 183 (26.7) | 219 (22.7) | 190 (26.1) |
| Connective tissue disorders | 37 (2.1) | 14 (2.7) | 24 (1.9) | 20 (2.9) | 21 (2.2) | 19 (2.6) |
| Peptic ulcer | 428 (24.7) | 139 (26.9) | 288 (23.2) | 179 (26.1) | 235 (24.4) | 181 (24.8) |
| Liver diseases | 49 (2.8) | 12 (2.3) | 30 (2.4) | 22 (3.2) | 23 (2.4) | 20 (2.7) |
| Diabetes | 924 (53.4) | 278 (53.9) | 662 (52.6) | 362 (52.9) | 490 (50.9) | 379 (52.0) |
| Cancer | 86 (5.0) | 26 (5.0) | 53 (4.3) | 38 (5.6) | 40 (4.2) | 41 (5.6) |
| Medication, n (%) | ||||||
| α-blocker | 260 (15.0) | 72 (14.0) | 189 (15.2) | 103 (15.0) | 148 (15.4) | 106 (14.5) |
| Other antiplatelet agents | 275 (15.9) | 81 (15.7) | 194 (15.7) | 109 (15.9) | 150 (15.6) | 117 (16.1) |
| ACE inhibitor/ARB | 1259 (72.8) | 336 (65.1) | 913 (73.6) | 462 (67.5) | 715 (74.3) | 492 (67.5) |
| β-blocker | 713 (41.2) | 190 (36.8) | 517 (41.7) | 265 (38.7) | 406 (42.2) | 288 (39.5) |
| Calcium channel blocker | 1076 (62.2) | 302 (58.5) | 772 (62.3) | 411 (60) | 600 (62.3) | 438 (60.1) |
| Vasodilator | 170 (9.8) | 32 (6.2) | 128 (10.3) | 48 (7.0) | 100 (10.4) | 52 (7.1) |
| Loop diuretics | 831 (48.0) | 235 (45.5) | 606 (48.9) | 315 (46.0) | 466 (48.4) | 336 (46.1) |
| Statin | 808 (46.7) | 215 (41.7) | 573 (46.2) | 297 (43.4) | 439 (45.6) | 323 (44.3) |
| Other lipid-lowering agents | 86 (5.0) | 30 (5.8) | 46 (3.7) | 43 (6.3) | 39 (4.1) | 40 (5.5) |
| PPI | 429 (24.8) | 124 (24.0) | 298 (24.0) | 162 (23.7) | 224 (23.3) | 172 (23.6) |
| Other anti-ulcer medications | 852 (49.3) | 259 (50.2) | 588 (47.4) | 335 (48.9) | 456 (47.4) | 350 (48.0) |
| Nonselective NSAID | 840 (48.6) | 259 (50.2) | 595 (48.0) | 337 (49.2) | 471 (48.9) | 351 (48.2) |
| Cox2 inhibitor | 39 (2.3) | 19 (3.7) | 28 (2.3) | 20 (2.9) | 23 (2.4) | 19 (2.6) |
Values for categorical variables are reported as count (percentage). For continuous variables, the normally distributed ones are reported as the mean ± SD, and otherwise as the median with interquartile ranges. CHF, congestive heart failure; PVD, peripheral vascular disease; CVA, cerebrovascular accident; ACE inhibitor/ARB, angiotensin-converting enzyme inhibitor/angiotensin II receptor blocker; PPI, proton pump inhibitor; NSAID, nonsteroidal anti-inflammatory drug.
Length of hospital stay at admission for DES implantation.
Incidences of clinical outcomes
The mean follow-up periods of the treatment groups are presented in Table 2, which ranged from 278.3 to 292.4 days.
Clinical outcomes according to the status of DAPT in landmark analyses
| MACE | Major bleeding | ||||||||||||
|---|---|---|---|---|---|---|---|---|---|---|---|---|---|
| Overall | Mortality | Nonfatal MI | Revascularization | Stroke | |||||||||
| Follow-up duration (days) | No. of events,an (%) | Incidenceb | No. of events, n (%) | Incidence | No. of events, n (%) | Incidence | No. of events, n (%) | Incidence | No. of events, n (%) | Incidence | No. of events, n (%) | Incidence | |
| Landmark 1 | |||||||||||||
| ≥12 months (n = 1730) | 282.1 ± 120.3 | 357 (20.6) | 267.2 | 103 (6.0) | 77.1 | 77 (4.5) | 57.6 | 158 (9.1) | 118.3 | 66 (3.8) | 49.4 | 110 (6.4) | 82.3 |
| <12 months (n = 516) | 278.3 ± 122.1 | 144 (27.9) | 366.3 | 53 (10.3) | 134.8 | 23 (4.5) | 58.5 | 50 (9.7) | 127.2 | 29 (5.6) | 73.8 | 23 (4.5) | 58.5 |
| Landmark 2 | |||||||||||||
| ≥15 months (n = 1240) | 291.0 ± 113.6 | 219 (17.7) | 221.7 | 79 (6.4) | 80.0 | 43 (3.5) | 43.5 | 84 (6.8) | 85.0 | 38 (3.1) | 38.5 | 71 (5.7) | 71.9 |
| <15 months (n = 685) | 284.3 ± 118.2 | 152 (22.2) | 285.1 | 56 (8.2) | 105.0 | 27 (3.9) | 50.6 | 49 (7.2) | 91.9 | 35 (5.1) | 65.6 | 33 (4.8) | 61.9 |
| Landmark 3 | |||||||||||||
| ≥18 months (n = 963) | 292.4 ± 115.6 | 155 (16.1) | 201.0 | 56 (5.8) | 72.6 | 30 (3.1) | 38.9 | 66 (6.9) | 85.6 | 22 (2.3) | 28.5 | 56 (5.8) | 72.6 |
| <18 months (n = 729) | 289.0 ± 113.9 | 145 (19.9) | 251.4 | 65 (8.9) | 112.7 | 26 (3.6) | 45.1 | 42 (5.8) | 72.8 | 28 (3.8) | 48.5 | 33 (4.5) | 57.2 |
Follow-up durations are reported as the mean ± SD.
Number of events from landmark to the end of follow-up.
Number of events per 1000 patient-years, presented as whole numbers.
Overall incidence of MACE in the ≥12-month group (267.2/1000 patient-years) was lower than that in the <12-month group (366.3/1000 patient-years). Likewise, participants in the ≥15- and ≥18-month groups (≥15 months, 221.7; ≥18 months, 201.0/1000 patient-years) showed lower incidences than those in the <15- and <18-month groups, respectively (<15 months, 285.1; <18 months, 251.4/1000 patient-years).
Incidences of major bleeding were higher in the continued DAPT groups at all landmarks (≥12 versus <12 months, 82.3 versus 58.5; ≥15 versus <15 months, 71.9 versus 61.9; ≥18 versus <18 months, 72.6 versus 57.2/1000 patient-years). However, the figures were far lower than those of MACE, with corresponding small magnitudes of differences between treatment groups of the same landmark point (Table 2).
In both continued and discontinued DAPT groups, incidences of MACE gradually decreased at later landmarks, while a similar trend was not evident for major bleeding.
DAPT lowered the incidences of individual components of MACE in most cases.
Effect of prolonged DAPT treatment on clinical outcomes
The unadjusted cumulative probabilities of MACE according to DAPT status are demonstrated in Figure 2, respectively. Continued DAPT was significantly associated with lower incidences during the entire follow-up period at all landmarks. The differences in probability became continuously larger from the onset of follow-up, which implies an ensuing beneficial effect of DAPT on MACE.
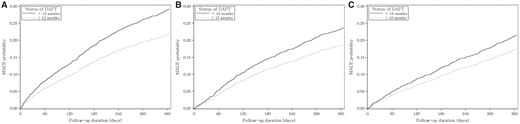
Unadjusted cumulative incidence function for MACEs according to the status of DAPT at each landmark. Cumulative probabilities of MACE for (A) 12-, (B) 15- and (C) 18-month landmark analyses.
The unadjusted cumulative probabilities of major bleeding according to DAPT status are illustrated in Figure 3. Although continued DAPT tended to be correlated with higher probabilities of major bleeding at all landmarks, the differences between groups were not statistically significant.
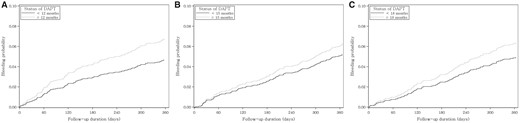
Unadjusted cumulative incidence function for major bleeding according to the status of DAPT at each landmark. Cumulative probabilities of major bleeding for (A) 12-, (B) 15- and (C) 18-month landmark analyses.
Table 3 displays the results of Cox regression analyses evaluating the associations of DAPT with MACE and major bleeding. In unadjusted regression fits, continued DAPT demonstrated lower hazards of MACE compared with discontinued DAPT at the 12- [HR = 0.72, 95% confidence interval (CI) 0.59–0.87; P = 0.001], 15- (HR = 0.77, 95% CI 0.63–0.95; P = 0.014) and 18-month landmarks (HR = 0.79, 95% CI 0.63–0.99; P = 0.044). The lower risks of MACE due to DAPT were also verified in multivariable analyses after adjustment for all baseline variables.
Characteristics of inverse probability of treatment-weighted cohorts at each landmark
| 12 months | 15 months | 18 months | |||||||
|---|---|---|---|---|---|---|---|---|---|
| ≥12 months (n = 1730) | <12 months (n = 516) | Standardized difference (%) | ≥15 months (n = 1241) | <15 months (n = 685) | Standardized difference (%) | ≥18 months (n = 963) | <18 months (n = 728) | Standardzed. difference (%) | |
| Age, years | 62.5 ± 10.2 | 62.6 ± 10.1 | −0.7 | 62.3 ± 10.0 | 62.3 ± 10.3 | 0.0 | 62.2 ± 10.0 | 62.2 ± 10.3 | 0.1 |
| Male, n (%) | 1113 (64.4) | 331 (64.2) | 0.5 | 805 (64.8) | 442 (64.5) | 0.7 | 625 (64.9) | 471 (64.7) | 0.3 |
| HD, n (%) | 1472 (85) | 439 (85) | 0.1 | 1060 (85) | 585 (85) | 0.3 | 822 (85) | 622 (85) | −0.3 |
| Information about index event | |||||||||
| ACS, n (%) | 1259 (72.8) | 375 (72.6) | 0.4 | 900 (72.6) | 498 (72.6) | −0.2 | 699 (72.6) | 529 (72.6) | −0.1 |
| Second-generation DES (versus first-generation), n (%) | 1437 (83.1) | 429 (83.2) | 0.2 | 1023 (82.5) | 565 (82.4) | −0.1 | 795 (82.5) | 602 (82.8) | 0.6 |
| Number of DES | 1 (1–6) | 1 (1–4) | −0.3 | 1 (1–6) | 1 (1–4) | −0.3 | 1 (1–6) | 1 (1–4) | 0.1 |
| Hospital days (days)a | 8 (1–30) | 8 (1–29) | −1.8 | 8 (1–30) | 8 (1–29) | 0.6 | 8 (1–30) | 8 (1–29) | 0.2 |
| Comorbidities, n (%) | |||||||||
| Hypertension | 1533 (88.6) | 454 (88.0) | 1.8 | 1107 (89.2) | 610 (89.0) | 0.5 | 644 (88.6) | 854 (88.6) | 0.2 |
| Atrial fibrillation | 50 (2.9) | 15 (2.9) | 0.1 | 36 (2.9) | 21 (3.0) | −0.7 | 20 (2.7) | 26 (2.7) | 0.0 |
| Valvular heart diseases | 18 (1.0) | 5 (1.0) | 0.4 | 14 (1.2) | 9 (1.3) | −1.0 | 7 (1.0) | 10 (1.1) | 0.5 |
| Lipid disorders | 1044 (60.4) | 314 (60.8) | −1.0 | 741 (59.7) | 411 (60.0) | −0.6 | 433 (59.5) | 571 (59.2) | −0.5 |
| CHF | 212 (12.3) | 64 (12.5) | −0.7 | 154 (12.4) | 85 (12.4) | −0.0 | 90 (12.4) | 120 (12.4) | 0.1 |
| PVD | 178 (10.3) | 52 (10.1) | 0.6 | 124 (10.0) | 68 (9.9) | 0.2 | 70 (9.7) | 94 (9.8) | 0.4 |
| CVA | 282 (16.3) | 85 (16.5) | −0.5 | 194 (15.6) | 108 (15.8) | −0.5 | 109 (15.0) | 145 (15.0) | 0.0 |
| Dementia | 45 (2.6) | 13 (2.6) | 0.1 | 33 (2.6) | 18 (2.7) | −0.4 | 17 (2.4) | 22 (2.3) | −0.6 |
| Pulmonary diseases | 440 (25.5) | 134 (25.9) | −1.0 | 313 (25.2) | 172 (25.1) | 0.3 | 174 (24.0) | 232 (24.0) | 0.2 |
| Connective tissue disorders | 39 (2.3) | 12 (2.3) | 0.0 | 29 (2.3) | 15 (2.2) | 0.4 | 17 (2.3) | 23 (2.4) | 0.4 |
| Peptic ulcer | 438 (25.3) | 132 (25.6) | −0.5 | 303 (24.4) | 166 (24.3) | 0.3 | 178 (24.4) | 237 (24.6) | 0.4 |
| Liver diseases | 47 (2.7) | 13 (2.6) | 0.9 | 34 (2.7) | 19 (2.8) | −0.4 | 18 (2.5) | 24 (2.5) | −0.1 |
| Diabetes | 926 (53.6) | 277 (53.6) | −0.1 | 655 (52.8) | 363 (52.9) | −0.3 | 373 (51.3) | 495 (51.4) | 0.3 |
| Cancer | 87 (5.0) | 28 (5.4) | −1.6 | 59 (4.8) | 33 (4.8) | −0.1 | 34 (4.7) | 47 (4.9) | 0.7 |
| Medication, n (%) | |||||||||
| α-blocker | 256 (14.8) | 77 (14.9) | −0.4 | 189 (15.2) | 101 (14.8) | 1.2 | 107 (14.8) | 145 (15.0) | 0.7 |
| Other antiplatelet agents | 275 (15.9) | 85 (16.4) | −1.4 | 195 (15.7) | 109 (15.8) | −0.3 | 115 (15.8) | 152 (15.8) | −0.1 |
| ACE inhibitor/ARB | 1229 (71.0) | 368 (71.3) | −0.5 | 884 (71.3) | 488 (71.2) | 0.1 | 519 (71.4) | 687 (71.3) | −0.2 |
| β-blocker | 695 (40.2) | 205 (39.7) | 1.0 | 508 (40.9) | 282 (41.1) | −0.5 | 300 (41.2) | 397 (41.3) | 0.1 |
| Calcium channel blocker | 1062 (61.4) | 315 (61.1) | 0.6 | 763 (61.5) | 421 (61.5) | 0.1 | 448 (61.6) | 592 (61.5) | −0.2 |
| Vasodilator | 156 (9.0) | 47 (9.1) | −0.2 | 113 (9.1) | 62 (9.1) | 0.1 | 64 (8.8) | 86 (8.9) | 0.4 |
| Loop diuretics | 822 (47.5) | 247 (47.8) | −0.6 | 594 (47.9) | 328 (47.9) | 0.1 | 345 (47.4) | 457 (47.4) | 0.0 |
| Statin | 788 (45.6) | 235 (45.6) | −0.0 | 562 (45.3) | 311 (45.4) | −0.1 | 329 (45.2) | 434 (45.1) | −0.3 |
| Other lipid-lowering agents | 88 (5.1) | 25 (4.8) | 1.2 | 59 (4.8) | 32 (4.7) | 0.3 | 35 (4.8) | 47 (4.8) | 0.2 |
| PPI | 427 (24.7) | 132 (25.6) | −2.2 | 299 (24.1) | 168 (24.5) | −1.1 | 173 (23.8) | 228 (23.7) | −0.3 |
| Other anti-ulcer medications | 857 (49.5) | 261 (50.5) | −2.0 | 597 (48.1) | 331 (48.3) | −0.3 | 346 (47.6) | 459 (47.7) | 0.2 |
| Nonselective NSAID | 845 (48.9) | 251 (48.6) | 0.5 | 599 (48.3) | 330 (48.1) | 0.2 | 350 (48.1) | 466 (48.3) | 0.5 |
| Cox2 inhibitor | 45 (2.6) | 13 (2.6) | 0.1 | 32 (2.6) | 17 (2.5) | 0.4 | 17 (2.4) | 24 (2.5) | 0.7 |
Values for categorical variables are reported as count (percent), and for continuous variables, normally distributed ones are reported as the mean ± SD, and otherwise as the median with interquartile ranges. CHF, congestive heart failure; PVD, peripheral vascular diseases; CVA, cerebrovascular accident; ACE inhibitor/ARB, angiotensin-converting enzyme inhibitor/angiotensin II receptor blocker; PPI, proton pump inhibitor; NSAID, nonsteroidal anti-inflammatory drug.
Length of hospital stay at admission for DES implantation.
To address potential selection biases originating from the retrospective design, we adopted the IPTW method using propensity scores in further analyses. Characteristics of the IPTW cohorts for three landmarks are depicted in Table 3. Given standardized differences <10%, balances between the continued and discontinued DAPT groups were acceptable. Continued DAPT exhibited significant associations with decreased hazards of MACE at the 12- (HR = 0.74, 95% CI 0.61–0.90; P = 0.003), 15- (HR = 0.78, 95% CI 0.64–0.96; P = 0.019) and 18-month landmarks (HR = 0.79, 95% CI 0.63–0.99; P = 0.041; Table 4).
Associations of the DAPT maintenance with clinical outcomes in Cox regressions with different adjustment methods
| 12 months | 15 months | 18 months | ||||
|---|---|---|---|---|---|---|
| HRs (95% CI) | P-value | HRs (95% CI) | P-value | HRs (95% CI) | P-value | |
| MACE | ||||||
| Overall | ||||||
| MV-adjusteda | 0.73 (0.60–0.89) | 0.002 | 0.78 (0.63–0.96) | 0.018 | 0.78 (0.62–0.98) | 0.032 |
| IPTWb | 0.74 (0.61–0.90) | 0.003 | 0.78 (0.64–0.96) | 0.019 | 0.79 (0.63–0.99) | 0.041 |
| Mortality | ||||||
| MV-adjusted | 0.59 (0.42–0.82) | 0.002 | 0.78 (0.55–1.10) | 0.16 | 0.65 (0.45–0.93) | 0.020 |
| IPTW | 0.58 (0.42–0.81) | 0.001 | 0.81 (0.57–1.14) | 0.22 | 0.67 (0.47–0.96) | 0.030 |
| Nonfatal MI | ||||||
| MV-adjusted | 1.03 (0.64–1.65) | 0.90 | 0.90 (0.54–1.49) | 0.67 | 0.88 (0.51–1.50) | 0.63 |
| IPTW | 1.01 (0.64–1.61) | 0.95 | 0.87 (0.54–1.39) | 0.56 | 0.93 (0.55–1.56) | 0.78 |
| Revascularization | ||||||
| MV-adjusted | 0.94 (0.69–1.29) | 0.70 | 0.96 (0.67–1.37) | 0.81 | 1.15 (0.78–1.70) | 0.49 |
| IPTW | 0.96 (0.70–1.33) | 0.81 | 0.93 (0.65–1.32) | 0.67 | 1.14 (0.78–1.68) | 0.50 |
| Stroke | ||||||
| MV-adjusted | 0.72 (0.46–1.11) | 0.14 | 0.59 (0.38–0.93) | 0.022 | 0.57 (0.33–0.98) | 0.042 |
| IPTW | 0.73 (0.47–1.15) | 0.17 | 0.60 (0.37–0.95) | 0.029 | 0.55 (0.31–0.97) | 0.037 |
| Major bleeding | ||||||
| MV-adjusted | 1.45 (0.92–2.28) | 0.11 | 1.18 (0.78–1.80) | 0.46 | 1.28 (0.83–1.98) | 0.27 |
| IPTW | 1.39 (0.90–2.16) | 0.14 | 1.13 (0.75–1.70) | 0.55 | 1.27 (0.83–1.95) | 0.27 |
The results of analyses limited to individual outcomes of MACE suggested protective effects of DAPT on mortality and stroke in certain subsets of landmarks. Interestingly, extended treatment over 15 (HR = 0.60, 95% CI 0.37–0.95; P = 0.029) or 18 months (HR = 0.55, 95% CI 0.31–0.97; P = 0.037) significantly reduced stroke after IPTW. Nonfatal MI and revascularization, directly linked to CHD, were not significantly improved by DAPT maintenance as an individual outcome.
In contrast to MACE, major bleeding was not increased by DAPT at any landmark (Table 4).
Sensitivity analyses
Characteristics of participants were compared according to DAPT status at the 24-month landmark to explore the benefits and risks of more extended DAPT treatment (Supplementary data, Table S2). Differences in baseline characteristics disappeared in IPTW cohorts. Although continued DAPT decreased the incidence of MACE (198.4 versus 245.3/1000 patient-years), it did not show a significant benefit in Cox analyses except in the multivariable-adjusted model (HR = 0.75, 95% CI 0.58–0.98; P = 0.033; Supplementary data, Table S3).
Since the choice of second antiplatelet agent other than aspirin might impact clinical outcomes, we separately analyzed three subgroups (i.e. clopidogrel, prasugrel or ticagrelor) at the 12-month landmark (Supplementary data, Tables S4 and S5). Since the sample sizes of the ticagrelor and prasugrel subgroups were not enough to consider further statistical analyses, we performed Cox regression analyses only for the clopidogrel subgroup. Consistently, continued DAPT significantly reduced MACE (HR = 0.74, 95% CI 0.61–0.91; P = 0.003), without increase in major bleeding (Supplementary data, Table S6).
We further performed subgroup analyses by dialysis modality (Supplementary data, Tables S7 and S8). Incidences of major bleeding in both subgroups were not significantly different according to DAPT status (Supplementary data, Table S9). Continued DAPT in HD subgroup significantly reduced MACE (HR = 0.70, 95% CI 0.57–0.87; P = 0.001) in IPTW Cox (Supplementary data, Table S10). Although not statistically significant due to reduced sample size, continued DAPT showed possible effect toward the reduction of MACE in PD group (HR = 0.79, 95% CI 0.51–1.23; P = 0.297).
DISCUSSION
To our knowledge, this nationwide study was the first to report a significant benefit of prolonged DAPT (>12 months after DES implantation) on MACE in dialysis patients, accompanied by no significant increase in major bleeding. The benefit of DAPT may persist until ≥2 years after PCI, given significantly reduced hazards and persistently increasing differences in the cumulative probabilities of MACE during follow-up.
In research performed in the USA, clopidogrel discontinuation within 3, 6 or 12 months after DES implantation showed a consistent trend to increase death or MI in dialysis patients, albeit without statistical significance [22]. Conversely, in a study of dialysis patients using the national registry in Taiwan, the benefit of DAPT was mainly confined to the 6 months after PCI in a nested case–control design within 1 year and in a 6-month landmark analysis [21]. However, the study included an insufficient number of participants receiving DAPT for >12 months and focused on events within 1 year after PCI, necessitating research with longer DAPT use and enough power. In addition to the results from two observational studies targeting ESRD, our study supports the notion that DAPT can be reasonably prolonged for event-free patients at 12 months after DES implantation.
Post hoc analyses of the Clopidogrel for the Reduction of Events During Observation (CREDO) and Prolonging Dual Antiplatelet Treatment After Grading Stent-Induced Intimal Hyperplasia Study (PRODIGY) trials performed in subjects with estimated glomerular filtration rate <60 mL/min/1.73 m2 demonstrated that ≥1 year of DAPT did not affect the incidence of MACE [15, 17]. However, DAPT for 1 year was compared with 1 month in the CREDO trial, which is not compatible with current guidelines. Also, the low overall event rate in the PRODIGY trial suggests that relatively low-risk patients might have been included. CKD patients with DESs were analyzed in a meta-analysis of five RCTs regarding the optimal duration of DAPT [28]. In the study, prolonged DAPT could not reduce MACE in CKD. However, considering significant decrease in the risk of MACE by prolonged DAPT in non-CKD from the same study, the absence of benefits in CKD with more cardiovascular risks might not be completely acceptable [18, 20, 29]. In addition, the study included few advanced CKD (Stages 4 and 5) patients and a small proportion of ACS.
Notably, recent evidence supported long-term DAPT for those with renal dysfunction, especially in ACS [18–20]. DAPT beyond 1 year was suggested to benefit DES-treated CKD patients through the prevention of both late stent thromboses [18] and disease progression in de novo culprits [19]. Furthermore, prolonged DAPT resulted in a significant reduction of MACE with increased major but not fatal bleeding in a meta-analysis of 33 435 patients who underwent DES implantation due to MI [19]. Subgroup analysis also confirmed the result in CKD population. In Swedish CKD patients, analyses for the combined outcome of MACE and bleeding preferred ≥3 months of DAPT (versus <3 months) [20]. The high proportion of ACS in our study could have contributed to the favorable results for prolonged DAPT.
Although statistical tests showed insignificant results in our study, DAPT seems to increase the risk of major bleeding in ESRD [30]. However, the extent of the increase in major bleeding was considerably smaller than that in MACE, even though incidences of major bleeding were largely within the compatible range reported by previous studies performed in dialysis patients [21, 22, 31]. The prognostic values of bleeding have been weighed against those of ischemic complications in the setting of DAPT after PCI [32, 33]. Considering the comparable impacts of MI to those of Bleeding Academic Research Consortium Type 3 bleeding on mortality in one of those studies [33], we infer that the benefit from significantly reduced MACE could not be outweighed by the harm incurred by the small increase in major bleeding (by our own definition). In addition, renal dysfunction did not make the degree of increase in fatal DAPT-related bleeding more profound in several studies performed in CKD patients [15, 16, 18, 20].
Among individual outcomes, mortality and stroke primarily contributed to the reduction of MACE from prolonged DAPT. In the past, antiplatelet therapy in ESRD was shown to increase mortality without much benefit [31, 34]. However, these studies failed to define the indication of antiplatelet treatment. Moreover, they targeted the prevention of HD-access thrombosis instead of MACE. More recent evidence shows that prolonged DAPT is not associated with increased mortality [5, 19, 35]. Additionally, the reduction of stroke by extended DAPT in the subgroup with CKD was also observed in the PEGASUS trial [29].
In contrast to mortality, prolonged DAPT could not reduce the hazards of nonfatal MI and revascularization individually. However, separation of aggregated outcomes might have resulted in the loss of statistical power owing to small event numbers. Incidences of nonfatal MI and revascularization were numerically reduced in most circumstances. Additionally, considering the high mortality after MI [36] and physicians’ reluctance to perform revascularization because of low success rates and increased adverse events in dialysis patients [11], many events might have been classified as mortality or unrecognized.
Given the absence of a prospective study, this nationwide administrative study may have strengths, representing real-world practice [37]. Notably, as our study included DES implantation performed from 2008 to 2015, a large proportion of participants were subject to the second-generation DES implantation, reflecting more recent trends than the two previous studies in ESRD [21, 22].
Our study has several limitations. First, minor bleeding events were not detected in our study, and their impacts on quality of life should be kept in mind. Second, healthcare utilization beyond the coverage of insurance might not have been detected. Moreover, residual selection biases could be present due to the retrospective design. Regarding generalizability, because most participants were prescribed clopidogrel as the second antiplatelet agent besides aspirin, our results might apply solely to the cases of DAPT with clopidogrel. Given a lack of data regarding the efficacy and safety in dialysis patients (prolonged), DAPT with prasugrel or ticagrelor can be considered only in cases with high ischemic and/or low bleeding risks. As for dialysis modality, prolonged DAPT did not show significant benefits for reducing MACE in PD. Nevertheless, considering an increased hazard of cardiovascular death due to MI [38] and relatively lower risk of bleeding in PD compared with HD, we think that prolonged DAPT can be reasonably considered in PD patients. Lastly, information about stent thrombosis and some confounders, such as smoking, coronary anatomy or PCI complexity, could not be obtained; instead, the numbers of implanted stents were collected.
In conclusion, prolonged DAPT >12 months after DES implantation may significantly reduce MACE without substantially increasing bleeding concern in dialysis patients. In keeping with efforts to individualize DAPT duration [5, 39, 40], we suggest that risk scores weigh dialysis as a risk factor for ischemia rather than bleeding; this is in contrast to CKD, which is included on both sides and thus is neutral in the DAPT score [39].
FUNDING
This work was supported by a grant from the Korea Healthcare Technology R&D Project, the Ministry of Health and Welfare, Republic of Korea (HI17C0530).
AUTHORS’ CONTRIBUTIONS
S.P., Y.K., H.A.J., S.L., B.R.Y., J.L. and D.K.K. were involved in the research idea and study design, and were responsible for the data acquisition. S.P., H.A.J., M.-S.K., B.R.Y., S.S.H., H.L., J.P.L., K.W.J., C.S.L., Y.S.K. and D.K.K. were responsible for data analyses and interpretation. J.L., S.S.H., H.L., J.P.L., K.W.J., C.S.L., Y.S.K. and D.K.K. provided mentorship. Each author contributed important intellectual content during manuscript drafting. All authors provided approval for publication.
CONFLICT OF INTEREST STATEMENT
None declared. Results presented in this article have not been published previously in whole or part, except in abstract format.


Comments