


Abstract
The estimated glomerular filtration rate (eGFR) measured at 1 year is the usual benchmark applied in kidney transplantation (KT). However, acting on earlier eGFR values could help in managing KT during the first post-operative year. We aimed to assess the prognostic value for long-term graft survival of the early (3 months) quantification of eGFR and proteinuria following KT.
The 3-, 6- and 12-month eGFR using the Modified Diet in Renal Disease equation (eGFRMDRD) was determined and proteinuria was measured in 754 patients who underwent their first KT between 2000 and 2010 (with a mean follow-up of 8.3 years) in our centre. Adjusted associations with graft survival were estimated using a multivariable Cox model. The predictive accuracy was estimated using the C-index and net reclassification index. These same analyses were measured in a multicentre validation cohort of 1936 patients.
Both 3-month eGFRMDRD and proteinuria were independent predictors of return to dialysis (all P < 0.05) and there was a strong correlation between eGFR at 3 and 12 months (Spearman’s ρ = 0.76). The predictive accuracy of the 3-month eGFR was within a similar range and did not differ significantly from the 12-month eGFR in either the derivation cohort [C-index 62.6 (range 57.2–68.1) versus 66.0 (range 60.1–71.9), P = 0.41] or the validation cohort [C-index 69.3 (range 66.4–72.1) versus 71.7 (range 68.7–74.6), P = 0.25].
The 3-month eGFR was a valuable predictor of the long-term return to dialysis whose predictive accuracy was not significantly less than that of the 12-month eGFR in multicentre cohorts totalling >2500 patients. Three-month outcomes may be useful in randomized controlled trials targeting early therapeutic interventions.
INTRODUCTION
Kidney transplantation (KT) is the treatment of choice for end-stage chronic kidney disease (CKD) due to the better survival of patients treated with KT when compared with dialysis [1], as well as its cost-effectiveness [2, 3]. Short-term graft survival rates have improved markedly in recent decades, whereas long-term graft survival rates have improved only marginally. This difference is likely largely due to humoral chronic rejection, but also the greater use of grafts from expanded-criteria donors (ECDs) [4], who possibly are more prone to early graft injuries, especially ischaemia-reperfusion injury (IRI) lesions and acute calcineurin inhibitor (CNI) nephrotoxicity.
Most trials performed in the field of KT use either the outcome within days of KT [typically the percentage of delayed graft function (DGF)] or 1-year outcomes [estimated glomerular filtration rate (eGFR)] [5]. As acknowledged above, the 1-year eGFR is usually the preferred metric for measuring the success of KT. However, the use of these outcomes has not had a dramatic impact on KT in the past few years. This may be due to the outcomes not being sufficiently specific or sensitive to identify a treatment effect (DGF) or using outcomes whose measurement does not permit the inclusion of a sufficient number of patients for logistical/financial reasons (12-month eGFR). Since it appears that a larger proportion of trials are now yielding neutral results, it may be worthwhile considering performing more-focused/personalized trials, which should necessarily use optimized outcomes. Clinicians need data from new randomized controlled trials (RCTs) to establish the best therapeutic strategies according to subgroups of patients. The validation of short-term surrogate outcomes is likely to help the development of RCTs targeting early interventions aimed at preventing (among others) DGF and IRI. The development of validated surrogate endpoints is needed [6, 7].
The prognostic value of early eGFR (at 1–6 months after KT) has been studied less extensively than the 1-year eGFR [5, 8–10]. The majority of studies that have assessed the value of early eGFR quantification were performed in the 1990s [11–13] and did not specifically compare the intrinsic value of the early versus later eGFR parameters. In addition, the value of changes in eGFR between the early phase and after 1 year has not been specifically addressed.
This study was designed to assess the prognostic value for long-term graft survival of the early (3-month) quantification of eGFR and proteinuria following KT.
MATERIALS AND METHODS
Study population
This observational single-centre cohort study included all patients ≥18 years of age treated with a first isolated KT (either from a deceased- or living-donor graft) at the Nancy University Hospital from January 2000 to December 2010. Patients who died or returned to dialysis within 1 year of KT were excluded.
Data collection
Data were extracted from the derivation database of transplanted patients at the Nancy University Hospital. The ‘Comité National de l’Informatique et des Libertés’ approved the study (CNIL 891735) and written informed consent was obtained from all participants. Data were prospectively entered into a computerized database on Day 0 at 3 and 12 months and updated annually thereafter. Patients were followed annually until June 2016.
Characteristics collected at baseline included sex, age, body mass index, comorbidities, causal nephropathy, dialysis method (peritoneal dialysis or haemodialysis) and time on dialysis prior to KT, as well as the time on the waiting list. The transplantation parameters included donor type [living donors; standard-criteria donors (SCDs); and ECDs, defined as follows: donors ≥60 years of age and those age 50–59 years with at least two of the following three conditions: cerebrovascular cause of death, serum creatinine >1.5 mg/dL (132.6 µmol/L) or a history of hypertension], number of human leucocyte antigen (HLA) incompatibilities (A, B, DR and DQ), cold ischaemia time, induction therapy and maintenance immunosuppressive regimen, as well as DGF, defined by the necessity of one or more dialysis sessions in the first week after transplantation. Data collected during follow-up included acute rejection, return to dialysis and death before return to dialysis.
The results from the derivation cohort were then validated using the data extracted from the prospective French database of transplanted patients in the Données Informatisées et VAlidées en Transplantation (DIVAT) cohort [14] (www.DIVAT.fr) (French Research Ministry: RC12_0452, last agreement number: 13334, CNIL number for the cohort: 891735). The ‘Comité National de l’Informatique et des Libertés’ approved the study (CNIL 891735) and written informed consent was obtained from all participants. The 1936 patients extracted from the multicentre database who had been treated with a first KT (either from a deceased- or living-donor graft) comprised 1020 patients transplanted in Nantes University Hospital from 2000 to 2010, 572 patients transplanted in Montpellier University Hospital from 2004 to 2010 and 344 patients transplanted in Lyon University Hospital from 2007 to 2010. Patients were followed annually until December 2018. The varying time periods between centres of the validation cohorts result from the fact that centres progressively joined the consortium over time.
eGFR variables
eGFR was calculated using the Modification of Diet in Renal Disease (MDRD) formula [15] at 3, 6 and 12 months. Since the CKD Epidemiology Collaboration (CKD-EPI) eGFR [16] was strongly correlated with the MDRD eGFR (Spearman’s ρ > 0.95), the latter was not used in the subsequent analyses.
Outcome
Graft survival as defined by the return to dialysis was the sole outcome of this analysis.
Statistical methods
All analyses were performed using R software (R Foundation for Statistical Computing, Vienna, Austria). The two-tailed significance criterion was set at P < 0.05. Continuous and categorical variables are described as mean (standard deviation) and frequency (percentage) values, respectively. Correlations were quantified using the Pearson’s correlation coefficient (r).
Time-to-event analyses using Cox regression models were performed to assess the associations of eGFR and proteinuria variables with graft survival (as defined by the return to dialysis). Hazard ratios (HRs) are presented with their 95% confidence intervals (CIs). The assumption of linearity was thoroughly verified using restricted cubic splines. Since this verification identified non-linear associations, eGFR and proteinuria variables were categorized. In addition, to take into account both eGFR and proteinuria information, a 3-point categorical variable was created: a score of 0 was assigned to patients without a decreased eGFR or increased proteinuria, a score of 1 was assigned to patients with one or the other positive marker and a score of 2 was assigned to patients with both markers.
In the single-centre derivation cohort, multivariable analyses were adjusted using variables selected a priori based on available literature regardless of the P-value in the univariable analysis. The recipient’s age, HLA sensitization, heart failure history, donor type (living donor, SCD or ECD), number of HLA incompatibilities (A, B, DR and DQ), induction treatment and DGF or rejection were all considered in the models. In the multicentre validation cohort, multivariable analyses were adjusted using the recipient’s age, cardiovascular comorbidities, type of donor (living or deceased), DGF, anti-HLA Class I or II sensitization, number of HLA incompatibilities (A, B and DR; <5 or ≥5), induction treatment and occurrence of graft rejection before the evaluation time point (3- or 12-month post-KT).
Graft survival curves were produced using Kaplan–Meier analyses, with differences between the curves analysed using the log-rank test. The predictive accuracy was estimated using the C-index and the continuous net reclassification index (NRI) [17]. To better describe the individual predictive value of each eGFR and proteinuria variable, the C-indices of individual variables are provided (i.e. without taking into account clinical variables). In addition, to evaluate the value of adding these biological variables to the usual clinical variables, the increase in C-index and NRI were calculated for the addition of each eGFR and proteinuria variable (or the combination of eGFR and proteinuria variables) over a base clinical model including the same variables as the adjustment variables used in the multivariable Cox model. Finally, the prognostic performance of a selection of variables that could be used as trial outcomes was compared. In this analysis, the linear 12-month eGFR (i.e. not spline-transformed 12-month eGFR, despite the shape of the curve indicating a non-linear relationship) was used as a reference outcome, since most trials performed in the early phase following KT used the mean 12-month eGFR as the outcome.
RESULTS
Results in the single-centre derivation cohort
Most of the patients were male (60.1%) with a mean age of 48 ± 14 years (Table 1). The proportion of pre-emptive transplants was 11.5%, whereas the proportions of living donors and ECDs were 13.5 and 23.9%, respectively. The cold ischaemia time was 17.7 ± 9.8 h and DGF was observed in 36.1% of the cohort. Approximately half (52.7%) of the patients experienced graft rejection during the follow-up, with most cases observed within 12 months of KT [288/397 (72.5%) within 3 months and 343/397 (86.3%) within 12 months] (Table 2). The eGFR at 3, 6 and 12 months was ~50 ± 15 mL/min/1.73 m2 and the median proteinuria at 3, 6 and 12 months was ~0.20 g/day (range 0.12–0.40 g/day).
Baseline characteristics of transplant recipients and baseline transplantation data
| Single-centre local cohort (n = 754 patients) | Multicentre validation cohort (n = 1936 patients) | |||||
|---|---|---|---|---|---|---|
| Variables | N | Mean ± SD/n (%) | Median (Q1–Q3) | N | Mean ± SD/n (%) | Median (Q1–Q3) |
| Demographics and co-morbidities | ||||||
| Age (years) | 754 | 48 ± 14 | 49 (37–59) | 1936 | 50 ± 14 | 52 (40–60) |
| Male | 754 | 453 (60.1) | – | 1936 | 1212 (62.6) | – |
| Smoking status | 747 | – | – | 788 | – | |
| None smoker | – | 473 (63.3) | – | – | 345 (43.8) | – |
| Former smoker | – | 182 (24.4) | – | – | 202 (25.6) | – |
| Active smoker | – | 92 (12.3) | – | – | 241 (30.6) | – |
| Type of dialysis | 754 | – | – | 1935 | – | |
| Haemodialysis | – | 530 (70.3) | – | – | 1533 (79.2) | – |
| Peritoneal dialysis | – | 137 (18.2) | – | – | 159 (8.2) | – |
| Pre-emptive transplantation | – | 87 (11.5) | – | – | 243 (12.6) | – |
| Dialysis vintage (years) | 665 | 2.2 ± 2.5 | 1.6 (0.9–2.6) | 1687 | 2.9 ± 2.6 | 2.2 (1.1–3.8) |
| BMI (kg/m²) | 748 | – | – | 1921 | – | |
| <18.5 | – | 44 (5.9) | – | – | 129 (6.7) | – |
| 18.5–24.9 | – | 376 (50.3) | – | – | 1051 (54.7) | – |
| 25–29.9 | – | 215 (28.7) | – | – | 554 (28.8) | – |
| ≥30 | – | 113 (15.1) | – | – | 187 (9.7) | – |
| Baseline transplantation data | – | |||||
| HLA immunization positive Class I | 751 | 58 (7.7) | – | 1507 | 205 (13.6) | – |
| HLA immunization positive Class II | 751 | 87 (11.6) | – | 1481 | 165 (11.1) | – |
| HLA immunization positive Class I or II | 751 | 122 (16.2) | – | 1480 | 282 (19.1) | – |
| Type of donor | 754 | – | 1873 | – | ||
| Living donor | 102 (13.5) | – | – | 182 (9.7) | – | |
| SCD | 472 (62.6) | – | – | 1044 (55.7) | – | |
| ECD | 180 (23.9) | – | – | 647 (34.5) | – | |
| HLA A-B-DR incompatibilities | 753 | – | 1910 | – | ||
| 0 | 35 (4.6) | – | – | 61 (3.2) | – | |
| 1–2 | 153 (20.3) | – | – | 343 (18.0) | – | |
| 3–4 | 451 (59.9) | – | – | 1186 (62.1) | – | |
| 5–6 | 114 (15.1) | – | – | 320 (16.8) | – | |
| Cold ischaemia time (h) | 752 | 17.7 ± 9.8 | 15.6 (11.8–24.7) | 1933 | 19.0 ± 9.5 | 18.0 (13.8–24.2) |
| Induction treatment | 754 | – | – | 1936 | – | – |
| None | – | 177 (23.5) | – | – | 94 (4.9) | – |
| Anti-interleukin-2 r eceptor antibodies | – | 186 (24.7) | – | – | 908 (46.9) | – |
| Lymphocyte-depletive agent | – | 391 (51.9) | – | – | 934 (48.2) | – |
| Immunosuppressive regimen | – | – | – | – | – | – |
| Cyclosporin | 754 | 456 (60.5) | – | 1936 | 817 (42.2) | – |
| Tacrolimus | 754 | 294 (39.0) | – | 1936 | 1076 (55.6) | – |
| mTOR inhibitors | 754 | 41 (5.4) | – | 1936 | 60 (3.1) | – |
| Mycophenolate mofetil | 754 | 657 (87.1) | – | 1936 | 1624 (83.9) | – |
| Azathioprin | 752 | 8 (1.1) | – | 1936 | 12 (0.6) | – |
| Corticosteroid | 754 | 741 (98.3) | – | 1936 | 1628 (84.1) | – |
| Jak 3 inhibitor | 754 | 2 (0.3) | – | NA | – | – |
| Belatacept | 754 | 1 (0.1) | – | 1936 | 31 (1.6) | – |
NA: not available.
Kidney transplantation data during follow-up
| Single-centre local cohort (N = 754 patients) | Multicentre validation cohort (N = 1936 patients) | |||||
|---|---|---|---|---|---|---|
| Variables | N | Mean ± SD/ n (%) | Median (Q1–Q3) | N | Mean ± SD/ n (%) | Median (Q1–Q3) |
| Follow-up time, years | – | 8.3 ± 3.7 | 8.1 (5.7–11.1) | – | 7.9 ± 4.3 | 8.0 (4.1–11.0) |
| DGF | 753 | 272 (36.1) | – | 1927 | 528 (27.4) | – |
| Rejection during follow-up | 754 | 397 (52.7) | – | 1936 | 465 (24.0) | – |
| Type of first rejection | 397 | – | – | 465 | – | – |
| Borderline | – | 124 (31.2) | – | – | 97 (20.9) | – |
| Cellular | – | 138 (34.8) | – | – | 281 (60.4) | – |
| Vascular | – | 44 (11.1) | – | – | 6 (1.3) | – |
| Humoral | – | 23 (5.8) | – | – | 81 (17.4) | – |
| Undetermined | – | 68 (17.1) | – | – | 0 (0.0) | – |
| Rejection during the first 3-month period | 754 | 288 (38.2) | – | 1936 | 190 (9.8) | – |
| Rejection during the first 6-month period | 754 | 320 (42.4) | – | 1936 | 261 (13.5) | – |
| Rejection during the first year | 754 | 343 (45.5) | – | 1936 | 322 (16.6) | – |
| Time to first rejection (months) | 397 | 7.4 ± 18.8 | 1.0 (0.5–3.5) | 465 | 16.9 ± 28.0 | 4.1 (1.8–16.2) |
| Number of rejection episodes during follow-up | 754 | – | – | 1936 | – | – |
| 0 | – | 357 (47.3) | – | – | 1471 (76.0) | – |
| 1 | – | 238 (31.6) | – | – | 327 (16.9) | – |
| 2 | – | 115 (15.3) | – | – | 108 (5.6) | – |
| ≥3 | – | 44 (5.8) | – | – | 30 (1.5) | – |
| Number of rejection episodes during the first 3-month period | 754 | – | – | NA | – | – |
| 0 | – | 466 (61.8) | – | – | – | – |
| 1 | – | 226 (30.0) | – | – | – | – |
| 2 | – | 60 (8.0) | – | – | – | – |
| 3 | – | 2 (0.3) | – | – | – | – |
| Number of rejection episodes during the first year | 754 | – | – | NA | – | – |
| 0 | – | 411 (54.5) | – | – | – | – |
| 1 | – | 234 (31.0) | – | – | – | |
| 2 | – | 88 (11.7) | – | – | – | – |
| ≥3 | – | 21 (2.8) | – | – | – | – |
| 3-month creatinine (µmol/L) | 754 | 141 ± 50 | 133 (106–159) | 1936 | 143 ± 61 | 131 (104–167) |
| 6-month creatinine (µmol/L) | 731 | 139 ± 46 | 133 (106–159) | 1851 | 138 ± 55 | 128 (102–160) |
| 12-month creatinine (µmol/L) | 731 | 138 ± 43 | 133 (106–159) | 1869 | 140 ± 59 | 129 (104–160) |
| 3-month eGFR (mL/min/1.73 m²) | 754 | 49.7 ± 15.8 | 48.3 (38.8–59.6) | 1936 | 51.0 ± 20.5 | 48.5 (37.1–61.9) |
| 6-month eGFR (mL/min/1.73 m²) | 731 | 49.8 ± 15.7 | 48.4 (38.7–59.8) | 1851 | 52.4 ± 20.0 | 50.4 (38.6–63.6) |
| 12-month eGFR (mL/min/1.73 m²) | 731 | 50.0 ± 15.2 | 49.4 (39.2–59.3) | 1869 | 51.9 ± 20.4 | 49.2 (38.0–63.0) |
| 3-month proteinuria (g/day) | 618 | 0.44 ± .97 | 0.22 (0.13–0.40) | 1675 | 0.39 ± 0.96 | 0.21 (0.11–0.39) |
| 6-month proteinuria (g/day) | 595 | 0.44 ± 0.89 | 0.21 (0.12–0.41) | 1586 | 0.34 ± 0.74 | 0.20 (0.09–0.38) |
| 12-month proteinuria (g/day) | 617 | 0.42 ± 0.77 | 0.21 (0.12–0.41) | 1648 | 0.35 ± 0.65 | 0.19 (0.09–0.38) |
| Survival variables | – | – | – | – | – | – |
| Return to dialysis | – | 142 (18.8) | – | – | 419 (21.6) | – |
| Pre-emptive second transplantation | – | 3 (0.4) | – | – | NA | – |
| Graft failure (return to dialysis or pre-emptive graft) | – | 145 (19.2) | – | – | 419 (21.6) | – |
| Death before return to dialysis | – | 90 (11.9) | – | – | 269 (13.9) | – |
| Death before return to dialysis or graft failure | – | 235 (31.2) | – | – | 688 (35.5) | – |
| Long-term renal function | – | – | – | – | – | – |
| Last creatinine measurement, μmol/L | – | 15 ± 97 | 130 (97–191) | – | 178±101 | 146 (111–212) |
| Last eGFR MDRD measurement (mL/min/1.73 m²) | – | 49.3 ± 24.1 | 46.9 (30.3–64.3) | – | 43.7±22.4 | 41.7 (26.9–56.6) |
During follow-up (8.3 ± 3.7 years), 90 patients (11.9%) died, 142 (18.8%) returned to dialysis and 3 (0.4%) received a second pre-emptive transplant (Table 2). The 5- and 10-year death-censored graft survival rates were 91.0 and 79.5%, respectively. The 5- and 10-year non-death-censored graft survival rates (considering both death and return to dialysis as events) were 86.5 and 68.1%, respectively. Long-term renal function (eGFR) was 49.3 ± 24.1 mL/min/1.73 m2.
Associations of eGFR and proteinuria variables at 3, 6 and 12 months
Very strong correlations were observed between eGFR at 3 and 6 months (r = 0.83) and at 6 and 12 months (r = 0.81). A strong correlation was observed between eGFR at 3 and 12 months (r = 0.76). Most [443/731 (60.6%)] of the patients remained in the same eGFR category (i.e. <30, 30–45, 45–60 and >60 mL/min/1.73 m2) at 3 and 12 months. The eGFR category improved from 3 to 12 months in 141 patients (19.3%), whereas it decreased in 147 patients (20.1%; Table 3).
Classification of patients according to eGFR and proteinuria categories at 3 and 12 months
| 12-month eGFR | |||||
|---|---|---|---|---|---|
| 3-month eGFR | <30 (%) | 30–45 (%) | 45–60 (%) | >60 (%) | Total (%) |
| <30 | 30 (56.7) | 22 (41.5) | 1 (1.8) | 0 (0.0) | 53 (7.3) |
| 30–45 | 19 (7.9) | 150 (62.8) | 65 (27.2) | 5 (2.1) | 239 (32.7) |
| 45–60 | 3 (1.2) | 63 (24.6) | 142 (55.5) | 48 (18.7) | 256 (35.0) |
| >60 | 4 (2.2) | 2 (1.1) | 56 (30.6) | 121 (66.1) | 183 (25.0) |
| 12-month proteinuria | |||||
| 3-month proteinuria | <0.5 (%) | 0.5–1.0 (%) | 1.0–2.0 (%) | >2 (%) | Total (%) |
| <0.5 | 365 (69.5) | 40 (7.6) | 15 (2.9) | 4 (0.8) | 424 (80.8) |
| 0.5–1.0 | 41 (7.8) | 15 (2.9) | 6 (1.1) | 2 (0.4) | 64 (12.2) |
| 1.0–2.0 | 4 (0.8) | 5 (1.0) | 10 (1.9) | 4 (0.8) | 23 (4.4) |
| >2.0 | 2 (0.4) | 2 (0.4) | 3 (0.6) | 7 (1.3) | 14 (2.7) |
Similarly strong correlations were observed between proteinuria at 3 and 6 months (r = 0.68) and at 6 and 12 months (r = 0.69). In addition, 75.6% of patients remained in the same proteinuria category (i.e. <0.5, 0.5–1, 1–2 and >2 g/day) at 3 and 12 months (Table 3).
Associations of 3-, 6- and 12-month eGFR and proteinuria variables with graft survival
The associations of eGFR and proteinuria with graft survival are illustrated in Figure 1. Based on the evaluation of non-linear fits, eGFR <45 mL/min/1.73 m2 and proteinuria >0.5 g/day were subsequently used. The graft survival rates according to categories of 3-, 6- and 12-month eGFR and proteinuria variables are presented in Figure 2.
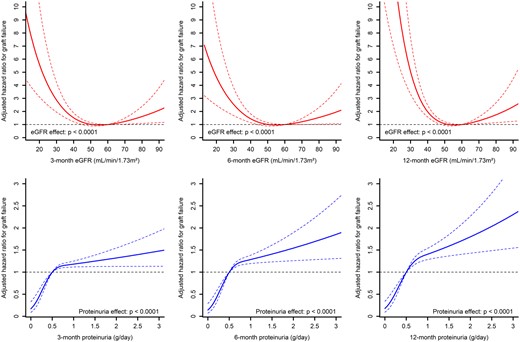
Associations between eGFR, proteinuria and death-censored graft survival in an adjusted model using restricted cubic spline with three knots.
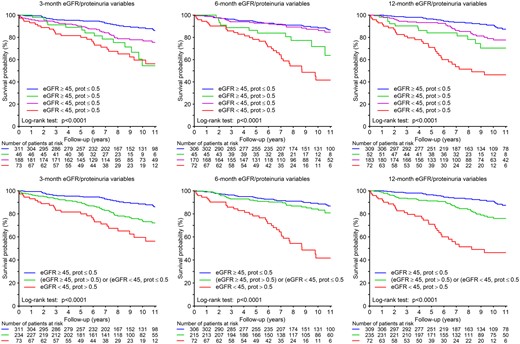
Kaplan–Meier survival curves for graft failure (with censoring for death) using 3-, 6- and 12-month eGFR and proteinuria variables (prot: proteinuria).
After adjusting for potential confounders, eGFR and proteinuria considered as continuous variables were all significantly associated with long-term graft failure (all P < 0.02; Table 4). An eGFR <30 mL/min/1.73 m2 was consistently significantly associated with a higher risk of long-term graft failure irrespective of the time point considered (HR ranging from 3.27 at 6 months to 6.86 at 12 months, all P < 0.001). Similarly, proteinuria >0.5 g/day was significantly associated with graft failure regardless of the time point (all P < 0.0001).
Association of 3-, 6- and 12-month eGFR and proteinuria with death-censored graft failure
| Univariable | Adjusted | |||
|---|---|---|---|---|
| HR (95% CI) | P-value | HR (95% CI) | P-value | |
| eGFR variables | ||||
| 3 months | ||||
| For 10 mL/min/1.73 m² increase | 0.76 (0.67–0.85) | <0.0001 | 0.80 (0.70–0.92) | 0.001 |
| <0.0001 | <0.0001 | |||
| >60 mL/min/1.73 m² (reference) | 1.00 | – | 1.00 | – |
| 45–60 | 0.83 (0.51–1.36) | 0.46 | 0.83 (0.50–1.38) | 0.47 |
| 30–45 | 1.29 (0.82–2.03) | 0.27 | 1.14 (0.68–1.91) | 0.63 |
| <30 | 4.60 (2.78–7.62) | <0.0001 | 3.65 (2.00–6.65) | <0.0001 |
| <45 mL/min/1.73 m2 | 1.98 (1.42–2.74) | <0.0001 | 1.66 (1.14–2.40) | 0.008 |
| 6 months | ||||
| For 10 mL/min/1.73 m² increase | 0.80 (0.71–0.91) | 0.0004 | 0.84 (0.74–0.97) | 0.013 |
| – | <0.0001 | – | <0.0001 | |
| >60 mL/min/1.73 m² (reference) | 1.00 | – | 1.00 | – |
| 45–60 | 0.88 (0.53–1.43) | 0.60 | 0.88 (0.53–1.47) | 0.63 |
| 30–45 | 1.15 (0.72–1.85) | 0.55 | 1.10 (0.66–1.85) | 0.71 |
| <30 | 3.88 (2.31–6.53) | <0.0001 | 3.27 (1.76–6.06) | 0.0002 |
| <45 mL/min/1.73 m2 | 1.73 (1.23–2.43) | 0.002 | 1.51 (1.04–2.20) | 0.031 |
| 12 months | ||||
| For 10 mL/min/1.73 m² increase | 0.67 (0.59–0.77) | <0.0001 | 0.69 (0.60–0.80) | <0.0001 |
| – | <0.0001 | – | <0.0001 | |
| >60 mL/min/1.73 m² (reference) | 1.00 | – | 1.00 | – |
| 45–60 | 1.03 (0.60–1.77) | 0.90 | 1.08 (0.62–1.87) | 0.78 |
| 30–45 | 1.46 (0.87–2.45) | 0.16 | 1.41 (0.81–2.47) | 0.22 |
| <30 | 7.12 (4.13–12.28) | <0.0001 | 6.86 (3.72–12.67) | <0.0001 |
| <45 mL/min/1.73 m2 | 2.21 (1.55–3.13) | <0.0001 | 1.95 (1.33–2.86) | 0.0006 |
| Proteinuria variables | ||||
| 3 months | ||||
| For 1 g/day increase | 1.24 (1.14–1.34) | <0.0001 | 1.25 (1.14–1.36) | <0.0001 |
| – | <0.0001 | – | <0.0001 | |
| <0.5 g/day (reference) | 1.00 | – | 1.00 | – |
| 0.5–1 | 1.89 (1.14–3.12) | 0.013 | 1.78 (1.06–2.98) | 0.028 |
| 1–2 | 3.64 (1.93–6.87) | <0.0001 | 2.85 (1.45–5.58) | 0.002 |
| >2 | 5.31 (2.81–10.02) | <0.0001 | 4.89 (2.56–9.33) | <0.0001 |
| >0.5 g/day | 2.69 (1.84–3.94) | <0.0001 | 2.45 (1.65–3.63) | <0.0001 |
| 6 months | ||||
| For 1 g/day increase | 1.41 (1.27–1.57) | <0.0001 | 1.42 (1.27–1.59) | <0.0001 |
| – | <0.0001 | – | <0.0001 | |
| <0.5 g/day (reference) | 1.00 | – | 1.00 | – |
| 0.5–1 | 2.70 (1.63–4.49) | 0.0001 | 2.53 (1.51–4.25) | 0.0004 |
| 1–2 | 7.51 (4.35–12.94) | <0.0001 | 6.33 (3.61–11.09) | <0.0001 |
| >2 | 3.46 (1.49–8.04) | 0.004 | 3.55 (1.51–8.37) | 0.004 |
| >0.5 g/day | 3.85 (2.59–5.72) | <0.0001 | 3.56 (2.38–5.34) | <0.0001 |
| 12 months | ||||
| For 1 g/day increase | 1.60 (1.43–1.79) | <0.0001 | 1.57 (1.38–1.77) | <0.0001 |
| – | <0.0001 | – | <0.0001 | |
| <0.5 g/day (reference) | 1.00 | – | 1.00 | – |
| 0.5–1 | 3.13 (1.92–5.11) | <0.0001 | 2.56 (1.53–4.31) | 0.0004 |
| 1–2 | 4.98 (2.86–8.69) | <0.0001 | 4.34 (2.45–7.70) | <0.0001 |
| >2 | 7.29 (3.72–14.30) | <0.0001 | 5.87 (2.91–11.81) | <0.0001 |
| >0.5 g/day | 4.04 (2.75–5.92) | <0.0001 | 3.39 (2.25–5.11) | <0.0001 |
Models were adjusted for recipient age, history of heart failure, donor type, DGF, immunization, HLA incompatibilities, induction treatment and graft rejection (prior to the considered variable, i.e. prior to 3, 6 or 12 months).
Of note, 3- and 12-month eGFR were similarly associated with non-death-censored graft failure (i.e. return to dialysis or death) (Supplementary data, Table S1).
Prognostic value of 3-month eGFR according to the occurrence of rejection during follow-up
An interaction between the prognostic value of 3-month eGFR and the occurrence of rejection at >3 months was also investigated (Supplementary data, Table S2). In patients without rejection during follow-up (>3 months), the prognostic value of the 3-month eGFR was very good [adjusted HR 0.56 (95% CI 0.46–0.68); P < 0.0001], whereas it was weaker and not significant in patients who developed graft rejection during follow-up.
No significant interaction was identified between 3-month eGFR and the risk factors of alloimmune damage (HLA-immunization: number of HLA incompatibilities, early graft loss related to rejection) (Supplementary data, Table S3).
Nominal prognostic value and added prognostic value of 3-, 6- and 12-month eGFR and proteinuria variables
The isolated C-indices (i.e. not including clinical variables; Table 5) were 62.6 (range 57.2–68.1) and 63.5 (range 58.2–68.9) for the linear and spline-transformed 3-month eGFR, respectively; the corresponding 12-month values were 66.0 (range 60.1–71.9) and 67.3 (range 61.5–73.1). Overall, 3- and 12-month proteinuria had higher nominal C-indices. The concomitant use of spline-transformed eGFR and proteinuria at 3 or 12 months exhibited the highest C-indices, at 70.8 (range 65.6–75.9) and 74.8 (range 69.5–80.0), respectively.
C-Index of eGFR and proteinuria at 3, 6 and 12 months for the risk of death-censored graft failure
| C-index (95% CI) | P-value | |
|---|---|---|
| eGFR variables | ||
| 3-month eGFR (linear) | 62.6 (57.2–68.1) | <0.0001 |
| 3-month eGFR (splines) | 63.5 (58.2–68.9) | <0.0001 |
| 3-month eGFR (<45) | 59.9 (55.6–64.2) | <0.0001 |
| 6-month eGFR (linear) | 60.3 (54.6–66.0) | 0.0004 |
| 6-month eGFR (splines) | 60.0 (54.0–66.0) | 0.001 |
| 6-month eGFR (<45) | 57.2 (52.6–61.8) | 0.002 |
| 12-month eGFR (linear) | 66.0 (60.1–71.9) | <0.0001 |
| 12-month eGFR (splines) | 67.3 (61.5–73.1) | <0.0001 |
| 12-month eGFR (<45) | 61.3 (56.8–65.8) | <0.0001 |
| Proteinuria variables | ||
| 3-month proteinuria (linear) | 68.4 (63.5–73.4) | <0.0001 |
| 3-month proteinuria (splines) | 68.4 (63.5–73.4) | <0.0001 |
| 3-month proteinuria (>0.5) | 59.5 (55.0–64.0) | <0.0001 |
| 6-month proteinuria (linear) | 70.9 (65.5–76.4) | <0.0001 |
| 6-month proteinuria (splines) | 70.9 (65.5–76.4) | <0.0001 |
| 6-month proteinuria (>0.5) | 63.7 (58.8–68.6) | <0.0001 |
| 12-month proteinuria (linear) | 73.0 (67.9–78.0) | <0.0001 |
| 12-month proteinuria (splines) | 73.0 (67.9–78.0) | <0.0001 |
| 12-month proteinuria (>0.5) | 65.6 (60.7–70.5) | <0.0001 |
| eGFR and proteinuria variables | ||
| 3-month eGFR and proteinuria (linear) | 65.5 (59.7–71.2) | <0.0001 |
| 3-month eGFR and proteinuria (splines) | 70.8 (65.6–75.9) | <0.0001 |
| 3-month eGFR and proteinuria (<45 and >0.5) | 64.7 (59.7–69.7) | <0.0001 |
| 3-month eGFR and proteinuria (3 categoriesa) | 64.1 (59.1–69.0) | <0.0001 |
| 6-month eGFR and proteinuria (linear) | 65.3 (59.2–71.5) | <0.0001 |
| 6-month eGFR and proteinuria (splines) | 71.3 (65.7–76.9) | <0.0001 |
| 6-month eGFR and proteinuria (<45 and >0.5) | 65.1 (59.3–70.9) | <0.0001 |
| 6-month eGFR and proteinuria (3 categoriesa) | 64.2 (58.5–69.9) | <0.0001 |
| 12-month eGFR and proteinuria (linear) | 71.1 (65.2–77.0) | <0.0001 |
| 12-month eGFR and proteinuria (splines) | 74.8 (69.5–80.0) | <0.0001 |
| 12-month eGFR and proteinuria (<45 and >0.5) | 70.2 (64.9–75.4) | <0.0001 |
| 12-month eGFR and proteinuria (3 categoriesa) | 69.4 (64.3–74.5) | <0.0001 |
C-indices were calculated from Cox models. When the term ‘linear’ is specified in parentheses, the biological parameter was considered as a continuous variable at the original scale. When the term ‘splines’ is specified, the biological parameter was modelled using a restricted cubic spline with three knots located at the 10th, 50th and 90th percentiles (i.e. one linear component and one cubic component). When a threshold value is specified, the biological parameter was considered as a binary variable.
eGFR > 45 and proteinuria < 0.5 versus eGFR > 45 and proteinuria > 0.5 OR = eGFR < 45 and proteinuria < 0.5 versus eGFR < 45 and proteinuria > 0.5.
Adding the 3- and 12-month eGFR and proteinuria to the usual clinical variables significantly increased the C-index in predicting graft failure (Supplementary data, Table S4), with the increase in C-index ranging from 4.4 for 3-month eGFR to 10.5 for 12-month proteinuria. Similarly, both 3- and 12-month eGFR and proteinuria were associated with significant increases in the NRI, ranging from 12.6 for 3-month eGFR to 39.2 for 12-month proteinuria. In contrast, a non-significant trend was only identified for the C-index increase and NRI related to 6-month eGFR (P = 0.06 and P = 0.07, respectively).
Importantly, no significant interactions were identified between donor type and late graft function with the prognostic value of the eGFR and proteinuria variables.
Pragmatic comparison of eGFR and proteinuria likely to be used in a trial outcome
The C-index did not differ significantly between the 3-month eGFR, 3-month eGFR/proteinuria and 12-month eGFR/proteinuria when compared with the 12-month eGFR (Figure 3). Specifically, the C-index difference for 3- and 12-month eGFRs was 3.3 in the derivation cohort and 2.4 in the validation cohort (both P > 0.20).
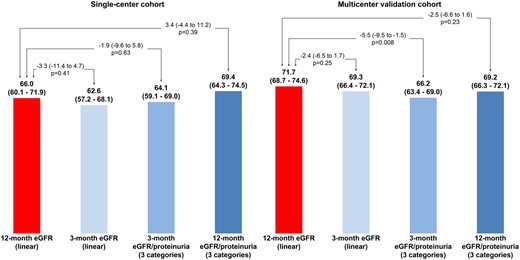
Comparison of C-indices between 12-month eGFR (linear) and other potential predictors of graft failure.
Results in the multicentre validation cohort
The proportion of males as well as the mean age in the validation cohort were similar to those in the derivation cohort, whereas the proportion of living donors was slightly lower (9.7% versus 13.5%) while the proportion of ECDs was higher (34.5% versus 23.9%) (Table 1). The proportion of patients with HLA sensitization at baseline did not differ significantly between the two cohorts. During the follow-up (7.9 ± 4.3 years), 419 patients (21.6%) returned to dialysis and 269 patients (13.9%) died with a functioning graft. Long-term renal function (eGFR) was 43.7 ± 22.4 mL/min/1.73 m2.
In multivariable analyses, eGFR <45 mL/min/1.73 m2 as well as proteinuria >0.5 g/day at 3 or 12 months were found to be associated with long-term death-censored graft survival (Supplementary data, Table S5). The predictive accuracy of the 3-month eGFR did not differ significantly from that of the 12-month eGFR [ΔC-index –2.4 (range –6.5–1.7), P = 0.25] (Figure 3), whereas that of the 3-month eGFR/proteinuria categories was significantly lower [ΔC-index −5.5 (range –9.5 to –1.5), P = 0.008].
C-indices were also calculated for eGFR estimated with the CKD-EPI formula, with very similar values to those found with the MDRD formula (Supplementary data, Tables S6 and S7).
DISCUSSION
The main finding of this study is that 3-month eGFR and proteinuria are valuable predictors of a long-term return to dialysis. Of particular note, the predictive accuracy of the 3-month eGFR was not significantly less than that of the 12-month eGFR in both the validation cohort (P = 0.50) and the derivation cohort (P= 0.25), despite the cohorts totalling >2500 patients and involving 561 events.
Predictive values of eGFR and proteinuria variables measured within 1 year of KT for graft rejection
The predictive value of the 3-month eGFR has been studied previously [12]. Marcen et al. [18] showed that the 3-month eGFR was associated with the subsequent eGFR slope from 3 to 12 months following KT. Hernandez et al. [13] evaluated the association of the interplay of the 3-month albuminuria and eGFR in 784 patients receiving deceased-donor KTs from 1996 to 2005 [13]. They reported that the risk of graft failure was significantly higher in patients with both low-grade proteinuria and eGFR <60 mL/min/1.73 m2 [adjusted HR 2.2 (95% CI 1.3–3.7); P = 0.003]. However, their study did not assess the prognostic value eGFR/proteinuria (using the C-index and/or NRI) and did not compare the predictive performance of eGFR at various time points. Consequently, our study appears to be the first to perform a head-to-head comparison of the 3- and 12-month eGFR and proteinuria variables with regard to subsequent graft rejection.
Other analyses of interest related to varying assessment time points following KT are worth mentioning. Yoo et al. [19] used machine-learning methods, in combination with survival statistics, to establish prediction models of graft survival based on immunological, recipient and donor variables, including serum creatinine at 3 and 6 months. In the produced decision tree, the 3-month serum creatinine level was identified at the first decision node, consequently being the most important risk factor of graft failure. Wan et al. [20] studied ‘renal function recovery’ (RFR), defined as the ratio of recipient eGFR to half the donor eGFR (last serum creatinine prior to organ procurement). In addition to the fact that RFR ≥1 was associated with better death-censored graft survival, the authors found that the 3-month eGFR was also associated with better graft survival, with no difference in the C-statistic between the predictive value of 3‐month eGFR and the predictive value of RFR.
In this study we were able to identify a useful predictive value of the 3-month variables with regard to graft loss. The nominal C-index of the 3-month eGFR was close to the C-index derived from the 12-month eGFR in both the derivation cohort [–3.3 (range –11.4–4.7), P = 0.41; Figure 3] and the validation cohort [–2.4 (range –6.5–1.7), P = 0.25; Figure 3]. These results suggest that early risk stratification using the 3-month eGFR (used as a continuous variable) is achievable, which could help clinicians in managing these patients, including the applied therapeutic strategies.
We carefully studied the shape of the associations of eGFR and proteinuria with the outcome and found that eGFR <45 mL/min/1.73 m2 and proteinuria >0.5 g/day appeared to be the most appropriate cut-off points in our population. The use of these cut-offs significantly improved the ability of the C-index and NRI to predict the risk of graft failure in addition to the usual variables. This further helped in constructing a very simple 3-point variable featuring good risk prediction properties: a score of 0 refers to patients with eGFR >45 mL/min/1.73 m2 and proteinuria <0.5 g/day, a score of 1 refers to patients with one risk marker and a score of 2 refers to patients with two risk markers. This simple variable had a useful predictive accuracy in the derivation cohort, although this accuracy was lower in the validation cohort (Figure 3).
In 2010, Foucher et al. published the kidney transplant failure score [21]. This score was constructed to predict long-term graft outcome based on a 12-month evaluation, which includes baseline characteristics and 3- and 12-month follow-up data (including 3- and 12-month creatinine, 12-month proteinuria and acute rejection during the first year). Another recent study from Fournier et al. [22] aimed to provide a prognostic tool—the ‘Dynamic prediction of Patient and Graft survival’ (DynPG)—for shared decision-making with patients using baseline characteristics, the levels of 3- and 12-month creatinine, the occurrence of an acute rejection episode in the first year post-transplantation, as well as the level of creatinine during a follow-up visit. The aim of the DynPG is to provide an estimation of long-term graft survival in order to reinforce patient adherence.
In contrast to these two previous studies, our study aimed to provide a very pragmatic validation of early graft data (eGFR, proteinuria) in order to help conduct RCTs targeting early interventions in the field of KT, by reducing follow-up time and consequently the costs of the studies. Obviously, more data acquired during a longer follow-up will result in better prediction. However, using 12-month data, by nature, will prevent the prediction of early events, i.e. from 3 to 12 months. The overall philosophy of our approach is consequently quite different.
Of note, Scheffner et al. [23] constructed a random survival forest analysis for patient survival at 3 and 12 months post-transplantation. The capacity of death prediction was very similar to the two time points (Harrel’s C index 0.77 and 0.78, respectively). The performances of the random forest analyses of 3- and 12-month eGFR in predicting death were similar.
Implications of the present results when choosing primary outcomes in future clinical trials
Long-term graft survival is typically the main concern of both clinicians and patients [24], although such survival is not used as the primary outcome of clinical trials due to its impracticability—using this outcome would result in lengthy trials and associated high costs. As acknowledged above, the 1-year eGFR is usually the preferred metric in clinical trials since it is a good surrogate marker for long-term graft survival [8, 25]. The good prognostic value of the 12-month eGFR has been promoted by Hariharan et al. [8] (in an article cited >600 times) based on the analysis of 105 742 KT patients. Kasiske et al. [25] also reported that the 12-month eGFR was strongly associated with subsequent graft loss.
In the setting of a clinical trial, time is money, and using a 1-year outcome is associated with considerable costs, which has consequently reduced the number of trials—and hence the number of hypotheses that have been tested—in the field of KT. Even if using a 12-month surrogate marker results in a dramatic increase in trial feasibility and decreased cost, further shortening the follow-up duration could increase the practicability of performing more trials that test hypotheses related to KT. This could be of particular interest in evaluating early therapeutic interventions targeting IR or DGF. It is noteworthy that there has been no consensus stemming from several previous trials regarding the use of a 1-month renal outcome [26, 27], a 12-month primary outcome [28, 29] or both early and later outcomes (i.e. 1, 3, 6 and 12 months) [30]. However, 3-month renal function outcomes are obviously not reliable for RCTs assessing strategies to reduce long-term nephrotoxicity, such as CNI minimization protocols.
These results suggest that the predictive performance with variables measured at 3 months after KT can be comparable to those obtained with 12-month variables. Indeed, the C-index of the linear 12-month eGFR was not significantly higher than the C-index of the linear 3-month eGFR in either the derivation or validation cohort, despite the larger number of events in each cohort. This suggests that changing the primary outcome from the 12- to the 3-month eGFR could provide similar prognostic value with regard to long-term graft rejection while obviously decreasing the length of the follow-up within a trial by 75%. This could have a major impact on the feasibility and cost of clinical trials in the field of KT while providing results from a surrogate whose association/prognostic properties are similar to those of the current 12-month gold standard.
Of note, in patients without rejection during follow-up, the prognostic value of the 3-month eGFR is very good, whereas it is not significant in patients who develop graft rejection during follow-up. This significant interaction between the occurrence of rejection and the prognostic value of 3-month eGFR likely confirms the fact that early GFR assessment could represent a valuable outcome in trials targeting IR, with a major impact on non-immunological factors. Obviously, in patients with rejection, the impairment of renal function is the consequence of rejection, and thus the prognostic value of 3-month renal function is reduced.
The recently published prediction system for risk of allograft loss in patients receiving kidney transplants, namely the iBox, will certainly provide a very enthusiastic new tool in the future in various clinical settings and will possibly be used as a surrogate marker in RCTs focusing on the prevention of rejection and immunosuppressive strategies [31]. Nevertheless, it should be emphasized that this score necessitates a histological evaluation of the graft, which is not always required in RCTs, in particular for interventions targeting IR or the prevention of DGF. Of note, the iBox is a time-adjusted prediction score (as it can be performed irrespective of the time point after transplantation), whereas the previously published scores comprising immunological parameters (histological findings at 1-year surveillance biopsy and/or serum donor-specific alloantibody) were based on an a priori–determined 12-month post-KT evaluation time point [32, 33].
Of note, current endpoints in RCTs assessing immunosuppressive drugs must be validated by the proper authorities [such as Food and Drug Administration (FDA) or European Medicines Agency]. A similar approach should be developed for non-immunological interventions targeting IR. We believe that this study could pave the way to other studies for the validation of endpoints in this specific area. The FDA workshop on IRI in KT [34] emphasized in 2011 that clearly defined endpoints should be established to demonstrate a beneficial effect of interventions targeting IR. While the improvement of long-term patient and graft survival is the ultimate goal, the latter also includes a decrease in DGF, which is associated with morbidity and longer hospitalization duration. Also mentioned was that long-term outcomes (improvement of patient survival in comparison to dialysis) could be evaluated at 6 and 12 months after transplantation. Moreover, the definition of DGF has certain limitations [35, 36], and there is currently no validated outcome in this field.
Limitations
Certain limitations of this study should be acknowledged. Graft biopsies were not systematically performed in some of the centres in the absence of suspicion of graft rejection. Nevertheless, many centres currently only perform biopsies for a clinical indication and the requirement of systematic histological evaluation may limit the participation of these centres to RCT, for logistical reasons. We also relied on eGFR rather than the measured GFR. However, this is consistent with eGFR likely being the standard of care for monitoring renal function during the follow-up following KT in most centres worldwide. Finally, some of the eGFR measurements at 3 months were carried out during a period of renal function instability. However, this situation would also have been the case in a clinical trial using a 3-month primary outcome.
All of the collected rejection episodes were biopsy-proven. Of note, the proportion of rejection was high in the single-centre study; however, a large proportion of the rejection episodes represented rejections of borderline significance. In addition, a high proportion of patients were under cyclosporine in the single-centre study, which could decrease the generalization of these results to other clinical settings. Nevertheless, the proportion of patients taking cyclosporine was much lower in the multicentre validation cohort, in which a similar association was observed between 3-month eGFR and graft survival.
CONCLUSION
The 3-month eGFR and proteinuria are good predictors of the long-term return to dialysis for KT patients. Using 3-month eGFR measurements for predicting long-term graft loss appears comparable to using the 12-month eGFR. This suggests that, in selected RCTs, the 3-month eGFR could represent a reasonably accurate surrogate marker of long-term graft survival, whose use would markedly shorten the follow-up period, decrease associated costs and increase the feasibility of application, in particular for early interventions targeting IR or DGF.
CONFLICT OF INTEREST STATEMENT
Dr. Rossignol reports grants and personal fees from AstraZeneca, Bayer, CVRx, Fresenius, and Novartis, personal fees from Grunenthal, Servier, Stealth Peptides, Vifor Fresenius Medical Care Renal Pharma, Idorsia, NovoNordisk, Ablative Solutions, G3P, Corvidia, Relypsa, and is the cofounder of CardioRenal, a company developing a telemonitoring loop in heart failure (including potassium measurements).
ACKNOWLEDGEMENTS
Since its inception, the DIVAT cohort has been financed by an industrial charity-type sponsor to store and secure the data and to organize the running of the network. We also wish to thank the DIVAT clinical research assistants, as well as the following medical physicians, surgeons and HLA biologists: Nantes: Gilles Blancho, Julien Branchereau, Diego Cantarovich, Agnès Chapelet, Jacques Dantal, Clément Deltombe, Lucile Figueres, Claire Garandeau, Caroline Gourraud-Vercel, Maryvonne Hourmant, Georges Karam, Clarisse Kerleau, Aurélie Meurette, Simon Ville, Christine Kandell, Anne Moreau, Karine Renaudin, Anne Cesbron, Florent Delbos, Alexandre Walencik and Anne Devis; Nancy: Valérie Eschbach, Pascal Eschwege, Jacques Hubert, Emmanuelle Laurain, Louis Leblanc, Pierre Lecoanet and Jean-Louis Lemelle; Lyon: Lionel Badet, Maria Brunet, Rémi Cahen, Sameh Daoud, Coralie Fournie, Arnaud Grégoire, Alice Koenig, Charlène Lévi, Claire Pouteil-Noble, Thomas Rimmelé and Olivier Thaunat; Montpellier: Sylvie Delmas, Valérie Garrigue, Moglie Le Quintrec, Vincent Pernin and Jean-Emmanuel Serre. We also wish to thank the data manager of the DIVAT cohort (Clarisse Kerleau) and members of the clinical research assistant team (S. Le Floch, C. Scellier, V. Eschbach, K. Zurbonsen, C. Dagot, F. M’Raiagh and V. Godel). We are grateful to Roche Pharma, Novartis, Atsellas and Sanofi Laboratories for financially supporting the DIVAT cohort.
REFERENCES
Food and Drug Administration Centre for Drug Evaluation and Research. Surrogate Endpoints In Clinical Trials of Kidney Transplantation. 2015. https://www.fda.gov/downloads/Drugs/NewsEvents/UCM470429.pdf
Données Informatisées et VAlidées en Transplantation. www.divat.fr
Author notes
Clément Mottola and Nicolas Girerd contributed equally to this work.
Données Informatisées et VAlidées en Transplantation: DIVAT Cohort Collaborators are listed in the Acknowledgements section.


Comments