


Abstract
High-dose (HD) influenza vaccine offers improved protection from influenza virus infection among older adults compared with standard-dose (SD) vaccine. Here, we explored whether HD vaccine attenuates disease severity among older adults with breakthrough influenza.
This was a retrospective cohort study of US claims data for influenza seasons 2016–2017, 2017–2018, and 2018–2019, defined as 1 October through 30 April, among adults aged ≥65 years. After adjusting the different cohorts for the probability of vaccination conditional on patients’ characteristics, we compared 30-day mortality rate post-influenza among older adults who experienced breakthrough infection after receipt of HD or SD influenza vaccines and among those not vaccinated (NV).
We evaluated 44 456 influenza cases: 23 109 (52%) were unvaccinated, 15 037 (33.8%) received HD vaccine, and 6310 (14.2%) received SD vaccine. Significant reductions in mortality rates among breakthrough cases were observed across all 3 seasons for HD vs NV, ranging from 17% to 29% reductions. A significant mortality reduction of 25% was associated with SD vaccination vs NV in the 2016–2017 season when there was a good match between circulating influenza viruses and selected vaccine strains. When comparing HD vs SD cohorts, mortality reductions were higher among those who received HD in the last 2 seasons when mismatch between vaccine strains and circulating H3N2 viruses was documented, albeit not significant.
HD vaccination was associated with lower post-influenza mortality among older adults with breakthrough influenza, even during seasons when antigenically drifted H3N2 circulated. Improved understanding of the impact of different vaccines on attenuating disease severity is warranted when assessing vaccine policy recommendations.
In the past decade, seasonal influenza has been associated with 12 000–52 000 deaths per year in the United States, with 70%–80% occurring in people aged ≥65 years [1]. Influenza vaccination is the best way to prevent infection, although protection afforded by vaccination varies substantially from year to year, depending on the characteristics of the circulating viruses and how well they match vaccine-selected strains [2]. The high-dose (HD) influenza vaccine, licensed for persons aged ≥65 years, contains 4 times more antigen than standard-dose (SD) vaccines, inducing significantly higher antibody responses that correlate with better protection against laboratory-confirmed influenza [3–7]. Nonetheless, some studies that compared HD vs SD vaccines have shown varying levels of vaccine protection depending on season, virus type or subtype, and the outcome being measured [2, 8–12].
Considering the extent of complications and disabilities associated with influenza among older adults [13, 14], researchers have explored the impact of vaccines in disease attenuation among those who develop influenza despite being vaccinated, that is, breakthrough cases [15]. Breakthrough cases have been associated with reduced admissions to the intensive care unit, shorter hospital stays, and fewer deaths. The precise mechanism of disease attenuation is unknown but likely involves multiple pathways, including immune-memory response [16]. Understanding the spectrum of protection afforded by influenza vaccination and whether one vaccine performs better in preventing complications is important when considering policy recommendations. In August 2022, the US Advisory Committee on Immunization Practices recommended that adults aged ≥65 years preferentially receive enhanced vaccines such as higher dose, recombinant, or adjuvanted influenza vaccines instead of SD vaccines [17].
We used real-world data to compare the 30-day post-influenza mortality rate among cohorts of adults aged ≥65 years who experienced breakthrough infection after receipt of HD or SD influenza vaccines and among those not vaccinated (NV) during seasons when vaccine effectiveness for this age group was estimated to be low to moderate against influenza A/H3N2 [8, 18–20].
METHODS
Data Source and Study Population
We used data derived from a database of administrative health claims for members of large commercial and Medicare Advantage health plans—Optum's deidentified Clinformatics Data Mart (CDM) Database (2007–2021). Influenza seasons 2016–2017, 2017–2018, and 2018–2019 used in the analysis were defined as from 1 October 1 through 30 April of the following year. The cohorts for each season were independently derived, and patients could contribute data to more than 1 season (Supplementary Table 1).
The study included adults aged ≥65 years at the start of each influenza season with an emergency department (ED) visit or inpatient admission (index event) and with an influenza diagnosis (International Classification of Diseases [ICD], 10th Revision, codes) in any position (Supplementary Table 2) [10, 21, 22]. If a patient had more than 1 influenza-related ED visit or hospitalization during the same season, the first ED visit or hospitalization was selected as the index event. In the case that a second influenza-related ED visit or hospitalization occurred within 14 days of the first encounter, the 2 events were considered related, and the second encounter was used as the index event. The index event date was used to define the beginning of the follow-up period.
Patients were required to have at least 1 year of continuous enrollment prior to the index date (baseline period; Supplementary Figure 1). The look-back period for vaccination was from 1 July to 14 days prior to the index date. Those who received more than 1 vaccine were excluded. For nonvaccinated patients, we looked from 1 July through the whole season. Patients who were living in skilled nursing facilities or who had evidence of any residential care during the baseline period (both defined by the Optum CDM place-of-service code) were excluded because they are a frailer population and their probability of receiving certain vaccines would likely differ from community-dwelling adults, raising biases that would be difficult to address in the analysis [10, 22, 23].
Exposure and Outcome Definitions
Influenza vaccinations (HD or SD) were identified through Current Procedural Terminology codes and the National Drug Code (NDC) from the Medical Services and Pharmacy Claims tables in Optum CDM (Supplementary Tables 3 and 4). A patient was considered vaccinated if the vaccine was received ≥14 days before the index date. The primary outcome was death within 30 days of the post-influenza diagnosis at the ED or hospitalization (index event date). Because only information on month of death was available, a specific date of death was imputed as the 15th of each month or the last activity date registered in the medical records (whatever came later).
Covariates
The following demographic characteristics were measured at the index event date: age (derived from birth year), sex, US region, and race/ethnicity. Clinical characteristics were assessed throughout the baseline period, including comorbidities (ie, endocrine disorders, asthma, liver disease, renal disease, neurologic disease, blood disorders, cardiovascular disease, chronic lung disease, chronic metabolic disease, and immunosuppression; Supplementary Tables 5 and 6). Dementia, history of falls, fractures, home oxygen use, home urinary catheter use, and the total number of comorbidities were used as proxies for frailty status based on a previous publication (Supplementary Tables 7–13) [22]. Presence of comorbidity and frailty status was defined if at least 1 related medical encounter occurred during the baseline period. We also used the number of all-cause inpatient admissions and ED visits (categorized as zero, 1, >1) during the baseline period as a proxy for frailty and/or overall health status.
Statistical Analyses
In contrast to clinical trials where interventions are assigned randomly, vaccine assignment in routine care is often influenced by a person's characteristics (eg, age, place of residence, race/ethnicity, socioeconomic status, disease severity, healthcare-seeking behavior, overall health status). Thus, we explored 3 methodological approaches to determine which would most effectively minimize patient baseline differences associated with the probability of receiving a certain vaccine in order to reduce confounding and biases associated with care or access to vaccination and specific vaccine type when comparing patient cohorts (ie, HD vs NV, HD vs SD, and SD vs NV). For propensity score matching (PSM) and inverse probability of treatment weighting, propensity scores were derived from a logistic regression model that predicted receipt of HD (or SD when comparing with NV) based on observed baseline characteristics [24, 25]. The third method used was entropy balancing, where patient weights were directly calculated to satisfy a set of specified moment conditions including the covariates’ mean, standard deviation, and skewness [26]. All the covariates listed above were included in the matching, weighing, and balancing estimation models. More details are provided in the Supplementary Material, Statistical Methods.
Demographic and clinical baseline characteristics were summarized for patient cohorts before and after balancing methods for each season separately. The overall balance between the groups on individual baseline characteristics was assessed using standardized mean differences (SMD), with SMD ≥0.1 considered a sign of imbalance.
To determine which method best balanced the various cohorts, we compared the absolute SMD obtained by each method per season. Results from the model that best balanced the comparison groups are presented in the Results Section.
The mortality rate (or incidence rate per 100 person-days) was described for each comparison group and by season, and it was compared using a Poisson regression with a robust error variance and offset term to account for person-time to provide the mortality rate ratio (or incidence rate ratio [IRR]) with its associated 95% confidence interval (CI). The Poisson regression model included any covariates with residual imbalance (ie, SMD ≥0.1 after applying each balancing method) [27]. As a proxy for differences in timing and access to specific vaccines, intensity and type of circulating viruses, and varying population immunity during the season, we included calendar time (in weeks) in the model using a natural cubic spline term with 3 internal knots placed at the quartiles.
Analyses were conducted using R v4.0.2 (R Foundation for Statistical Computing, Vienna, Austria) and Python v3.7.12 (Python Software Foundation, Beaverton, OR). The R packages included Matchit, WeightIt, and cobalt, and the Python packages included scikit-learn and lightgbm.
Sensitivity Analyses
We conducted 3 sensitivity analyses (Supplementary Material, Statistical Methods). First, to quantify the impact of a potential misclassification on exposure and its association with mortality, we did a sensitivity analysis with varying levels of vaccination misclassifications, as claims data may miss vaccinations that occur outside of the healthcare system (eg, workplaces, public health clinics). Second, we looked at the potential impact of influenza diagnosis misclassification by restricting our analysis to a subset of patients with influenza-specific ICD codes listed as the primary (ie, first position) diagnosis. Last, we explored the potential of residual confounding by using urinary tract infection (UTI)-related ED visits or hospitalizations 30-day post-influenza (index case) as a negative control outcome [28]. Our negative control outcome was chosen because it shares the same potential sources of bias with our primary outcome but cannot plausibly be related to influenza vaccination.
Ethics
The study was exempt from institutional review board approval because it was based on preexisting deidentified data.
RESULTS
Baseline Characteristic of the Study Population
During the seasons 2016–2017 through 2018–2019, we identified 72 966 patients aged ≥65 years with a diagnosis of influenza who were seen at the ED or hospitalized. Of those, 44 456 (61%) met the inclusion criteria; 10 374 in the 2016–2017 season, 22 999 in the 2017–2018 season, and 11 083 in the 2018–2019 season (Figure 1). The majority (>85%) had an influenza diagnosis in the first or second position for their index event (Supplementary Table 14). Before balancing, mortality rates were slightly higher among the NV cohort (from 3.4% in the 2018–2019 season to 5.9% in the 2017–2018 season) compared with the SD cohort (from 2.8% in the 2016–2017 season to 4% in the 2017–2018 season) and the HD cohort (2% in the 2017–2018 season to 2.9% in 2018–2019 season) groups (Supplementary Tables 15 and 16).
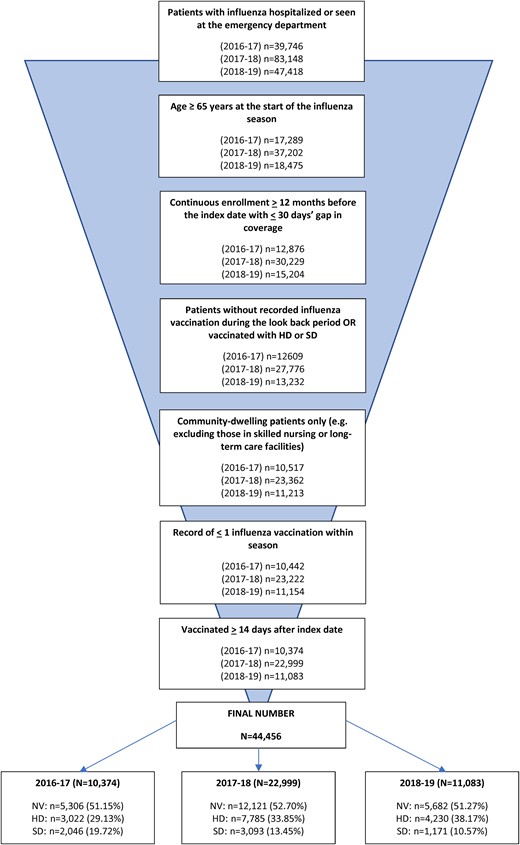
Patient cohort selection process. Abbreviations: HD, high-dose influenza vaccine; NV, not vaccinated; SD, standard-dose influenza vaccine.
There were differences in the baseline characteristics of patients by vaccination status (Table 1). Overall, the NV cohort was younger than their vaccinated counterparts, and the HD cohort was slightly older than the SD group. During the 2018–2019 season, all 3 cohorts were relatively younger than the cohorts from the previous seasons. Black and Hispanic groups were less represented in the HD cohort compared with the SD and NV cohorts. There was also heterogeneity in vaccination status by region and comorbidity status, and the SD cohort had higher rates of prior ED visits and hospitalizations and higher frailty measures compared with the HD cohort.
Baseline Patient Characteristics for Each Influenza Season Stratified by Vaccination Status
| Characteristic | 2016–2017 Influenza Season (N = 10 374) | 2017–2018 Influenza Season (N = 22 999) | 2018–2019 Influenza Season (N = 11 083) | ||||||
|---|---|---|---|---|---|---|---|---|---|
| SD (N = 2046) | HD (N = 3022) | NV (N = 5306) | SD (N = 3093) | HD (N = 7785) | NV (N = 12 121) | SD (N = 1171) | HD (N = 4230) | NV (N = 5682) | |
| Age at admission date, y | |||||||||
| Median [min; max] | 78.0 [65.0; 90.0] | 79.0 [65.0; 90.0] | 76.0 [65; 90] | 78.0 [65.0; 90.0] | 78.0 [65.0; 90.0] | 76.0 [65.0; 90.0] | 75.0 [65.0; 90.0] | 77.0 [65.0; 90.0] | 75.0 [65.0; 90.0] |
| Age at admission date (categorical), y | |||||||||
| 65–74 | 772 (37.7%) | 923 (30.5%) | 2228 (42.0%) | 1190 (38.5%) | 2648 (34.0%) | 5438 (44.9%) | 542 (46.3%) | 1598 (37.8%) | 2743 (48.3%) |
| 75–84 | 751 (36.7%) | 1234 (40.8%) | 1871 (35.3%) | 1133 (36.6%) | 3083 (39.6%) | 4164 (34.4%) | 439 (37.5%) | 1712 (40.5%) | 2008 (35.3%) |
| ≥85 | 523 (25.6%) | 865 (28.6%) | 1207 (22.7%) | 770 (24.9%) | 2054 (26.4%) | 2519 (20.8%) | 190 (16.2%) | 920 (21.7%) | 931 (16.4%) |
| Sex | |||||||||
| Female | 1157 (56.5%) | 1719 (56.9%) | 3064 (57.7%) | 1790 (57.9%) | 4489 (57.7%) | 7129 (58.8%) | 677 (57.8%) | 2403 (56.8%) | 3355 (59.0%) |
| Male | 889 (43.5%) | 1301 (43.1%) | 2242 (42.3%) | 1303 (42.1%) | 3296 (42.3%) | 4990 (41.2%) | 494 (42.2%) | 1827 (43.2%) | 2327 (41.0%) |
| Unknown | 0 (0.0%) | 2 (0.1%) | 0 (0.0%) | 0.00% | 0.00% | 2 (0.0%) | 0.00% | 0.00% | 0 (0.0%) |
| Race | |||||||||
| White | 1376 (67.3%) | 2263 (74.9%) | 3395 (64.0%) | 1977 (63.9%) | 5601 (71.9%) | 7603 (62.7%) | 737 (62.9%) | 2979 (70.4%) | 3415 (60.1%) |
| Asian | 76 (3.7%) | 72 (2.4%) | 115 (2.2%) | 112 (3.6%) | 203 (2.6%) | 269 (2.2%) | 30 (2.6%) | 98 (2.3%) | 108 (1.9%) |
| Black | 302 (14.8%) | 312 (10.3%) | 883 (16.6%) | 439 (14.2%) | 872 (11.2%) | 1893 (15.6%) | 185 (15.8%) | 538 (12.7%) | 918 (16.2%) |
| Hispanic | 225 (11.0%) | 257 (8.5%) | 688 (13.0%) | 434 (14.0%) | 780 (10.0%) | 1820 (15.0%) | 166 (14.2%) | 418 (9.9%) | 926 (16.3%) |
| Missing | 67 (3.3%) | 118 (3.9%) | 225 (4.2%) | 131 (4.2%) | 329 (4.2%) | 536 (4.4%) | 53 (4.5%) | 197 (4.7%) | 315 (5.5%) |
| US region | |||||||||
| 1: CT, ME, MA, NH, RI, VT | 93 (4.5%) | 133 (4.4%) | 224 (4.2%) | 114 (3.7%) | 307 (3.9%) | 346 (2.9%) | 65 (5.6%) | 253 (6.0%) | 291 (5.1%) |
| 2: NJ, NY, PR, VI | 154 (7.5%) | 176 (5.8%) | 325 (6.1%) | 207 (6.7%) | 404 (5.2%) | 722 (6.0%) | 84 (7.2%) | 306 (7.2%) | 379 (6.7%) |
| 3: DE, DC, MD, PA, VA, WV | 74 (3.6%) | 88 (2.9%) | 149 (2.8%) | 77 (2.5%) | 239 (3.1%) | 276 (2.3%) | 30 (2.6%) | 149 (3.5%) | 185 (3.3%) |
| 4: AL, FL, GA, KY, MS, NC, SC, TN | 549 (26.8%) | 700 (23.2%) | 1447 (27.3%) | 791 (25.6%) | 1699 (21.8%) | 3565 (29.4%) | 357 (30.5%) | 1119 (26.5%) | 1944 (34.2%) |
| 5: IL, IN, MI, MN, OH, WI | 296 (14.5%) | 605 (20.0%) | 862 (16.2%) | 448 (14.5%) | 1505 (19.3%) | 1841 (15.2%) | 140 (12.0%) | 649 (15.3%) | 664 (11.7%) |
| 6: AR, LA, NM, OK, TX | 296 (14.5%) | 369 (12.2%) | 800 (15.1%) | 488 (15.8%) | 1193 (15.3%) | 2003 (16.5%) | 214 (18.3%) | 593 (14.0%) | 899 (15.8%) |
| 7: IA, KS, MO, NE | 114 (5.6%) | 200 (6.6%) | 266 (5.0%) | 162 (5.2%) | 594 (7.6%) | 606 (5.0%) | 47 (4.0%) | 225 (5.3%) | 216 (3.8%) |
| 8: CO, MT, ND, SD, UT, WY | 93 (4.5%) | 223 (7.4%) | 368 (6.9%) | 101 (3.3%) | 439 (5.6%) | 605 (5.0%) | 43 (3.7%) | 226 (5.3%) | 287 (5.1%) |
| 9: AZ, CA, GU, HI, NV | 226 (11.0%) | 285 (9.4%) | 484 (9.1%) | 610 (19.7%) | 1097 (14.1%) | 1734 (14.3%) | 122 (10.4%) | 399 (9.4%) | 539 (9.5%) |
| 10: AK, ID, OR, WA | 147 (7.2%) | 235 (7.8%) | 366 (6.9%) | 88 (2.8%) | 286 (3.7%) | 381 (3.1%) | 63 (5.4%) | 301 (7.1%) | 260 (4.6%) |
| Missing | 4 (0.2%) | 8 (0.3%) | 15 (0.3%) | 7 (0.2%) | 22 (0.3%) | 42 (0.3%) | 6 (0.5%) | 10 (0.2%) | 18 (0.3%) |
| Presence of comorbidity | |||||||||
| Asthma | 324 (15.8%) | 459 (15.2%) | 608 (11.5%) | 502 (16.2%) | 1121 (14.4%) | 1434 (11.8%) | 199 (17.0%) | 641 (15.2%) | 688 (12.1%) |
| Chronic lung disease | 713 (34.8%) | 901 (29.8%) | 1477 (27.8%) | 1088 (35.2%) | 2490 (32.0%) | 3413 (28.2%) | 442 (37.7%) | 1501 (35.5%) | 1762 (31.0%) |
| Cardiovascular disease | 1300 (63.5%) | 1807 (59.8%) | 2874 (54.2%) | 1997 (64.6%) | 4746 (61.0%) | 6757 (55.7%) | 739 (63.1%) | 2699 (63.8%) | 3167 (55.7%) |
| Chronic metabolic disease | 926 (45.3%) | 1123 (37.2%) | 2041 (38.5%) | 1347 (43.5%) | 3110 (39.9%) | 4720 (38.9%) | 571 (48.8%) | 1752 (41.4%) | 2253 (39.7%) |
| Neurologic disease | 171 (8.4%) | 257 (8.5%) | 391 (7.4%) | 252 (8.1%) | 548 (7.0%) | 813 (6.7%) | 78 (6.7%) | 289 (6.8%) | 339 (6.0%) |
| Immunosuppression | 474 (23.2%) | 688 (22.8%) | 976 (18.4%) | 723 (23.4%) | 1921 (24.7%) | 2238 (18.5%) | 264 (22.5%) | 1007 (23.8%) | 1086 (19.1%) |
| Blood disorders | 189 (9.2%) | 190 (6.3%) | 311 (5.9%) | 246 (8.0%) | 544 (7.0%) | 787 (6.5%) | 108 (9.2%) | 319 (7.5%) | 375 (6.6%) |
| Endocrine disorders | 582 (28.4%) | 901 (29.8%) | 1316 (24.8%) | 907 (29.3%) | 2375 (30.5%) | 3135 (25.9%) | 348 (29.7%) | 1256 (29.7%) | 1498 (26.4%) |
| Renal disorders | 625 (30.5%) | 818 (27.1%) | 1191 (22.4%) | 968 (31.3%) | 2288 (29.4%) | 2995 (24.7%) | 366 (31.3%) | 1216 (28.7%) | 1376 (24.2%) |
| Liver disorders | 76 (3.7%) | 64 (2.1%) | 178 (3.4%) | 107 (3.5%) | 224 (2.9%) | 365 (3.0%) | 46 (3.9%) | 127 (3.0%) | 200 (3.5%) |
| All-cause emergency department visits | |||||||||
| 0 | 991 (48.4%) | 1537 (50.9%) | 2737 (51.6%) | 1288 (41.6%) | 3661 (47.0%) | 5622 (46.4%) | 464 (39.6%) | 1934 (45.7%) | 2514 (44.2%) |
| 1 | 546 (26.7%) | 784 (25.9%) | 1367 (25.8%) | 823 (26.6%) | 2015 (25.9%) | 3202 (26.4%) | 320 (27.3%) | 1108 (26.2%) | 1484 (26.1%) |
| >1 | 509 (24.9%) | 701 (23.2%) | 1202 (22.7%) | 982 (31.7%) | 2109 (27.1%) | 3297 (27.2%) | 387 (33.0%) | 1188 (28.1%) | 1684 (29.6%) |
| All-cause hospitalizations | |||||||||
| 0 | 1567 (76.6%) | 2463 (81.5%) | 4231 (79.7%) | 2370 (76.6%) | 6195 (79.6%) | 9632 (79.5%) | 881 (75.2%) | 3317 (78.4%) | 4462 (78.5%) |
| 1 | 335 (16.4%) | 397 (13.1%) | 763 (14.4%) | 500 (16.2%) | 1122 (14.4%) | 1736 (14.3%) | 185 (15.8%) | 643 (15.2%) | 862 (15.2%) |
| >1 | 144 (7.0%) | 162 (5.4%) | 312 (5.9%) | 223 (7.2%) | 468 (6.0%) | 753 (6.2%) | 105 (9.0%) | 270 (6.4%) | 358 (6.3%) |
| Number of comorbidities | |||||||||
| 0 | 151 (7.4%) | 287 (9.5%) | 767 (14.5%) | 238 (7.7%) | 694 (8.9%) | 1736 (14.3%) | 74 (6.3%) | 320 (7.6%) | 740 (13.0%) |
| 1 | 309 (15.1%) | 574 (19.0%) | 1106 (20.8%) | 508 (16.4%) | 1342 (17.2%) | 2401 (19.8%) | 180 (15.4%) | 749 (17.7%) | 1124 (19.8%) |
| 2 | 443 (21.7%) | 611 (20.2%) | 1121 (21.1%) | 594 (19.2%) | 1679 (21.6%) | 2603 (21.5%) | 260 (22.2%) | 890 (21.0%) | 1268 (22.3%) |
| >3 | 1143 (55.9%) | 1550 (51.3%) | 2312 (43.6%) | 1753 (56.7%) | 4070 (52.3%) | 5381 (44.4%) | 657 (56.1%) | 2271 (53.7%) | 2550 (44.9%) |
| Frailty measures | |||||||||
| Use of walkers or wheelchairs | 310 (15.2%) | 357 (11.8%) | 706 (13.3%) | 451 (14.6%) | 984 (12.6%) | 1622 (13.4%) | 198 (16.9%) | 517 (12.2%) | 750 (13.2%) |
| Urinary catheter | 250 (12.2%) | 309 (10.2%) | 607 (11.4%) | 384 (12.4%) | 814 (10.5%) | 1300 (10.7%) | 154 (13.2%) | 450 (10.6%) | 605 (10.6%) |
| Fracture | 18 (0.9%) | 28 (0.9%) | 38 (0.7%) | 17 (0.5%) | 68 (0.9%) | 75 (0.6%) | 11 (0.9%) | 32 (0.8%) | 30 (0.5%) |
| Falls | 167 (8.2%) | 258 (8.5%) | 345 (6.5%) | 277 (9.0%) | 658 (8.5%) | 847 (7.0%) | 112 (9.6%) | 333 (7.9%) | 421 (7.4%) |
| Dementia | 220 (10.8%) | 304 (10.1%) | 535 (10.1%) | 339 (11.0%) | 697 (9.0%) | 1102 (9.1%) | 93 (7.9%) | 372 (8.8%) | 477 (8.4%) |
| Home oxygen | 256 (12.5%) | 259 (8.6%) | 457 (8.6%) | 343 (11.1%) | 811 (10.4%) | 1040 (8.6%) | 151 (12.9%) | 489 (11.6%) | 494 (8.7%) |
Abbreviations: AK, Alaska; AL, Alabama; AR, Arkansas; AZ, Arizona; CA, California; CO, Colorado; CT, Connecticut; DC, Washington, D.C.; DE, Delaware; FL, Florida; GA, Georgia; GU, Guam; HD, high dose; HI, Hawaii; IA, Iowa; ID, Idaho; IL, Illinois; IN, Indiana; KY, Kentucky; KS, Kansas; LA, Louisiana; MA, Massachusetts; MD, Maryland; ME, Maine; MI, Michigan; MN, Minnesota; MO, Missouri; MS, Mississippi; MT, Montana; NC, North Carolina; ND, North Dakota; NE, Nebraska; NH, New Hampshire; NJ, New Jersey; NM, New Mexico; NV, Nevada; NV, not vaccinated; NY, New York; OH, Ohio; OK, Oklahoma; OR, Oregon; PA, Pennsylvania; PR, Puerto Rico; RI, Rhode Island; SC, South Carolina; SD, South Dakota; SD, standard dose; TN, Tennessee; TX, Texas; UT, Utah; VA, Virginia; VI, US Virgin Islands; VT, Vermont; WA, Washington; WI, Wisconsin; WV, West Virginia; WY, Wyoming.
Balancing the Comparison Cohorts
All balancing methods improved comparability of the groups (Supplementary Tables 17–25). Figure 2 shows the absolute standardized mean differences after adjustment for each method compared with the raw data by season. Entropy balancing was the most efficient method for minimizing differences between groups. The PSM approach was the least efficient at balancing the groups, with the HD vs SD recipients retaining the largest differences after matching. Figure 3 shows covariate-specific balance before and after entropy balancing adjustment, and Supplementary Figures 2–4 contrast each method by season.
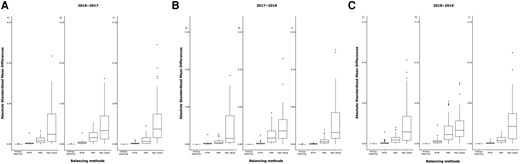
Box plot showing distribution of the absolute standard mean differences for the raw data compared with PSM, PTW, and entropy balancing. Each comparison group is represented by high-dose vs nonvaccinated (A), high-dose vs standard-dose (B), and standard-dose vs not vaccinated (C). The first panel represents the 2016–2017 season, the second panel represents the 2017–2018 season, and the last panel represents the 2018–2019 season. Abbreviations: IPTW, inverse probability treatment weighting; PSM, propensity score matching.
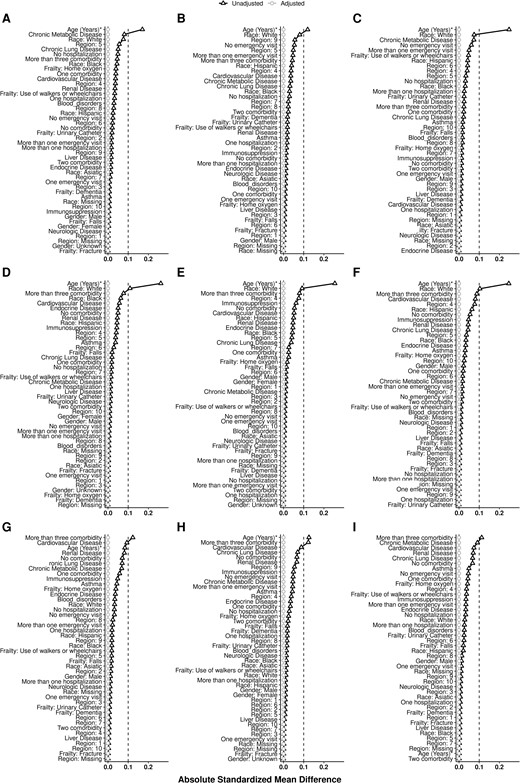
Absolute standard mean difference for each covariate using the entropy balancing method. The columns represent the 2016–2017, 2017–2018, and 2018–2019 seasons. The rows represent high-dose vs no vaccine, high-dose vs standard-dose, and standard-dose vs no vaccine.
Evaluation of the Impact of the Different Vaccines on Mortality
The mortality rate among the HD cohort was significantly reduced compared with those in the NV group, ranging from a 17% reduction during the 2017–2018 season to a 29% reduction in the 2016–2017 season (Figure 4A). Reduction in mortality comparing SD vs NV cohorts was significant only during the 2016–2017 season (IRR, 0.75; 95% CI, .57–.98). No reduction in mortality between HD vs SD recipients was observed during the 2016–2017 season as both vaccines afforded similar protection. However, the HD group had a 17%–20% reduction in mortality compared with the SD group during the other 2 seasons, albeit not statistically significant. Results from other methods showed similar trends (Supplementary Figure 5). Figure 4B shows the distribution of influenza viruses during each US influenza season.
![A, Forest plot showing the relative risk (RR), 95% CI, P value, and percentage reduction in risk of death for each season after entropy balancing for each comparison cohorts. B, The distribution of influenza viruses by type and subtype in each study season [28, 31, 32]. Abbreviations: CI, confidence interval; HD, high-dose influenza vaccine; IRR, incidence rate ratio; LL, lower limit; NV, not vaccinated; SD, standard-dose influenza vaccine; UL, upper limit.](https://oup.silverchair-cdn.com/oup/backfile/Content_public/Journal/cid/77/7/10.1093_cid_ciad322/5/m_ciad322f4.jpeg?Expires=1750200925&Signature=g~Qp1hXzIBm85qL2rXXvyWlY3wCYM1MANiCA9~Afb4QSkJbr~BK7F-wByKpU2ck~Eg2jwbIUIihSsWhvFsIKW3vgbhU8gXKlkSzFqHStYMsRqV4NJzukcdaU7kWSgQwokI4XkM6vM~YLj-1O3ll-nzDyirYakX9rtsNXYszHZlvzFkhwVU-MbaPALuqc0Ve5kFNyJ6I3Sg30tv0AhWznWBH8pIO7o8HCM~6Zmmz4lThNHY6Z62~sQblGKfo6igUi5vatDL7xR7ogm~YdkhTeyXP74IdqVeMAyrZnFnZrWdg4FNvV3ex2Tauf3ahCULOauyfknqwbDviTV75~HfkTiA__&Key-Pair-Id=APKAIE5G5CRDK6RD3PGA)
A, Forest plot showing the relative risk (RR), 95% CI, P value, and percentage reduction in risk of death for each season after entropy balancing for each comparison cohorts. B, The distribution of influenza viruses by type and subtype in each study season [28, 31, 32]. Abbreviations: CI, confidence interval; HD, high-dose influenza vaccine; IRR, incidence rate ratio; LL, lower limit; NV, not vaccinated; SD, standard-dose influenza vaccine; UL, upper limit.
Sensitivity Analysis
Based on our sensitivity analysis, the association of HD vaccination with a reduction in the mortality rate compared with the NV group would cease to be significant if ≥10% of patients were misclassified as unvaccinated (Supplementary Figure 6).
By restricting the analysis to patients with an influenza code for the primary diagnosis, the results were similar: the HD group showed a 27% reduction in mortality (IRR, 0.73; 95% CI, .60– .88; Supplementary Tables 26–28, Supplementary Figure 7). We did not find any association between vaccination and UTI-related ED visits or hospitalizations 30-day post-influenza (Supplementary Table 29).
DISCUSSION
Our analysis showed a significant association between HD vaccine and lower mortality after an influenza-related ED visit or hospitalization when compared with NV patients. The reduction in mortality between HD vs NV was 29% in 2016–2017, 17% in 2017–2018, and 27% in 2018–2019. We observed comparable mortality reduction associated with SD vaccination vs NV during the 2016–2017 season. Our findings underscore the importance of vaccination for those aged ≥65 years to reduce mortality when vaccination fails to prevent influenza.
In the 2016–2017 season, both vaccines provided similar levels of protection against post-influenza death, possibly explaining the lack of difference between HD and SD. The 2016–2017 season was predominantly (74%) a H3N2 season [28]. Circulating viruses were mostly A/Hong Kong/4801/2014–like, well matched to the Northern Hemisphere vaccine [29]. A prior study showed that when circulating viruses match vaccine-selected strains, SD influenza vaccines may play a role in attenuating disease severity [23]. This suggests that influenza vaccination can protect from complications and may reduce the risk of death among breakthrough cases in this vulnerable population [15]. Attenuation of severity among breakthrough influenza cases should be considered when assessing the impact of influenza vaccination on averted disease burden instead of the often-assumed all-or-nothing protection [30, 31].
In the 2017–2018 season, 60% of the circulating viruses were H3N2, 10% were H1N1pdm09, and 30% were influenza B [32]. The influenza burden in this season was the highest in the United States since the 2009 pandemic. The H3N2 viruses evolved throughout the season, and several emerging viral genetic groups were poorly inhibited by antisera raised against egg-adapted viruses used for production of HD and SD vaccines [20]. The poor match of circulating H3N2 with vaccine strains could explain the lack of reduction in mortality when comparing SD vs NV groups [23]. Nonetheless, the mortality rate in the HD group was reduced compared with the NV (IRR, 0.83; 95% CI, .72–.95) and SD cohorts (IRR, 0.83; 95% CI, .67–1.01), suggesting the benefit of HD vaccines in reducing mortality among breakthrough cases even during seasons with poor vaccine match.
The 2018–2019 season was characterized by 2 waves of influenza A, the first driven by H1N1pdm09 viruses from October 2018 to mid-February 2019, which showed a good match to the vaccine strains [33]. The second wave had a similar level of magnitude but was driven by H3N2 viruses (from February 2019 through May 2019). An increase in circulation of clade 3C.3a viruses strongly contributed to the high proportion of H3N2 viruses that were antigenically distinct from the season's vaccine component [33, 34]. Again, reduction in post-influenza mortality was significant among the HD group when compared with the NV group, despite the poor match. Compared with the SD group, the HD group showed a mortality reduction of 20%, although not significant. The SD vaccine could have provided protection from death among H1N1pdm09 breakthrough cases (suggested by the point estimate seen for SD vs NV groups). However, we could not distinguish the effect of vaccination on subtype-specific influenza due to the overlapping influenza waves with similar magnitude (Supplementary Figure 8), which likely diluted the estimated benefit of HD compared with SD.
The mechanisms by which different vaccines may attenuate disease severity are mostly unknown, despite numerous studies [15, 16, 23, 35]. Perhaps HD vaccination elicits greater cellular immunity response than SD vaccination, as shown in a secondary analysis of a randomized clinical trial [36]. Cell-mediated immunity may correlate better with protection in the elderly [16, 37], and while humoral immunity may protect against infection [6], cellular immune responses have been shown to reduce disease severity [38]. Improving our understanding of the underlying immune mechanism of action for available influenza vaccines can inform research and development for next-generation influenza vaccines, especially for this population.
The entropy balancing method retained all information from the comparison groups, which may have allowed for more robust results when comparing HD vs NV groups [26]. In recent years, more studies have reported on the effect of vaccines using real-world data [8–10, 12, 22, 23, 39], but none of them has used entropy balancing. Future investigations are warranted to explore the performance of analytical approaches when substantial imbalance in exposure may exist due to use preferences or differences in product availability (eg, by place and time).
Our study has inherent limitations due to its observational nature. We lacked specific virologic data to understand the impact of different circulating viruses and their different temporal effects on the benefit of vaccination. Moreover, the lack of laboratory confirmation for influenza limited our certainty that these medical encounters were truly all influenza-associated. However, more than 85% of patients in our study had specific influenza codes in the first or second position, and, reassuringly, restricting the analysis to only patients with influenza as primary diagnosis yielded similar findings. Perhaps the most challenging limitation when using claims data is the possible misclassification of unvaccinated patients. Nonetheless, based on estimates from other studies where vaccine data were validated, misclassification of unvaccinated patients is likely to be no higher than 10% [18–20]. Finally, our findings could be biased with residual confounding (from unmeasured confounders) despite our efforts to balance the comparison groups, as claims may not fully capture the underlying health status or healthcare-seeking behaviors of patients. While we recognize these limitations, the fact that HD vaccine was significantly associated with approximately 20% reduction in the mortality rate every post-influenza season is reassuring and supports findings from other HD vaccine studies [2–7, 22]. Moreover, when using a negative control outcome (UTI ED visits or hospitalizations), we found no association with vaccination, potentially providing additional support for the findings of our primary analysis.
In conclusion, HD vaccine was associated with lower post-influenza mortality among older adults with breakthrough influenza, even during seasons when antigenically drifted H3N2 virus circulated. The impact of vaccines on attenuating disease severity should be further explored to understand the immune mechanism of protection and attenuation of influenza disease severity in this population and guide the assessment of vaccine policy recommendations.
Supplementary Data
Supplementary materials are available at Clinical Infectious Diseases online. Consisting of data provided by the authors to benefit the reader, the posted materials are not copyedited and are the sole responsibility of the authors, so questions or comments should be addressed to the corresponding author.
Notes
Author contributions. All authors had full access to the data in the study and take responsibility for the integrity of the data and the accuracy of the data analysis. Study concept, design, and writing of the manuscript: S. S. C. Analysis: K. L., Y. Z., and Q. P. Interpretation of results and critical revision of the manuscript: all authors.
Financial support. This work was supported by Sanofi Vaccines.
References
Author notes
Potential conflicts of interest. S. S. C., S. N., M. M. L., and C. M. are employees of Sanofi. K. L., M. G., Q. P., and Y. Z. report consulting fees from Sanofi (Quinten Health was contracted by Sanofi). C. M., J. N., and M. M. L may hold Sanofi shares. All authors have submitted the ICMJE Form for Disclosure of Potential Conflicts of Interest. Conflicts that the editors consider relevant to the content of the manuscript have been disclosed.

