


Abstract
Data are limited on influenza vaccine effectiveness (VE) in the prevention of influenza-related hospitalizations in older adults and those with underlying high-risk comorbidities.
We conducted a prospective, test-negative, case-control study at 2 US hospitals from October 2018–March 2020 among adults aged ≥50 years hospitalized with acute respiratory illnesses (ARIs) and adults ≥18 years admitted with congestive heart failure (CHF) or chronic obstructive pulmonary disease (COPD) exacerbations. Adults were eligible if they resided in 1 of 8 counties in metropolitan Atlanta, Georgia. Nasopharyngeal and oropharyngeal swabs were tested using BioFire FilmArray (bioMérieux, Inc.) respiratory panel, and standard-of-care molecular results were included when available. Influenza vaccination history was determined from the Georgia vaccine registry and medical records. We used multivariable logistic regression to control for potential confounders and to determine 95% confidence intervals (CIs).
Among 3090 eligible adults, 1562 (50.6%) were enrolled. Of the 1515 with influenza vaccination history available, 701 (46.2%) had received vaccination during that season. Influenza was identified in 37 (5.3%) vaccinated versus 78 (9.6%) unvaccinated participants. After adjustment for age, race/ethnicity, immunosuppression, month, and season, pooled VE for any influenza-related hospitalization in the eligible study population was 63.1% (95% CI, 43.8–75.8%). Adjusted VE against influenza-related hospitalization for ARI in adults ≥50 years was 55.9% (29.9–72.3%) and adjusted VE against influenza-related CHF/COPD exacerbation in adults ≥18 years was 80.3% (36.3–93.9%).
Influenza vaccination was effective in preventing influenza-related hospitalizations in adults aged ≥50 years and those with CHF/COPD exacerbations during the 2018–2020 seasons.
Seasonal influenza is associated with significant morbidity (115 000 to 630 000 hospitalizations) and mortality (12 000 to 56 000 deaths) each influenza season in the United States [1–3]. Additionally, influenza is estimated to account for over half of the economic burden of vaccine-preventable illnesses [4]. Certain populations, including those with underlying comorbidities such as cardiovascular disease or chronic lung disease, are at a greater risk for influenza-related hospitalization and comprise a larger proportion of adults hospitalized due to influenza [2, 5]. The risk of influenza-associated death also increases with age, particularly in adults 65 years of age and older [6, 7].
Vaccination is considered the best preventative measure against influenza. The Advisory Committee on Immunization Practices (ACIP) of the Centers for Disease Control and Prevention (CDC) recommends seasonal influenza vaccination for all individuals 6 months of age and older and high-dose or adjuvanted vaccination for adults aged 65 years and older [8]. Influenza vaccine effectiveness (VE) varies with the outcome, population, and the influenza season studied [9–13]. During the 2018–2019 and 2019–2020 seasons, VE against any influenza illness was estimated to be 29% [95% confidence interval [CI], 21–35%) for the 2018–2019 season and 39% (95% CI, 32–44%) for the 2019–2020 season in a large, nationally representative sample of US adults [14, 15]. While A(H1N1)pdm09 viruses predominated during the early half of the 2018–2019 season, the lower VE observed during the latter half of that season was attributed to the emergence of A(H3N2) clade 3C.3a viruses, against which VE was 5% (95% CI, −10% to 19%) [14, 15]. During the 2019–2020 season, Victoria/B and A(H1N1)pdm09 viruses predominated, but late-season antigenic drift of A(H1N1)pdm09 resulted in vaccine mismatch and reduced effectiveness against influenza illness [14, 15]. While these studies provide information about VE against outpatient influenza illness, additional data on the influenza VE against hospitalization are needed. Although studies of influenza VE often include participants with underlying cardiorespiratory comorbidities, few provide estimates of influenza VE against hospitalizations for congestive heart failure (CHF) or chronic obstructive pulmonary disease (COPD) exacerbations specifically. While randomized controlled trials are not suitable in this scenario, prospective case-control studies using a test-negative design (TND) allow for the estimation of VE against severe outcomes, while adjusting for confounding variables and avoiding biases for healthcare-seeking behavior and population heterogeneity.
In this study, we therefore performed prospective surveillance during the 2018–2019 and 2019–2020 influenza seasons in 2 urban hospitals of adults aged 50 years and older admitted with acute respiratory illnesses (ARIs) and adults of any age admitted with exacerbations of CHF or COPD. An a priori objective of this study was to assess influenza VE using a TND in these high-risk hospitalized adults.
METHODS
Subject Enrollment and Identification
Adults who were hospitalized or remained in the emergency department for observation for 24 hours or longer at Emory University Hospital or Emory University Hospital Midtown in Atlanta, Georgia, were prospectively screened for eligibility. To be eligible, adults aged 50 years or older needed to be admitted with ARI or adults aged 18 or older needed to be admitted with exacerbation of underlying CHF or COPD. Acute respiratory illness was defined as having at least 1 of the following symptoms: nasal congestion, rhinorrhea, sore throat, hoarseness, new or increased-from-baseline cough, sputum production, dyspnea, and/or wheezing; or having an admitting diagnosis suggestive of ARI, including pneumonia, upper respiratory infection, bronchitis, influenza, cough, asthma exacerbation, viral respiratory illness, respiratory distress, and/or respiratory failure. Patients were excluded if they did not reside in 1 of the 8 counties in Health District 3 (Clayton, Cobb, Douglas, Fulton, Gwinnett, DeKalb, Newton, Rockdale) surrounding Atlanta, Georgia; if they had more than 14 days of symptoms at the time of enrollment; or if they had been previously enrolled in this study within 28 days. Participants were excluded from the VE analysis if they did not have verifiable vaccination records. Participants were enrolled during the 2018–2019 and 2019–2020 influenza seasons, defined in this study as between mid-September and mid-April. However, surveillance was halted in mid-March 2020 due to the onset of the coronavirus disease 2019 (COVID-19) pandemic. No cases of severe acute respiratory syndrome coronavirus 2 (SARS-CoV-2) were identified in the study population. This study was reviewed and approved by the Emory Institutional Review Board, and informed consent was obtained from the patient or their legally authorized representative as appropriate.
After enrollment, an interview was conducted to collect detailed sociodemographic and clinical characteristics, which were entered into a REDCap database. Patient medical records were reviewed for additional clinical data and clinical outcomes. Vaccination data were collected from the Georgia Registry of Immunization Transaction Services (GRITS) database, participant medical records, and medical provider records. Participants were considered to have been vaccinated if they had received the current seasonal influenza vaccine more than 14 days prior to admission. If they had received a seasonal influenza vaccine 14 days or less prior to admission, then they were classified as unvaccinated.
Influenza Testing
Most patients were tested for influenza based on provider decision using standard-of-care (SOC) reverse transcription-polymerase chain reaction (RT-PCR) molecular tests, typically GeneXpert (Cepheid) or the BioFire FilmArray (bioMérieux, Inc.) respiratory panel [16]. In addition, a research-specific BioFire FilmArray respiratory panel was performed on all participants using nasopharyngeal (NP) and oropharyngeal (OP) swabs collected by the study team. The NP and OP swabs were tested as a combined specimen, with a subset of individuals having NP and OP swabs tested separately in addition to the combined NP/OP swab. If the patient declined the NP swab, a mid-turbinate or nasal swab was collected and tested instead.
Statistical Analyses
Descriptive statistics were used to describe the baseline characteristics of the cohort. Any SOC or study-specific influenza test that was positive was considered a “case,” while patients with negative influenza testing were considered “controls.” The odds of receiving influenza vaccination in the case and control groups were then compared, and VE was calculated as (1 – adjusted odds ratio × 100% [17]. Multivariate logistic regression VE models were created for the individual and combined seasons to determine an influenza VE adjusted for key demographic variables [age [continuous], race/ethnicity) underlying immunosuppression, season, and calendar month. Vaccine effectiveness analyses were performed for the pooled study population and were additionally stratified by season (season 1: 2018–2019; season 2: 2019–2020), age group (18–49 years for CHF/COPD exacerbation, ≥50 years, ≥65 years), and diagnosis (ARI or CHF/COPD exacerbation). A sensitivity analysis was performed that measured VE for all enrolled participants with CHF/COPD, whether they had an exacerbation of the chronic condition or an ARI without exacerbation. In addition, we conducted a sensitivity analysis assessing influenza VE against human metapneumovirus (HMPV), a “dummy” virus for which influenza vaccination should have no effectiveness for the pooled study population [9, 17]. All analyses were performed using SAS version 9.4 (SAS Institute).
RESULTS
Study Population
Among 3090 eligible adults, 1562 (50.6%) were enrolled, of whom 120 (7.7%) had influenza (Figure 1). The overall median age of the study population was 64 years (interquartile range [IQR], 56–73 years); 866 (55.4%) of the participants were female; 1086 (69.5%) were Black/non-Hispanic, 377 (24.1%) were White/non-Hispanic, 31 (2.0%) were Hispanic/Latino, and 68 (4.4%) were other races. Overall, 885 (56.7%) participants were admitted for ARI, 438 (28.0%) were admitted for CHF exacerbations, and 239 (15.3%) were admitted for COPD exacerbations. At baseline, 764 (48.9%) had an underlying CHF, while 542 (34.7%) had COPD. When comparing influenza cases versus controls, there were no significant differences in sociodemographic characteristics. Influenza cases were less likely to have certain medical comorbidities than controls, including CHF (40 [33.3%] vs 735 [51.0%]; P = .0002), diabetes mellitus (40 [33.3%] vs 626 [43.4%]; P = .0320), and chronic kidney disease (29 [24.2%] vs 560 [38.8%]; P = .0014). Cases were also admitted to the hospital significantly later in the season than controls (median days from season start to admission: 51 [IQR, 38–78] vs 31 [IQR, −11 to 74]). In terms of outcomes, 327 (20.9%) of the 1562 enrolled patients were admitted to the intensive care unit, 66 (4.2%) required mechanical ventilation, and 53 (3.4%) died. The median duration of hospitalization was 4 days (IQR, 2–7 days). There were no significant differences in outcomes between influenza cases and controls (Table 1).
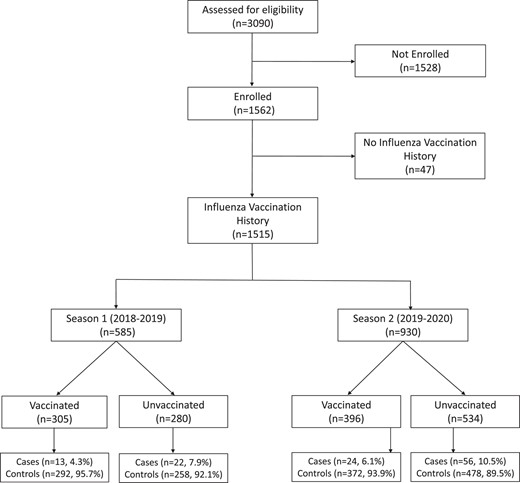
CONSORT diagram. Abbreviation: CONSORT, Consolidated Standards of Reporting Trials.
Demographic and Clinical Characteristics of Study Participants by Influenza Infection and Vaccination Status
| Total Enrolled (N = 1562) | Total With Vaccine Records (n = 1515)a | |||||
|---|---|---|---|---|---|---|
| Controls (Influenza-Negative, n = 1442) | Cases (Influenza-Positive, n = 120) | P | Nonvaccinated (n = 814) | Vaccinated (n = 701) | Pa | |
| Age, median [IQR], y | 64 [56, 73] | 61 [56, 71] | .2937 | 62 [55, 70] | 65 [58, 73] | .0002 |
| Female sex, n (%) | 796 (55.2) | 70 (58.3) | .5071 | 453 (55.7) | 387 (55.2) | .8623 |
| Race | .3155 | <.0001 | ||||
| Black non-Hispanic | 997 (69.1) | 89 (74.2) | 605 (74.3) | 447 (63.8) | ||
| White non-Hispanic | 353 (24.5) | 24 (20.0) | 160 (19.7) | 208 (29.7) | ||
| Hispanic/Latino | 27 (1.9) | 4 (3.3) | 17 (2.1) | 13 (1.9) | ||
| Other | 65 (4.5) | 3 (2.5) | 32 (3.9) | 33 (4.7) | ||
| Research site | .0769 | .2493 | ||||
| EUH | 746 (51.7) | 52 (43.3) | 402 (49.4) | 367 (52.4) | ||
| EUHM | 696 (48.3) | 68 (56.7) | 412 (50.6) | 334 (47.6) | ||
| Influenza season | .0857 | .0003 | ||||
| 2018–2019 | 559 (38.8) | 37 (30.8) | 280 (34.4) | 305 (43.5) | ||
| 2019–2020 | 883 (61.2) | 83 (69.2) | 534 (65.6) | 396 (56.5) | ||
| Social history | ||||||
| Children <5 y at home | 109 (7.6) | 11 (9.2) | .5252 | 69 (8.5) | 47 (6.7) | .1959 |
| Children 5–17 y at home | 205 (14.2) | 21 (17.5) | .3259 | 141 (17.3) | 78 (11.1) | .0006 |
| Insurance | .2261 | .2222 | ||||
| Public | 976 (67.7) | 81 (67.5) | 537 (66.0) | 490 (69.9) | ||
| Private | 292 (20.2) | 19 (15.8) | 174 (21.4) | 127 (18.1) | ||
| Other | 174 (12.1) | 20 (16.7) | 103 (12.7) | 84 (12.0) | ||
| Chronic conditions | ||||||
| Asthma | 235 (16.3) | 26 (21.7) | .1298 | 141 (17.3) | 115 (16.4) | .6349 |
| Diabetes mellitus | 626 (43.4) | 40 (33.3) | .0320 | 328 (40.3) | 324 (46.2) | .0202 |
| Blood disorder | 126 (8.7) | 11 (9.2) | .8732 | 57 (7.0) | 79 (11.3) | .0038 |
| Chronic kidney disease | 560 (38.8) | 29 (24.2) | .0014 | 291 (35.7) | 287 (40.9) | .0380 |
| Chronic liver disease | 50 (3.5) | 2 (1.7) | .2907 | 23 (2.8) | 29 (4.1) | .1621 |
| Immunocompromisedb | 330 (22.9) | 34 (28.3) | .1750 | 164 (20.1) | 192 (27.4) | .0009 |
| Cancer | 188 (13.0) | 18 (15.0) | .5415 | 99 (12.2) | 103 (14.7) | .1484 |
| HIV | 63 (4.4) | 7 (5.8) | .4563 | 36 (4.4) | 31 (4.4) | .9997 |
| Other immunosuppressive conditions | 34 (2.4) | 8 (6.7) | .0051 | 15 (1.8) | 26 (3.7) | .0256 |
| Splenectomy | 1 (0.1) | 0 (0.0) | .7729 | 0 (0.0) | 1 (0.1) | .2811 |
| Transplant | 65 (4.5) | 5 (4.2) | .8623 | 23 (2.8) | 47 (6.7) | .0003 |
| Seizure disorder | 46 (3.2) | 2 (1.7) | .3529 | 30 (3.7) | 17 (2.4) | .1583 |
| COPD | 500 (34.7) | 43 (35.8) | .7978 | 271 (33.3) | 262 (37.4) | .0971 |
| Coronary artery disease | 345 (23.9) | 20 (16.7) | .0710 | 188 (23.1) | 169 (24.1) | .6433 |
| CHF | 735 (51.0) | 40 (33.3) | .0002 | 394 (48.4) | 354 (50.4) | .4158 |
| Admission characteristics | ||||||
| Admitted to ICU | 303 (21.0) | 24 (20.0) | .7934 | 174 (21.4) | 146 (20.8) | .7942 |
| Length of hospital stay, median [IQR], d | 4 [2, 7] | 3 [2, 6] | .1618 | 4 [2, 7] | 4[2, 7] | .7832 |
| Mechanical ventilation | 54 (3.7) | 5 (4.2) | .8158 | 36 (4.4) | 23 (3.3) | .2521 |
| Died | 48 (3.3) | 5 (4.2) | .6262 | 27 (3.3) | 24 (3.4) | .9086 |
| Influenza case timing, median [IQR], d | ||||||
| Disease onset to admission | 2 [1, 5] | 3 [2, 6] | .0807 | 2 [1, 6] | 3 [1, 6] | .8159 |
| Season start to admissionc | 31 [−11, 74] | 51 [38, 78] | <.0001 | 20 [−25, 62] | 53 [13, 83] | <.0001 |
Data are presented as n (%) unless otherwise indicated.
Abbreviations: CHF, congestive heart failure; COPD, chronic obstructive pulmonary disease; EUH, Emory University Hospital; EUHM, Emory University Hospital Midtown; HIV, human immunodeficiency virus; ICU, intensive care unit; IQR, interquartile range.
aVaccination records were available for 115 flu + cases.
bImmunocompromised includes cancer, HIV, splenectomy, transplant, and other immunosuppressive conditions.
cInfluenza season was established in Morbidity and Mortality Weekly Report (MMWR) week 47 when local surveillance detected >5% of influenza tests being positive.
Among all 1562 enrolled participants, 1515 (97.0%) had vaccination records available in GRITS or their electronic medical record, of whom 701 (46.3%) had received the seasonal influenza vaccine. A total of 585 participants with vaccination records were enrolled during season 1, of whom 35 (6.0%) had influenza. A total of 930 participants were enrolled during season 2, of whom 80 (8.6%) had influenza. Vaccinated participants were significantly older than unvaccinated participants (median: 65 [IQR, 58–73] years vs 62 [IQR, 55–70] years; P = .0002) and had a different racial distribution than the unvaccinated participants. A smaller proportion of the vaccinated group than the unvaccinated group identified as Black non-Hispanic (447/701 [63.8%] vs 605/814 [74.3%]; P < .0001), while a larger proportion of the vaccinated group than the unvaccinated group identified as White non-Hispanic (208/701 [29.7%] vs 160/814 [19.7%]; P < .0001). Vaccinated participants were admitted significantly later in the influenza season (median days from season start to admission: 53 [IQR, 13–83] vs 20 [IQR, −25 to 62]) and were also more likely to have underlying diabetes mellitus (324/701 [46.2%] vs 328/814 [40.3%]; P = .0202), blood disorders (79/701 [11.3%] vs 57/814 [7.0%]; P = .0038), chronic kidney disease (287/701 [40.9%] vs 291/814 [35.7%]; P = .0380), any immunocompromising condition (192/701 [27.4%] vs 164/814 [20.1%]; P = .0009), a history of solid-organ transplant (47/701 [6.7%] vs 23/814 [2.8%]; P = .0003), or of an immunocompromising condition due to “other” cause (26/701 [3.7%] vs 15/814 [1.8%]; P = .0256) (Table 1).
Vaccine Effectiveness Analyses
The crude VE estimates against influenza hospitalization in the pooled study population were 47.4% (95% CI, 21.2–64.9%) for the combined seasons 1 and 2, 47.8% (95% CI, −5.8% to 74.2%) for season 1 alone, and 44.9% (95% CI, 9.5–66.5%) for season 2 alone (Table 2). After controlling for age, race/ethnicity, immunosuppression, season, and calendar time, the adjusted influenza VE estimate against hospitalization in the pooled study population was 63.1% (95% CI, 43.8–75.8%) for the combined seasons 1 and 2. The adjusted VE for season 1 alone was 50.5% (95% CI, −2.5% to 76.1%), and for season 2 alone was 68.0% (95% CI, 45.9–81.1%).
Crude and Adjusted Influenza Vaccine Effectiveness Against Influenza-Related Hospitalizations by Season
| Crude VE | Crude 95% CI | Adj. VEa | Adj. 95% CI | |
|---|---|---|---|---|
| Overall | ||||
| Season 1 and 2b | 47.4 | (21.2, 64.9) | 63.1 | (43.8, 75.8) |
| Season 1 | 47.8 | (−5.8, 74.2) | 50.5 | (−2.5, 76.1) |
| Season 2 | 44.9 | (9.5, 66.5) | 68.0 | (45.9, 81.1) |
| All ≥50 y | ||||
| Season 1 and 2 | 47.5 | (20.7, 65.2) | 61.7 | (41.2, 75.1) |
| Season 1 | 41.8 | (−20.3, 71.9) | 47.3 | (−11.6, 75.1) |
| Season 2 | 46.9 | (11.9, 68.0) | 67.9 | (45.2, 81.2) |
| All ≥65 y | ||||
| Season 1 and 2 | 48.0 | (5.6, 71.4) | 65.5 | (35.5, 81.5) |
| Season 1 | 31.5 | (−142.5, 80.7) | 26.71 | (−176.1, 80.6) |
| Season 2 | 47.1 | (−5.2, 73.5) | 70.8 | (38.8, 86.1) |
| CHF/COPD exacerbations | ||||
| All | 69.7 | (7.9, 90.1) | 80.3 | (36.3, 93.9) |
| ≥50 y | 66.7 | (−3.3, 89.3) | 79.0 | (31.3, 93.6) |
| ≥65 y | 45.4 | (−132.9, 87.2) | 72.3 | (−33.2, 94.2) |
| CHF/COPD history or exacerbation (≥50 y) | 57.6 | (27.8, 75.1) | 68.2 | (44.82, 81.7) |
| ARI | ||||
| All | 43.0 | (11.2, 63.5) | 55.9 | (29.9, 72.3) |
| ≥65 y | 48.1 | (−.4, 73.2) | 63.1 | (25.3, 81.8) |
| ARI with CHF/COPD history | 56.9 | (19.5, 76.9) | 63.2 | (28.6, 81.0) |
| ARI without CHF/COPD history | 24.2 | (−43.0, 59.8) | 48.2 | (−2.7, 73.9) |
| HMPV | ||||
| Season 1 and 2 | −75.1 | (−394.5, 38.0) | −29.9 | (−294.1, 57.2) |
| Season 1 | −38.1 | (−732.4, 77.1) | −53.9 | (−1116.2, 80.5) |
| Season 2 | −103.8 | (−627.2, 42.9) | −36.1 | (−441.6, 65.8) |
Data are presented as percentages. Abbreviations: Adj., adjusted; ARI, acute respiratory illness; CHF, congestive heart failure; CI, confidence interval; COPD, chronic obstructive pulmonary disease; HMPV, human metapneumovirus; VE, vaccine effectiveness.
aAdjusted model included age, race/ethnicity, immunosuppression, month of admission, season.
bSeason 1 was 2018–2019; season 2 was 2019–2020.
We then performed age-stratified analyses of influenza VE in the pooled study population of participants who were 50 years of age or older or 65 years of age or older. For adults aged 50 years and older, the adjusted VE against influenza hospitalization for ARI or CHF/COPD exacerbation was 61.7% (95% CI, 41.2–75.1%) across combined seasons 1 and 2, while it was 47.3% (95% CI, −11.6% to 75.1%) in season 1 and 67.9% (95% CI, 45.2–81.2%) in season 2. For adults aged 65 years and older, the adjusted VE against influenza hospitalization for ARI or CHF/COPD exacerbation was 65.5% (95% CI, 35.5–81.5%) across combined seasons 1 and 2, while it was 26.7% (95% CI, −176.1% to 80.6%) in season 1 and 70.8% (95% CI, 38.8–86.1%) in season 2.
We then performed analyses of influenza VE against hospitalization for influenza-related CHF/COPD exacerbations overall and stratified by age. The overall adjusted influenza VE against hospitalization for CHF/COPD exacerbation in adults aged 18 years and older across both seasons was 80.3% (95% CI, 36.3–93.9%). When the VE analysis was stratified by age group, the adjusted influenza VE against hospitalization for CHF/COPD exacerbation in adults aged 50 years and older was 79.0% (95% CI, 31.3–93.6%), while in adults aged 65 years and older it was 72.3% (95% CI, −33.2% to 94.2%). We were unable to measure VE in the 18–49-year age stratum due to insufficient sample size. To determine the impact of influenza vaccination against any respiratory hospitalization among all patients with underlying CHF or COPD, we then performed a combined analysis of influenza VE among those who had either (1) CHF/COPD exacerbation or (2) ARI with underlying comorbidity of CHF or COPD. We found that the influenza VE against hospitalization for exacerbation or ARI among individuals with CHF/COPD across both seasons was 68.2% (95% CI, 44.8–81.7%).
We then determined influenza VE against hospitalization for ARI among all participants, and then among participants stratified by age (≥65 years), among those with a history of CHF/COPD, and among those without a history of CHF/COPD. The overall adjusted influenza VE against hospitalization for ARI in adults aged 50 years and older across both seasons was 55.9% (95% CI, 29.9–72.2%), while VE in adults aged 65 years and older was 63.1% (95% CI, 25.3–81.8%). When analysis was stratified by CHF/COPD history, the adjusted VE against hospitalization for ARI among those with a history of CHF/COPD was 63.2% (95% CI, 28.6–81.0%), while VE among those without a history of CHF/COPD was 48.2% (95% CI, −2.7% to 73.9%).
We then performed a sensitivity analysis of influenza VE against hospitalization for HMPV in the pooled study population to ensure there was no residual confounding (Table 2, Supplementary Table 1). The adjusted influenza VE against hospitalization for HMPV across the combined seasons was −29.9% (95% CI, −294.1% to 57.2%), while it was −53.9% (95% CI, −1116.2% to 80.5%) for season 1 and −36.1% (95% CI, −441.6% to 65.8%) for season 2.
DISCUSSION
This prospective surveillance study utilized a test-negative case-control design to determine the adjusted influenza VE to prevent hospitalization for ARI among adults aged 50 years and older and CHF and COPD exacerbations among adults of any age. Results showed that influenza vaccination reduced the risk of influenza-associated hospitalization in the 2018–2019 and 2019–2020 seasons by 63.1% (95% CI, 43.8–75.8%) in the pooled study population. The adjusted season-specific VE estimate was 50.5% (95% CI, −2.5% to 76.1%) in season 1, which was consistent with the known reduced effectiveness of influenza vaccination corresponding with the emergence of A(H3N2) clade 3C.3a viruses in the latter half of the season. Adjusted VE was higher at 68.0% (95% CI, 45.9–81.1%) in season 2, during which A(H1N1) and Victoria/B predominated. These estimates are slightly higher than those observed in a 2019–2020 hospital surveillance study at 14 US sites, which found VE against influenza hospitalization of 41% (95% CI, 27–52%) [12]. The lower estimate in that study may have been attributable to a higher proportion of younger adults who had lower VE. Importantly, influenza vaccination had no VE against HMPV-associated hospitalizations, which is reassuring against unrecognized confounding in our study design.
Influenza VE in our study population was highest against hospitalization for CHF/COPD exacerbations at 80.3% (95% CI, 36.3–93.9%) among adults aged 18 years and older and 79.0% (95% CI, 31.3–93.6%) among adults aged 50 years and older across both seasons. These estimates were notably higher than the VE against ARI alone, which was 55.9% (95% CI, 29.9–72.3%) among adults aged 50 years and older. Interestingly, among those with ARI alone, VE was also highest among those with an underlying history of CHF/COPD. These results suggest a greater protective effect of influenza vaccination against hospitalization among patients with underlying CHF or COPD compared with those without these comorbidities. Differences in influenza virus pathogenesis may explain the differences in VE among patients with ARI versus those with CHF or COPD exacerbations. For patients with ARI, direct viral invasion may cause acute lung injury leading to severe lower respiratory tract illness (LRTI). In contrast, for those with CHF, a mild influenza infection may lead to acute decompensation due to compromised cardiac reserve [18]. For patients with underlying COPD, influenza may lead to respiratory epithelial necrosis, hyperinflammatory infiltrate, and decreased mucociliary clearance, predisposing to more severe LRTI. These differences in pathogenesis may explain differences in VE against exacerbations by either condition, as a mild influenza may trigger acute cardiac decompensation with CHF, while COPD may increase susceptibility to severe LRTI. Compared with VE against hospitalization for ARI, VE against a mild infection (as in CHF) might be lower, while VE against a severe LRTI in a more susceptible host (as in COPD) might be greater. Interestingly, in our study population, multiple participants had both CHF and COPD, which limited our ability to ascertain VE in either condition alone.
Congestive heart failure and COPD impact a significant portion of the US population and people with these comorbidities are known to have a higher risk of severe influenza disease and complications of influenza, including pneumonia, hospitalization, and mechanical ventilation [19–25]. While VE studies commonly include individuals with CHF and COPD, they often do not assess VE limited to exacerbations in these populations. A Danish nationwide cohort study of patients with CHF demonstrated that influenza vaccination reduced both all-cause and cardiovascular death, and that frequent vaccination and vaccination early during the season were associated with larger reductions in the risk of death [26]. A Cochrane review including 6 randomized clinical trials also found that influenza vaccination reduced COPD exacerbations occurring more than 3–4 weeks after vaccination [27]. Our data contribute to the accumulating body of evidence to support the use of influenza vaccination to prevent severe outcomes in these high-risk adults [28, 29].
This study has some limitations. The low enrollment percentage of eligible patients (50.5%) may have been due to biases in those who chose to enroll, and sicker patients may have been less likely to enroll [30]. In addition, TNDs have limitations that include selection bias in SOC testing, misclassification of influenza status, and the assumption that VE does not vary based on healthcare-seeking behavior [31–33]. Vaccination records may have been incomplete, leading to a bias that could have decreased estimated VE [34]. In addition, data were not consistently available regarding vaccine dosage, vaccine formulation, infecting influenza strain, and time from influenza vaccination to infection [12, 35–39]. We were also unable to perform VE analyses against susceptibility to hospitalization versus progression of disease once hospitalized. Furthermore, enrollment was halted in mid-March of 2020 due to the onset of the COVID-19 pandemic, limiting data collected at the end of season 2. Finally, while this limitation does not pertain to this study as it was conducted prior to the COVID-19 pandemic, similar studies in the future should adjust for COVID-19 vaccination, as it could bias results in influenza VE TND studies [40].
In conclusion, the adjusted VE against influenza-related hospitalization was 63.1% (95% CI, 43.8–75.8%) across the 2018–2019 and 2019–2020 influenza seasons in the study population. Vaccine effectiveness was highest against hospitalizations for CHF/COPD exacerbations. These results provide further evidence that influenza vaccination is an important strategy for protecting high-risk and older adults against influenza-related hospitalizations. Nevertheless, only 46.3% of the study population with vaccination records available had received influenza vaccination for the given season. Thus, there is additional opportunity for improving influenza vaccination uptake, both in the general population and, in particular, for these high-risk and older adults [41–43].
Supplementary Data
Supplementary materials are available at Clinical Infectious Diseases online. Consisting of data provided by the authors to benefit the reader, the posted materials are not copyedited and are the sole responsibility of the authors, so questions or comments should be addressed to the corresponding author.
Notes
Author Contributions. R. H., E. B., Q. L., B. G., and E. J. A. conceived and designed the study. L. H., O. R., L. S., M. K., M. T., C. C., A. K., A. C., T. G., W. L., H.-M. H., L. B., K. H., and Z. A. collected data. G. E., A. T., and E. J. A. performed the primary data analysis. G. E., A. T., C. A. R., and E. J. A. drafted the manuscript. All authors provided intellectual contribution and reviewed and approved the final draft of the manuscript.
Acknowledgments. The authors thank the patients and their families for participating in this study.
Data availability. Data will be made available upon reasonable request.
Financial support. This work was conducted as a collaboration between Emory University and Pfizer, Inc. Pfizer, Inc. is the study funder.
References
Centers for Disease Control and Prevention.
Centers for Disease Control and Prevention.
Centers for Disease Control and Prevention.
Author notes
Present affiliation: HilleVax, Inc, Boston, Massachusetts, USA.
Present affiliation: Department of Pediatrics, Washington University School of Medicine, St. Louis, Missouri, USA.
Present affiliation: Moderna, Inc, Cambridge, Massachusetts, USA.
Potential conflicts of interest. C. A. R. has received institutional research support from Pfizer, Inc, BioFire, Inc, GSK plc, Janssen Pharmaceuticals, MedImmune, Micron Technology, Inc, ModernaTX, Inc, Merck & Co, Inc, Novavax, PaxVax, Regeneron, and Sanofi Pasteur, and from the Centers for Disease Control and Prevention and the National Institutes of Health (NIH). She reports royalties as coinventor of patented respiratory syncytial virus (RSV) vaccine technology, which has been licensed to Meissa Vaccines, Inc. C. A. R. also reports planned, issued, or pending patents for Chimeric RSV, Immunogenic Compositions, and Methods of Use (International PTC application no. PCT/US2016/058976) and RSV Live-Attenuated Vaccine Candidates with Deleted G-Protein Mucin Domains (US patent application 63/411,251). S. K. has received institutional research support from Pfizer, Meissa, Emergent BioSolutions, the Centers for Disease Control and Prevention, and the NIH. S. K. also reports payment or honoraria for speaking engagements from the American Academy of Pediatrics. I. Y. reported funding to her institution to conduct clinical research from Pfizer, Merck, and Moderna (outside the submitted work) and from the Centers for Disease Control and Prevention, NIH, and Gates Foundation, and consulting fees for advisory board participation from Merck and Sanofi Pasteur outside the submitted work. E. J. A. has consulted for Pfizer, Sanofi Pasteur, GSK, Janssen, Moderna, and Medscape, and his institution receives funds to conduct clinical research unrelated to this manuscript from MedImmune, Regeneron, PaxVax, Pfizer, GSK, Merck, Sanofi-Pasteur, Janssen, Moderna, and Micron. He serves on a safety monitoring board for Kentucky BioProcessing, Inc, and Sanofi Pasteur and serves on a data adjudication board for WIRB-Copernicus Group and ACI Clinical. His institution has also received funding from NIH to conduct clinical trials of COVID-19 vaccines, and holds stock or stock options as a current employee of Moderna. N. R. reports institutional grants or contracts from Merck, Sanofi, Pfizer, Vaccine Company, Immorna, Quidel, and Lilly; consulting fees from Krog; payment or honoraria for speaking engagements from Virology Education; travel support from Sanofi and Moderna; payment for participation on advisory boards from Moderna, Sanofi, Seqirus, and Pfizer; payment for participation on Emmes, ICON plc, and Micron Safety Committees; advisory roles with Antibacterial Resistance Leadership Group, Tropical Medicine Research Centers, and CDC-Pertussis challenge; an Associate Editor role for Clinical Infectious Diseases; and receipt of equipment, material, drugs or other services from Georgia Research Alliance. R. H., E. B., Q. L., and B. G. report stocks or stock options as employees of Pfizer, Inc. D. L. S. reports stock or stock options as a former employee of Pfizer, Inc. All other authors report no potential conflicts. All authors have submitted the ICMJE Form for Disclosure of Potential Conflicts of Interest. Conflicts that the editors consider relevant to the content of the manuscript have been disclosed.

