


Abstract
We sought to determine whether race/ethnicity disparities in severe coronavirus disease 2019 (COVID-19) outcomes persist in the era of vaccination.
Population-based age-adjusted monthly rate ratios (RRs) of laboratory-confirmed COVID-19–associated hospitalizations were calculated among adult patients from the COVID-19–Associated Hospitalization Surveillance Network, March 2020 - August 2022 by race/ethnicity. Among randomly sampled patients July 2021 - August 2022, RRs for hospitalization, intensive care unit (ICU) admission, and in-hospital mortality were calculated for Hispanic, Black, American Indian/Alaskan Native (AI/AN), and Asian/Pacific Islander (API) persons vs White persons.
Based on data from 353 807 patients, hospitalization rates were higher among Hispanic, Black, and AI/AN vs White persons March 2020 - August 2022, yet the magnitude declined over time (for Hispanic persons, RR = 6.7; 95% confidence interval [CI], 6.5–7.1 in June 2020 vs RR < 2.0 after July 2021; for AI/AN persons, RR = 8.4; 95% CI, 8.2–8.7 in May 2020 vs RR < 2.0 after March 2022; and for Black persons RR = 5.3; 95% CI, 4.6–4.9 in July 2020 vs RR < 2.0 after February 2022; all P ≤ .001). Among 8706 sampled patients July 2021 - August 2022, hospitalization and ICU admission RRs were higher for Hispanic, Black, and AI/AN patients (range for both, 1.4–2.4) and lower for API (range for both, 0.6–0.9) vs White patients. All other race and ethnicity groups had higher in-hospital mortality rates vs White persons (RR range, 1.4–2.9).
Race/ethnicity disparities in COVID-19–associated hospitalizations declined but persist in the era of vaccination. Developing strategies to ensure equitable access to vaccination and treatment remains important.
Coronavirus disease 2019 (COVID-19) illness [1], hospitalizations [1–5], and death [1] have disproportionately affected racial and ethnic minority populations. During the first year of the pandemic (March 2020–February 2021), Hispanic and non-Hispanic American Indian or Alaskan Native, Black, and Asian or Pacific Islander persons were more likely to have higher cumulative rates of hospitalization, intensive care unit (ICU) admission, and in-hospital death than non-Hispanic White persons [2]. Higher hospitalization risks remained after accounting for age and differential distribution of underlying medical conditions, as observed in the first 3 months of the pandemic [4].
COVID-19 messenger RNA (mRNA) vaccinations are highly effective at preventing COVID-19–associated hospitalizations [6,7] and severe outcomes (eg, need for invasive mechanical ventilation [IMV] [8], ICU admission [6], and death) [8]. In the United States, COVID-19 vaccine availability began in December 2020 [9]. In August 2021, an additional primary dose was recommended for recipients of a primary mRNA COVID-19 vaccination series who were immunocompromised. In September 2021, a booster dose was recommended for all persons aged ≥65 years and for all persons aged ≥18 years in November 2021 [10,11]. In March 2022, a second booster dose was recommended for adults aged ≥50 years and those ≥12 years with certain immunocompromising conditions [12].
To extend work by Acosta et al [2] and Taylor et al [3], we sought to describe rates and rate ratios (RRs) of COVID-19–associated hospitalization by race and ethnicity from March 2020 through August 2022. To understand whether race/ethnicity disparities persist amid vaccine availability and circulating severe acute respiratory syndrome coronavirus 2 (SARS-CoV-2) variants, we examined population-based rates and RRs of hospitalization, ICU admission, and in-hospital mortality by race/ethnicity and describe characteristics of adult COVID-19–associated hospitalizations by vaccination status and race/ethnicity using July 2021–August 2022 data.
METHODS
The COVID-19–Associated Hospitalization Surveillance Network (COVID-NET) is an all-age population-based surveillance system of laboratory-confirmed COVID-19–associated hospitalizations (herein referred to as hospitalization) in 99 counties across 14 states (California, Colorado, Connecticut, Georgia, Iowa, Maryland, Michigan, Minnesota, New Mexico, New York, Ohio, Oregon, Tennessee, and Utah) [13,14]. To be included in COVID-NET, patients must have a positive molecular or rapid antigen detection test for SARS-CoV-2 during hospitalization or no more than 14 days before admission and be a resident of the predetermined surveillance catchment area. Trained surveillance officers use a standard case report form to record state, case type (pediatric vs adult), date of birth/age, hospital admission date, sex, and SARS-CoV-2 test result (test type, date, and result) from all patients to provide weekly incidence rates. For incidence rates, COVID-NET patients comprise the numerator, and National Center for Health Statistics (NCHS) Vintage 2020 bridged-race postcensal population estimates [15] comprise the denominator [2].
Additional data (eg, patient demographics, underlying medical conditions, and clinical outcomes, including ICU admission) are abstracted from a random sample of patient medical charts stratified by age group and site [16]. Sampling weights account for selection probability; sample sizes vary by surveillance month, site, and age group and are based on the total number of patients identified in each stratum [16].
This activity was reviewed by the Centers for Disease Control and Prevention (CDC) and conducted consistent with applicable federal law and CDC policy (see, eg, 45 C.F.R. part 46.102(l)(2), 21 C.F.R. part 56; 42 U.S.C. §241(d); 5 U.S.C. §552a; 44 U.S.C. §3501 et seq.). Participating sites obtained approval for COVID-NET surveillance from their respective state and local institutional review boards, as required.
Measures
Race/ethnicity data are typically abstracted from multiple sources, including notifiable disease, laboratory, or hospital databases [2]. Race/ethnicity was categorized as non-Hispanic White (White), non-Hispanic Black (Black), non-Hispanic American Indian or Alaskan Native (AI/AN), non-Hispanic Asian or Pacific Islander (API), or Hispanic. If race was known but ethnicity was missing, individuals were coded as non-Hispanic [2,16]. Hospitalizations of patients with missing or unknown race or more than 1 race were excluded.
COVID-19 vaccination status for hospitalized patients and vaccine coverage for the underlying catchment area were determined by state immunization information system (IIS) data [7, 17]. Vaccination with primary series only was defined as having received 2 doses of a 2-dose (mRNA) series or 1 dose of a single-dose series ≥14 days before a positive SARS-CoV-2 test. Individuals who were vaccinated with a primary series and received an additional dose were considered boosted; in these data, additional doses cannot be distinguished from booster doses.
Age and sex was categorized, respectively (18–49, 50–64, ≥65 years) and (male, female). Underlying medical conditions recorded in the patient's medical chart detailing their hospitalization were categorized into major groups (Supplementary Table 1). The sum of underlying medical condition categories (0, 1, 2, ≥3) was calculated.
Statistical Analyses
Monthly hospitalization rates (per 100 000 population) and RRs were calculated by race/ethnicity from March 2020 through August 2022.
Additional analyses were limited to sampled hospitalized nonpregnant patients from July 2021 through August 2022 with complete vaccination status and medical chart abstractions to focus on data including adult primary series vaccination availability. We excluded partially vaccinated hospitalized patients who received only 1 dose of a 2-dose series or who completed their primary series <14 days before testing positive. Pregnant patients were excluded because standards for their hospital and ICU admission may be different [18]. Among sampled patients, rates of hospitalization, ICU admission, and in-hospital mortality were calculated by race/ethnicity. RRs and associated 95% confidence intervals (CIs) for each race/ethnicity group were calculated in comparison with White patients. Statistical significance was set at α < .05. Among sampled patients, weighted (unless otherwise noted) percentages of demographic characteristics, underlying medical conditions, ICU admission, IMV, and in-hospital mortality were calculated by race/ethnicity and vaccination status. χ2 tests were used to determine whether distribution of characteristics differed across race/ethnicity within vaccination groups (unvaccinated, vaccinated with primary series only, and boosted). To account for multiple (50) comparisons across race/ethnicity, vaccination status, and characteristics and to reduce the probability of a type I error, statistical significance was set at α = .05 ÷ 50 = .001. SAS v.9.4 (SAS Institute, Cary, NC) was used for analyses.
RESULTS
There were 382 979 hospitalizations reported to COVID-NET from March 2020 through August 2022. Hospitalizations of patients aged <18 years (n = 10 485; 2.9% of all hospitalizations) with missing or unknown race (n = 17 063; 4.4% of all hospitalizations) or more than 1 race (n = 1624; 0.4% of all hospitalizations) were excluded. A total of 353 807 adult hospitalizations were included in age-adjusted monthly hospitalization rate and RR calculations. Among 10 228 sampled hospitalizations from July 2021 through August 2022, we excluded patients with incomplete chart review (1.4%), who were pregnant (7%), and who had partial (3.9%) or unknown vaccination (2.4%), yielding a final analytic sample of N = 8706 for the remaining analyses (Figure 1).
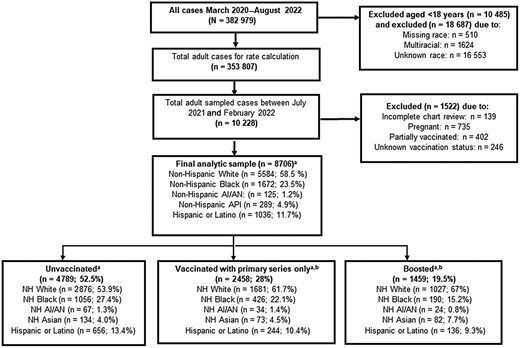
COVID-19–Associated Hospitalization Surveillance Network flow diagram. Abbreviations: AI/AN, American Indian/Alaskan Native; API, Asian/Pacific Islander; COVID-19, coronavirus disease 2019; NH, non-Hispanic; SARS-CoV-2, severe acute respiratory syndrome coronavirus 2. aWeighted %. bIndividual vaccinated with primary series only defined as having received 2 doses of a 2-dose series or 1 dose of a single-dose series ≥14 days before a positive SARS-CoV-2 test. Individuals were considered boosted if they were vaccinated with their primary series and received an additional dose.
Monthly Population-based Rates and RRs by Race/Ethnicity
The overall monthly age-adjusted hospitalization rates peaked from April 2020 through May 2020, December 2020, and January 2022 (Figure 2A ). Hospitalization rates were highest for AI and AN persons (161 and 287.7 per 100 000, respectively) during the first 2 peaks and for Black persons (277.9 per 100 000), followed by AI/AN persons (194.1 per 100 000) during the third peak. Hospitalization rates were highest in the first months of the pandemic for Hispanic (June 2020: RR = 6.7; 95% CI, 6.5–7.1; P < .001), AI/AN (May 2020: RR = 8.4; 95% CI, 8.2–8.7; P < .001), and Black persons (July 2020: RR = 5.3; 95% CI, 5.1–5.5; P ≤ .001) relative to White persons. Hospitalization RRs remained higher, although with reduced magnitude over time. RRs declined to <2.0 for Hispanic, Black, and AI/AN persons after July 2021, February 2022, and March 2022, respectively (Figure 2B ). The monthly RR for API vs White persons was greater in March 2020–September 2020 (RR range, 1.10–1.79) but then decreased, with the lowest RR in October 2021 (RR = 0.33).
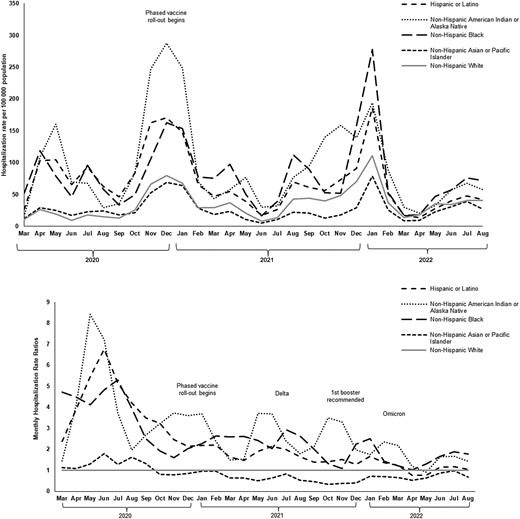
A, Age-adjusted monthly COVID-19–associated hospitalization ratesa by race and ethnicity, COVID-NET, 1 March 2020–31 August 2022. B, Age-adjusted monthly COVID-19–associated hospitalization RRsb,c,d by race and ethnicity, COVID-NET, 1 March 2020–31 August 2022. Abbreviations: AI/AN, American Indian/Alaskan Native; COVID-19, coronavirus disease 2019; COVID-NET, COVID-19–Associated Hospitalization Surveillance Network; RR, rate ratio. aRates exclude persons aged <18 years, hospitalizations with missing or unknown race, or more than 1 race. bNon-Hispanic White persons is the reference group for RR calculation. cHospitalization RR was highest for Hispanic persons in June 2020 (RR = 6.7; 95% CI, 6.5–7.0; P < .001); for AI/AN persons in April 2020 (RR = 8.4; 95% CI, 8.2–8.7; P < .001); and for Black persons in May 2020 (RR = 5.3; 95% CI, 4.6–4.9; P < .001) and remained greater but smaller in magnitude over time; for Hispanic persons after July 2021 (RR < 2.0: P <.001); for AI/AN persons after November 2021(RR < 3.0; P < .001); and for Black persons after July 2021 (RR < 3.0; P <.001). dHospitalization rates for non-Hispanic Asian or Pacific Islander persons consistently lower than for non-Hispanic White persons after September 2020 (RR < 1).
Hospitalization, ICU Admission, and In-Hospital Mortality Rates and RRs, July 2021–August 2022
Among sampled patients, AI/AN persons had the highest cumulative age-adjusted hospitalization (RR, 2.0; 95% CI, 1.9–2.1), ICU admission (RR, 2.4; 95% CI, 2.1–2.6), and in-hospital mortality (RR, 2.9; 95% CI, 2.5–3.4) rates from July 2021 through August 2022 vs White persons (Table 1). Black and Hispanic persons also had greater rates for hospitalization (RR, 1.9; RR, 1.4), ICU admission (RR, 1.8; RR, 1.5), and in-hospital mortality (RR, 1.4; RR, 1.5), respectively, but API persons had lower rates of hospitalization (RR, 0.6) and ICU admission (RR, 0.6) and higher in-hospital mortality (RR, 1.4) vs White persons.
Rate and Rate Ratios of Coronavirus Disease 2019–Associated Hospitalization, Intensive Care Unit Admission, and In-Hospital Mortality by Race/Ethnicity: July 2021–August 2022
| Outcomes | Hispanic or Latino | Non-Hispanic | ||||||||
|---|---|---|---|---|---|---|---|---|---|---|
| American Indian or Alaska Native | Black | Asian or Pacific Islander | White | |||||||
| Rate (95% CI) | RR (95% CI) | Rate (95% CI) | RR (95% CI) | Rate (95% CI) | RR (95% CI) | Rate (95% CI) | RR (95% CI) | Rate (95% CI) | RR (95% CI) | |
| All agesa | ||||||||||
| Hospitalization | 804.7 (792.9–816.6) | 1.4 (1.3–1.4) | 1190.6 (1135.2–1246.0) | 2.0 (1.9–2.1) | 1122.3 (1111.7–1132.8) | 1.9 (1.9–1.9) | 358.5 (350.3–366.6) | 0.6 (0.6–0.6) | 590.1 (586.4–593.8) | 1 |
| ICU admission | 128.7 (124.1–133.3) | 1.5 (1.4–1.5) | 207.9 (185.3–230.6) | 2.4 (2.1–2.6) | 155.3 (151.4–159.3) | 1.8 (1.7–1.8) | 82.5 (78.5–86.5) | 0.9 (0.9–1.0) | 87.9 (86.5–89.3) | 1 |
| In-hospital mortality | 63.4 (59.8–66.9) | 1.5 (1.4–1.6) | 121.4 (103.4–139.4) | 2.9 (2.5–3.4) | 58.2 (55.7–60.6) | 1.4 (1.3–1.5) | 56.5 (53.2–59.9) | 1.4 (1.3–1.4) | 41.7 (40.8–42.7) | 1 |
| 18–49 y | ||||||||||
| Hospitalization | 455.2 (446.3–464.0) | 1.8 (1.7–1.8) | 799.5 (744.8–854.2) | 3.1 (2.9–3.4) | 623.2 (613.8–632.7) | 2.4 (2.4–2.5) | 163.8 (157.3–170.3) | 0.6 (0.6–0.7) | 255.8 (252.3–259.4) | 1 |
| ICU admission | 62.6 (59.3–65.9) | 2.5 (2.3–2.6) | 145.6 (122.2–168.9) | 5.7 (4.8–6.7) | 59.4 (56.5–62.3) | 2.3 (2.2–2.5) | 15.9 (13.9–18.0) | 0.6 (0.5–0.7) | 25.5 (24.4–26.6) | 1 |
| In-hospital mortality | 15.9 (14.3–17.5) | 2.6 (2.2–2.9) | 5.1 (0.7–9.5) | 0.8 (0.3–1.9)b | 12.4 (11.1–13.7) | 2.0 (1.7–2.3) | 6.9 (5.5–8.2) | 1.1 (0.9–1.4)b | 6.2 (5.7–6.8) | 1 |
| 50–64 y | ||||||||||
| Hospitalization | 770.7 (748.8–792.7) | 1.3 (1.2–1.3) | 1366.5 (1248.4–1484.7) | 2.3 (2.1–2.5) | 1229.2 (1208.0–1250.5) | 2.0 (2.0–2.1) | 284.6 (269.7–299.5) | 0.5 (0.4–0.5) | 604.7 (597.1–612.4) | 1 |
| ICU admission | 190.9 (180.0–201.8) | 1.6 (1.5–1.7) | 228.8 (180.5–277.1) | 1.9 (1.5–2.3) | 221.8 (212.7–230.8) | 1.8 (1.7–1.9) | 70.3 (62.9–77.7) | 0.6 (0.5–0.6) | 122.1 (118.7–125.5) | 1 |
| In-hospital mortality | 64.3 (57.9–70.6) | 1.7 (1.5–1.9) | 155.1 (115.3–194.9) | 4.2 (3.2–5.4) | 79.5 (74.1–84.9) | 2.1 (2.0–2.3) | 22.2 (18.0–26.3) | 0.6 (0.5–0.7) | 37.3 (35.4–39.2) | 1 |
| 65+ years | ||||||||||
| Hospitalization | 1827.0 (1779.8–1874.2) | 1.2 (1.1–1.2) | 2013.6 (1838.0–2189.3) | 1.3 (1.2–1.4) | 2365.3 (2328.0–2402.5) | 1.5 (1.5–1.5) | 1021.9 (989.0–1054.8) | 0.7 (0.6–0.7) | 1555.6 (1542.8–1568.5) | 1 |
| ICU admission | 243.7 (226.5–260.9) | 1.1 (1.0–1.2)b | 377.7 (301.6–453.7) | 1.7 (1.4–2.0) | 338.6 (324.5–352.7) | 1.5 (1.4–1.6) | 292.8 (275.2–310.4) | 1.3 (1.2–1.4) | 227.3 (222.3–232.2) | 1 |
| In-hospital mortality | 198.4 (182.9–214.0) | 1.3 (1.2–1.4) | 447.9 (365.1–530.7) | 2.9 (2.4–3.6) | 156.5 (147.0–166.1) | 1.0 (1.0–1.1)b | 246.2 (230.1–262.4) | 1.6 (1.5–1.7) | 151.9 (147.9–155.9) | 1 |
Abbreviations: CI, confidence interval; ICU, intensive care unit; RR, rate ratio.
Rates of coronavirus disease 2019–associated hospitalizations for adults of all ages combined are age-adjusted but not adjusted for vaccination status.
RR not statistically significant.
A similar pattern was observed by race/ethnicity within each age group in which AI/AN persons had the highest RRs for hospitalization and ICU admission (RR, 3.1; RR, 5.7), followed by Black (RR, 2.4; RR, 2.3) and Hispanic persons (RR, 1.8; RR, 2.5), respectively, vs White persons (Table 1). Across age groups, the RRs for hospitalization and ICU admission were greatest for AI/AN (RR, 3.1; RR, 5.7), Black (RR, 2.4; RR, 2.3), and Hispanic persons (RR, 1.8; RR, 2.5), respectively, vs White persons aged 18–49 years. Relative to their White counterparts, the RR for in-hospital mortality was higher among Hispanic (RR, 2.6) and Black persons (RR, 2.0) aged 18–49 years; among AI/AN (RR, 4.2), Black (RR, 2.1), and Hispanic persons (RR, 1.7) aged 50–64 years; and among AI/AN (RR, 2.9) Hispanic persons (RR, 1.3) aged ≥65 years. API persons of all age groups had lower RR for hospitalization; API persons aged ≥65 years had higher RR for ICU admission (RR, 1.3) and in-hospital mortality (RR, 1.6) vs White persons.
Characteristics of COVID-19–Associated Hospitalizations by Vaccination Status, Age Group, and Race/Ethnicity: July 2021–August 2022
Among our analytic sample of hospitalizations from July 2021 through August 2022 (n = 8706), 52.5% (n = 4789) of patients were unvaccinated, 28.2% (n = 2458) were vaccinated with primary series, and 19.5% (n = 1459) were boosted (Figure 1). The proportion of those hospitalized who were vaccinated with a primary series and boosted increased over time (Figure 3). In August 2022, 28.1% of hospitalizations were among unvaccinated, 20.1% among vaccinated with primary series only, and 51.3% among boosted persons. Overall, 58.5% of hospitalizations were among White (n = 5584), 23.5% among Black (n = 1672), 11.7% among Hispanic (n = 1036), 4.9% among API (n = 289), and 1.2% among AI/AN persons (n = 125; Figure 1). In August 2022, most hospitalizations were among White persons (62.2%), followed by Black (23.1%), Hispanic (7.7%), API (6%), and AI/AN persons (1%; data not shown).
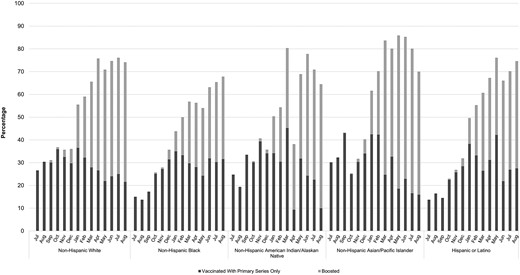
Percentage of coronavirus disease 2019–associated hospitalizations vaccinated with primary series and boosteda by race/ethnicity, July 2021–August 2022. Abbreviation: SARS-CoV-2, severe acute respiratory syndrome coronavirus 2. aIndividual vaccinated with primary series only defined as having received 2 doses of a 2-dose series or 1 dose of a single-dose series ≥14 days before a positive SARS-CoV-2 test. Individuals were considered boosted if they were vaccinated with their primary series and received an additional dose.
Among hospitalizations of unvaccinated patients (n = 4789), more than half were White (53.9%), followed by Black (27.4%), Hispanic (13.4%), API (4.0%), and AI/AN (1.3%). Among hospitalizations of vaccinated patients with their primary series only (n = 2458), a greater proportion were White (61.7%), followed by Black (22.1%), Hispanic (10.4%), API (4.5%), and AI/AN (1.4%). Among hospitalizations of boosted patients (n = 1459), 67% were White, 15.2% were Black, 9.3% were Hispanic, 7.7% were API, and 0.8% were AI/AN (Table 2). In August 2022, 48.3% of hospitalized patients had received boosters; this proportion was 52.5% and 36.2% among White and Black patients, respectively. Among Hispanic, API, and AI/AN patients, the proportion who had received booster doses was 47.1%, 54.1%, and 54.4%, respectively (Figure 3).
Characteristics of Coronavirus Disease 2019–Associated Hospitalizations by Vaccination Status and Race/Ethnicity: July 2021–August 2022
| Characteristics | Total N = 4789 | White N = 2876 | Black N = 1056 | AI/AN N = 67 | API N = 134 | HISP N = 656 |
|---|---|---|---|---|---|---|
| % (95% CI) | 53.9 (51.8–56.1) | 27.4 (25.4–29.4) | 1.3 (0.9–1.8) | 4.0 (2.9–5.1) | 13.4 (12.0–14.7) | |
| Unvaccinated, % (95% CI); n = 4789, 52.5% | ||||||
| Age group, median [IQR], ya | 58 [45–70] | 62 [51–74] | 53 [40–64] | 42 [34–55] | 51 [55–65] | 48 [36–62] |
| 18–49a | 1675 | 22.0 (20.1–24.0) | 42.6 (38.3–46.9) | 58.5 (42.2–74.8) | 21.9 (13.6–30.2) | 51.2 (45.7–56.6) |
| 50–64 | 1860 | 32.5 (30.1–34.8) | 32.0 (28.2–35.8) | 27.0 (14.7–39.3) | 25.8 (12.6–38.9) | 27.2 (22.5–31.8) |
| 65+ | 1254 | 45.5 (42.8–48.3) | 25.5 (20.9–30.0) | 14.5 (0.3–28.7) | 52.3 (38.0–66.7) | 21.7 (16.8–26.5) |
| Sexa | ||||||
| Male | 2557 | 52.9 (50.2–55.5) | 47.8 (43.4–52.2) | 33.5 (18.4–48.7) | 55.1 (40.6–69.6) | 58.4 (53.0–63.7) |
| Female | 2232 | 47.1 (44.5–49.8) | 52.2 (47.8–56.6) | 66.5 (51.3–81.6) | 44.9 (30.4–59.4) | 41.6 (36.3–47.0) |
| LTCF residence | 146 | 4.7 (3.4–6.0) | 3.7 (2.0–5.4) | — | — | 1.3 (0.0–2.6) |
| Number of underlying condition categoriesa | ||||||
| 0 | 730 | 12.2 (10.7–13.6) | 12.5 (9.7–15.2) | 17.7 (5.5–30.0) | 10.1 (4.8–15.4) | 19.3 (15.1–23.6) |
| 1 | 910 | 16.3 (14.3–18.3) | 15.9 (12.9–18.8) | 35.9 (19.8–51.9) | 23.6 (10.9–36.3) | 24.1 (19.3–28.9) |
| 2 | 934 | 18.6 (16.6–20.6) | 16.9 (13.8–19.9) | 18.4 (3.3–33.4) | 29.5 (15.2–43.8) | 22.0 (17.5–26.5) |
| ≥3 | 2215 | 52.9 (50.3–55.6) | 54.8 (50.5–59.1) | 28.1 (13.1–43.1) | 36.9 (23.1–50.6) | 34.6 (29.4–39.8) |
| Median length of stay, in days [IQR], d a | 4.5 [2.3–9.5] | 4.5 [2.3–9.5] | 4.4 [2.1–8.8] | 4.6 [2.8–10] | 5.6 [2.0–8.7] | 4.9 [2.4–11.8] |
| Outcome | ||||||
| ICU admission | 1108 | 21.2 (19.2–23.3) | 21.4 (18.1–24.7) | 24.6 (10.8–38.5) | 22.3 (12.4–32.2) | 24.6 (19.9–29.2) |
| On IMV | 596 | 11.7 (10.1–13.4) | 10.8 (8.5–13.0) | 11.6 (3.4–19.7) | 16.1 (7.3–24.8) | 13.4 (9.9–16.8) |
| In-hospital deatha | 478 | 10.7 (9.2–12.2) | 7.3 (5.5–9.1) | 16.3 (1.6–31.0) | 19.6 (8.7–30.5) | 9.8 (6.5–13.1) |
| ICU or death | 1188 | 23.4 (21.2–25.5) | 22.4 (19.1–25.8) | 34.0 (17.5–50.5) | 28.0 (16.3–39.6) | 25.8 (21.1–30.6) |
| Characteristics | Total N = 2458 | White N = 1681 | Black N = 426 | AI/AN N = 34 | API N = 73 | HISP N = 244 |
|---|---|---|---|---|---|---|
| % (95% CI) | 61.7 (58.5–64.8) | 22.1 (19.2–24.9) | 1.4 (0.8–2.0) | 4.5 (2.8–6.3) | 10.4 (8.5–12.2) | |
| Vaccinated With Primary Series Only,d % (95% CI); n = 2458, 28% | ||||||
| Age group, median [IQR], ya | 68 [56–79] | 72 [59–81] | 65 [54–73] | 54 [50–69] | 64 [43–82] | 58 [43–71] |
| 18–49a | 490 | 12.5 (10.5–14.5) | 16.5 (11.8–21.2) | 22.2 (6.3–38.1) | 29.2 (12.9–45.5) | 33.5 (24.9–42.1) |
| 50–64 | 809 | 20.0 (17.5–22.4) | 32.0 (25.7–38.3) | 48.3 (25.6–71.0) | 21.2 (9.1–33.2) | 24.3 (17.6–31.0) |
| 65+ | 1159 | 67.5 (64.5–70.5) | 51.4 (44.0–58.9) | 29.5 (7.8–51.3) | 49.6 (30.1–69.1) | 42.2 (32.4–52.0) |
| Sex | ||||||
| Male | 1270 | 52.8 (49.3–56.3) | 48.3 (40.8–55.8) | 46.0 (23.2–68.8) | 65.3 (49.1–81.5) | 46.7 (37.4–56.0) |
| Female | 1188 | 47.2 (43.7–50.7) | 51.7 (44.2–59.2) | 54.0 (31.2–76.8) | 34.7 (18.5–50.9) | 53.3 (44.0–62.6) |
| LTCF residenceb | 279 | 15.7 (13.1–18.4) | 8.6 (3.9–13.2) | … | 17.1 (0.0–40.6) | 3.3 (0.2–6.4) |
| Number of underlying conditions | ||||||
| 0 | 162 | 4.7 (3.5–5.9) | 2.6 (1.1–4.0) | … | 8.9 (1.4–16.4) | 8.2 (2.2–14.1) |
| 1 | 245 | 8.7 (6.9–10.5) | 6.4 (3.5–9.4) | … | 8.3 (0.0–16.6) | 12.6 (6.7–18.5) |
| 2 | 315 | 11.3 (9.2–13.4) | 15.4 (9.8–21.1) | 22.9 (1.9–43.9) | 10.7 (1.9–19.5) | 11.8 (6.4–17.2) |
| ≥3 | 1736 | 75.2 (72.4–78.0) | 75.6 (69.3–81.8) | 67.9 (46.5–89.3) | 72.2 (57.8–86.5) | 67.5 (58.7–76.2) |
| Median length of stay,a [IQR], d | 4.1 [2.0–8.4] | 4.4 [2.2–9.0] | 3.8 [1.8–8.0] | 5.5 [2.0–9.2] | 3.0 [1.0–6.4] | 3.5 [1.7–6.1] |
| Outcome | ||||||
| ICU admission b | 464 | 18.1 (15.4–20.7) | 15.1 (9.9–20.3) | 11.8 (2.6–21.0) | 33.1 (11.4–54.8) | 15.7 (10.1–21.2) |
| On IMV a | 228 | 8.2 (6.2–10.2) | 7.0 (3.8–10.2) | … | 27.4 (4.9–49.8) | 6.8 (3.0–10.6) |
| In-hospital deatha | 185 | 9.3 (7.0–11.5) | 6.0 (3.0–9.0) | … | 26.5 (4.0–49.1) | 6.3 (2.5–10.1) |
| ICU or deathb | 519 | 21.8 (18.9–24.7) | 15.8 (10.5–21.0) | 13.0 (3.3–22.6) | 35.7 (14.4–57.1) | 15.7 (10.1–21.2) |
| Characteristics | Total N = 1459 | White N = 1027 | Black N = 190 | AI/AN N = 24 | API N = 82 | HISP N = 136 |
|---|---|---|---|---|---|---|
| % (95% CI) | 67.0 (63.3–70.7) | 15.2 (12.2–18.1) | 0.8 (0.4–1.2) | 7.8 (5.4–10.1) | 9.3 (7.1–11.5) | |
| Boosted,c % (95% CI), n = 1459, 19.5% | ||||||
| Age group, median [IQR], ya | 73 [61–82] | 76 [66–84] | 67 [56–75] | 64 [52–90] | 73 [51–85] | 61 [47–71] |
| 18–49a | 217 | 7.5 (5.5–9.4) | 11.4 (5.4–17.4) | 20.3 (1.2–39.4) | 22.5 (8.5–36.6) | 26.2 (15.1–37.4) |
| 50–64 | 502 | 14.6 (12.2–17.1) | 31.2 (21.6–40.8) | 29.3 (9.4–49.2) | 13.5 (6.4–20.5) | 31.2 (20.7–41.6) |
| 65+ | 740 | 77.9 (74.8–80.9) | 57.4 (47.0–67.8) | 50.3 (23.9–76.7) | 64.0 (49.3–78.7) | 42.6 (29.8–55.4) |
| Sex | ||||||
| Male | 748 | 50.6 (46.2–55.1) | 59.7 (49.6–69.9) | 39.7 (14.4–65.0) | 46.6 (30.7–62.5) | 59.4 (47.5–71.2) |
| Female | 711 | 49.4 (44.9–53.8) | 40.3 (30.1–50.4) | 60.3 (35.0–85.6) | 53.4 (37.5–69.3) | 40.6 (28.8–52.5) |
| LTCF residencea | 227 | 21.5 (17.7–25.2) | 9.1 (4.3–14.0) | … | 6.4 (0.2–12.6) | 8.6 (2.1–15.0) |
| Number of underlying condition categories b | ||||||
| 0 | 95 | 4.0 (2.4–5.6) | 8.6 (2.9–14.3) | … | 14.9 (1.5–28.3) | 8.4 (2.3–14.5) |
| 1 | 121 | 6.9 (4.9–9.0) | 2.9 (0.0–6.7) | … | 10.4 (1.7–19.2) | 9.4 (1.6–17.3) |
| 2 | 173 | 10.5 (8.0–12.9) | 9.7 (3.0–16.3) | … | 16.0 (5.2–26.8) | 9.8 (4.0–15.5) |
| ≥3 | 1070 | 78.6 (75.2–82.0) | 78.9 (70.0–87.7) | 79.8 (60.8–98.9) | 58.7 (43.0–74.4) | 72.4 (61.8–83.0) |
| Median length of stay, [IQR], da | 3.8 [1.9–9.2] | 4.1 [2.0–9.1] | 3.3 [1.809.2] | 4.4 [2.6–7.7] | 2.7 [1.6–7.3] | 3.2 [1.7–5.5] |
| Outcomes | ||||||
| ICU admission | 214 | 14.3 (11.1–17.5) | 15.9 (8.1–23.7) | 16.6 (0.0–37.2) | 20.4 (8.1–32.7) | 14.7 (5.3–24.0) |
| On IMV | 93 | 6.5 (4.3–8.8) | 7.8 (2.1–13.4) | … | … | 6.6 (0.4–12.7) |
| In-hospital death | 69 | 6.2 (4.0–8.5) | 6.1 (0.6–11.5) | … | … | 7.4 (0.5–14.4) |
| ICU or death | 236 | 17.0 (13.6–20.4) | 16.0 (8.2–23.8) | 16.6 (0.0–37.2) | 20.4 (8.1–32.7) | 18.2 (8.1–28.3) |
Table includes sampled cases between July 2021 and August 2022, N = 6022.
Abbreviations: AI/AN, American Indian/Alaskan Native; API, Asian/Pacific Islander; CI, confidence interval; HISP, Hispanic; ICU, intensive care unit; IMV, invasive mechanical ventilation; IQR, interquartile range; LTCF, long-term care facility.
Statistically significant at P < .001, which was set to account for multiple comparisons across race/ethnicity, vaccination status, and characteristics and to reduce the probability for type I error.
Statistically significant at P < .05.
Individual vaccinated with primary series only was defined as having received 2 doses of a 2-dose series or 1 dose of a single-dose series ≥14 days before a positive severe acute respiratory syndrome coronavirus 2 test. Individuals were considered boosted if they were vaccinated with their primary series and received an additional dose.
Age distributions by race/ethnicity differed among unvaccinated, vaccinated with primary series only, and boosted patients (Table 2). Among hospitalized unvaccinated White persons, 45.5% were aged ≥65 years. Of unvaccinated Black, Hispanic, and AI/AN persons, 25.5%, 21.7%, and 14.5% were aged ≥65 years, respectively, and 42.6%, 51.2%, and 58.5% were aged 18–49 years, respectively. Among hospitalized patients vaccinated with primary series only, 67.5% of White, 51.4% of Black, 49.6% of API, and 42.2% of Hispanic patients were aged ≥65 years; 48.3% of AI/AN patients were aged 50–64 years. Among hospitalizations of boosted patients, 77.9% of White persons were aged ≥65 years.
More than half of hospitalized unvaccinated White and Black persons had 3 or more underlying medical condition categories (52.9% and 54.8%, respectively; Table 2). Among hospitalized unvaccinated patients, there were differences in the proportion with hypertension, obesity, chronic lung disease, chronic obstructive pulmonary disease (COPD), cardiovascular disease, heart failure, coronary artery disease, neurologic disease, and renal disease across race/ethnicity groups (Supplementary Table 2). Among hospitalizations of vaccinated patients with primary series only and boosted patients, the distributions of underlying medical conditions were similar across race/ethnicity, except for COPD (Supplementary Table 2).
No statistically significant differences in ICU admission or death were observed across race/ethnicity within unvaccinated, vaccinated with primary series only, and boosted groups (Table 2). A greater proportion of unvaccinated AI/AN persons were admitted to the ICU or died (34.0%), but this was not statistically different from other unvaccinated race/ethnicity groups (22.4%–34.0%).
DISCUSSION
In this US multisite population-based surveillance network study, race/ethnicity disparities in COVID-19–associated hospitalization rates persisted from March 2020 through August 2022. From July 2021 through August 2022, AI/AN, Black, and Hispanic persons had higher rates of hospitalization, ICU admission, and in-hospital mortality than White persons. Disparities in hospitalization and ICU admission rates between AI/AN, Black, and Hispanic persons vs their White counterparts were greatest in younger patients (aged 18–49 years). Among patients with hospitalizations during this time, more than half were unvaccinated. Among unvaccinated Hispanic and AI/AN persons, more than half of hospitalizations were among adults aged 18–49 years, while the largest proportion of hospitalized unvaccinated White persons were aged ≥65 years, and only 22% were aged 18–49 years. In our analysis, severe outcomes did not differ by race/ethnicity within vaccination groups.
While race/ethnicity disparities persisted throughout the study period, the RR magnitudes for hospitalization, ICU admission, and in-hospital mortality from July 2021 through August 2022 were smaller than previously observed for Hispanic, AI/AN, and Black persons [2], suggesting a reduction in disparities. Furthermore, while API persons had higher rates of hospitalization, ICU admission, and in-hospital mortality in the first few months of the pandemic, rates for this population became consistently lower compared with White persons, with the exception of those aged ≥65 years. In contrast, AI/AN persons continue to be disproportionately affected by COVID-19, a finding similar to that from other studies [19,20]. This study was not designed to examine reasons for observed race/ethnicity disparities. Contributing factors may include differences in exposure; patient-specific underlying conditions [4,21,22]; differential distribution of age across race/ethnicity [23]; overall reduction in morbidity/mortality during Omicron predominance [24,25]; healthcare access and treatment, including vaccination utilization, prescribing, and dispensing of antiviral medications [26] and receipt of monoclonal antibody therapies [27]; and systemic social inequities [5,28,29]. For example, National Immunization Survey data from August 2022 indicate that primary series vaccination coverage and booster coverage among those with a completed primary series were highest in non-Hispanic Asian persons and lowest in non-Hispanic Black persons [30]. However, due to a lack of reliable race/ethnicity population denominator data from IIS, we were unable to calculate rates and RRs of hospitalization, ICU admission, or death by vaccination status.
From July 2021 through August 2022, AI/AN, Black, and Hispanic persons aged 18–49 years had the highest RRs for hospitalization and ICU admission vs their White counterparts. We also found that a greater proportion of unvaccinated AI/AN, Black, and Hispanic persons were aged 18–49 years. Explanations for these findings are likely multifactorial, including a reflection of differential underlying medical conditions and age distributions across race and ethnicity groups, as US census data indicate that a greater proportion of Hispanic (69%), Black (60%), and AI/AN (59%) persons vs White persons (48%) are aged 18–49 years [23]. Although race/ethnicity disparities in vaccination coverage have narrowed over time [31,32], our findings suggest that continued outreach to younger AI/AN, Black, and Hispanic populations to promote vaccination coverage and other strategies [33] to prevent hospitalization may be helpful in closing persistent racial and ethnic disparities.
In our study, more than half of hospitalizations were among unvaccinated individuals from July 2021 through August 2022. COVID-19 mRNA vaccinations are effective at preventing hospitalization [9,34] and severe outcomes [6,8,35]. Risk for hospitalization and death from COVID-19 is highest among adults who are unvaccinated vs vaccinated with primary series [36] and lowest among adults with booster doses [37]. Therefore, ensuring equitable access to vaccinations and addressing vaccine hesitancy and misinformation continue to be important public health interventions. A growing proportion of hospitalized patients are expected to be vaccinated as coverage increases. In our study, approximately half of all patients hospitalized in August 2022 had received an additional or booster dose. In March 2022, second booster doses were recommended for people aged >50 years and people aged ≥12 years with immunocompromised conditions [12]. Bivalent booster doses were recommended for all persons aged ≥12 years in the fall of 2022 [38]. These additional doses may be a critical tool in preventing severe COVID-19 outcomes [34]. Furthermore, increasing evidence suggests that early outpatient antiviral treatment may reduce risk for hospitalization and death, irrespective of vaccination status [39,40]. However, one study found that while dispensing rates of antivirals increased from December 2021 through May 2022, rates were lowest in zip code areas with high social vulnerability [26]. In addition to promoting vaccine coverage and staying up to date on vaccinations, equitable prescribing, dispensing, and receipt of treatment (eg, antiviral medications) and multiple nonpharmaceutical and medical prevention measures [33] that protect those at high risk of severe COVID-19 illness are critical to reduction of ongoing racial and ethnic disparities in COVID-19–associated morbidity and mortality.
This study has a few limitations. First, COVID-NET is designed primarily to provide population-based hospitalization rates and not to explicitly explore social determinants of health. Second, as SARS-CoV-2 testing was conducted at the discretion of healthcare providers, COVID-NET may not capture all COVID-19–associated hospitalizations. Third, our analysis may have included hospitalizations where COVID-19 was not the primary reason for admission, and this may have varied by race/ethnicity; however, COVID-19 likely still affected clinical decisions and outcomes. Fourth, the combination of underlying medical conditions into categories may have masked greater individual health burden. Fifth, the sample size of the AI/AN subgroup was too limited to allow for further analysis. Sixth, use of the Bonferroni method to adjust for multiple comparisons may have resulted in conservative interpretation of significant findings. Seventh, persons of multirace/multiethnicity were excluded due to lack of population denominators from 2020 NCHS Vintage bridged-race postcensal population estimates. Additionally, people who identified as 1 race but were missing ethnicity (6% of all patients) were presumed to be non-Hispanic, potentially resulting in an underestimate of Hispanic individuals. Finally, although the racial and ethnic distribution in COVID-NET is similar to that of the US population (COVID-NET: Hispanic, 14.1%; AI/AN, 0.7%; API, 8.9%; Black, 17.9%; White, 58.5%; United States: Hispanic, 18.5%; AI/AN, 0.8%; API, 6.3%; Black, 13.2%; White, 61.2%) [2], COVID-NET represents only approximately 10% of the United States. These data may not be generalizable to the entire US population and may be impacted by regional SARS-CoV-2 spread.
CONCLUSIONS
Our analysis of population-based surveillance data suggests that although reduced in magnitude, race/ethnicity disparities in hospitalizations persist in the era of COVID-19 vaccination. Additionally, this study identifies populations that may benefit from targeted public health interventions, including increased vaccine coverage. Development of strategies to ensure equitable vaccination and treatment access remains important.
Supplementary Data
Supplementary materials are available at Clinical Infectious Diseases online. Consisting of data provided by the authors to benefit the reader, the posted materials are not copyedited and are the sole responsibility of the authors, so questions or comments should be addressed to the corresponding author.
Notes
The following are members of the COVID-NET Surveillance Team: Pam Daily Kirley, MPH (California Emerging Infections Program); Breanna Kawasaki, MPH (Colorado Department of Public Health and Environment); Kimberly Yousey-Hindes, MPH (Connecticut Emerging Infections Program, Yale School of Public Health); Kyle P. Openo, DrPH (Georgia Emerging Infections Program, Georgia Department of Public Health; Emory University School of Medicine); Justin Henderson, MPH (Michigan Department of Health and Human Service); Erica Bye, MPH (Minnesota Department of Health); Florent Nkouaga, PhD (New Mexico Department of Health*); Nancy Spina, MPH (New York State Department of Health); Sophrena Bushey, MHS (University of Rochester School of Medicine and Dentistry); Eli Shiltz, MPH (Ohio Department of Health); Nasreen Abdullah, MD, MPH (Public Health Division, Oregon Health Authority); William Schaffner, MD (Vanderbilt University Medical Center); and Andrea Price, LPN (Salt Lake County Health Department). *Florent Nkouaga is now with the New Mexico Office of Superintendent of Insurance.
Acknowledgments. The authors thank the following: Rebecca Longson, Gretchen Rothrock, Jeremy Roland, Joelle Nadle, Ashley Coates, Monica Napoles, Susan Brooks, Tiffany Tsukuda: California Emerging Infections Program. Isaac Armistead, Sharon Emmerling, Madelyn Lensing, Sarah McLafferty, Jordan Surgnier, Millen Tsegaye: Colorado Department of Public Health and Environment. Ann Basting, Tessa Carter, Maria Correa, Daewi Kim, Carol Lyons, Amber Maslar, Julie Plano, Hazhia Sorosindi: Connecticut Emerging Infections Program, Yale School of Public Health. Emily Fawcett, Annabel Patterson, Taylor Eisenstein, Gracie Chambers: Foundation for Atlanta Veterans Education and Research, Atlanta Veterans Affairs Medical Center, Georgia Emerging Infections Program, Georgia Department of Public Health. Katelyn Ward, Jana Manning, Asmith Joseph, Allison Roebling, Chandler Surell, Stephanie Lehman, Suzanne Segler, Grayson Kallas, Marina Bruck, Rayna Ceaser, Sabrina Hendrick, Johanna Hernandez, Hope Wilson: Emory University School of Medicine, Georgia Emerging Infections Program, Georgia Department of Public Health, Atlanta Veterans Affairs Medical Center. Kenzie Teno: Iowa Department of Public Health. Jim Collins, Shannon Johnson, Sue Kim, Libby Reeg, Val Tellez Nunez, Lauren Leegwater, Chloe Brown, Alyanna Melicor, Sanchitha Meda: Michigan Department of Health and Human Services. Kayla Bilski, Natalie Bullis, Kathryn Como-Sabetti, Emma Contestabile, Claire Henrichsen, Grace Hernandez, Jackie Johnson, Lisa Nguyen, Kieu My Phi: Minnesota Department of Health. Daniel M. Sosin, Chad Smelser, Susan L. Ropp, Sunshine Martinez, Jasmyn Sanchez, Cory Cline, Melissa Judson, Mark Montoya, Kelly Plymesser, Adrienne Domen: New Mexico Department of Health. Sarah Lathrop, Kathy M. Angeles, Yadira Salazar-Sanchez, Sarah A. Khanlian, Nancy Eisenberg, Sarah Shrum Davis, Emily Hancock, Molly Bleecker, Wickliffe Omondi, Mayvilynne Poblete, Francesca Pacheco: New Mexico Emerging Infections Program. Yassir Talha, Celina Chavez, Jennifer Akpo, Alesia Reed, Murtada Khalifa: CDC Foundation, New Mexico Department of Health. Alison Muse, Kerianne Engesser, Adam Rowe: New York State Department of Health. Virginia Cafferky, Christina Felsen, Maria Gaitan, RaeAnne Kurtz, Christine Long, Thomas Peer, Kevin Popham: University of Rochester School of Medicine and Dentistry. Julie Freshwater, Denise Ingabire-Smith, Nancy Moran, Ann Salvator, Rebekah Sutter: Ohio Department of Health. Sam Hawkins: Public Health Division, Oregon Health Authority. Tiffanie Markus, Katie Dyer, Karen Leib, Terri McMinn, Danielle Ndi, Gail Hughett, Emmanuel Sackey, Kathy Billings, Anise Elie, Manideepthi Pemmaraju: Vanderbilt University Medical Center. Amanda Carter, Andrea George, Andrew Haraghey, Emily Roberts, Keegan McCaffrey, Laine McCullough, Mary Hill, Melanie Crossland, Ryan Chatelain: Salt Lake County Health Department.
Disclaimer. The findings and conclusions presented here are those of the authors and do not necessarily represent the official position of the Centers for Disease Control and Prevention (CDC).
Financial support. This work was supported by the CDC through an Emerging Infections Program cooperative agreement (grant CK17-1701) and through a Council of State and Territorial Epidemiologists cooperative agreement (grant NU38OT000297-02-00). A. K. was supported in part by grants to the Michigan Department of Health and Human Services.
References
Author notes
O. A. is now solely with the Centers for Disease Control and Prevention.
E. J. A. is now an employee of Moderna, Inc.
Potential conflicts of interest. E. J. A. reports clinical trial grants from Regeneron, Pfizer, Merck, PaxVax, Micron, Sanofi-Pasteur, Janssen, MedImmune, Moderna, and GSK; consulting fees from Pfizer, Sanofi-Pasteur, GSK, Janssen, Moderna, and Medscape; personal fees from Kentucky Bioprocessing, Inc, and Sanofi-Pasteur, for participation on data and safety monitoring boards; personal fees from WCG and ACI Clinical for participation on a data adjudication board; and is a current employee of Moderna, outside the submitted work. His institution has received funding from the National Institutes of Health to conduct clinical trials of COVID-19 vaccines. A. W. reports grants from the CDC/Council of State and Territorial Epidemiologists for flu surveillance (eg, Youth in Agriculture, Enhancing Laboratory Capacity). L. M. B. reports grants from the CDC via Epidemiology and Laboratory Capacity and Immunizations and Vaccines for Children. R. L. reports a role as associate editor for the American Academy of Pediatrics Red (Report on the Committee on Infectious Diseases).
All remaining authors: No reported conflicts of interest. All authors have submitted the ICMJE Form for Disclosure of Potential Conflicts of Interest. Conflicts that the editors consider relevant to the content of the manuscript have been disclosed.

