


Abstract
Currently, the United States has the largest number of reported coronavirus disease 2019 (COVID-19) cases and deaths globally. Using a geographically diverse surveillance network, we describe risk factors for severe outcomes among adults hospitalized with COVID-19.
We analyzed data from 2491 adults hospitalized with laboratory-confirmed COVID-19 between 1 March–2 May 2020, as identified through the Coronavirus Disease 2019–Associated Hospitalization Surveillance Network, which comprises 154 acute-care hospitals in 74 counties in 13 states. We used multivariable analyses to assess associations between age, sex, race and ethnicity, and underlying conditions with intensive care unit (ICU) admission and in-hospital mortality.
The data show that 92% of patients had ≥1 underlying condition; 32% required ICU admission; 19% required invasive mechanical ventilation; and 17% died. Independent factors associated with ICU admission included ages 50–64, 65–74, 75–84, and ≥85 years versus 18–39 years (adjusted risk ratios [aRRs], 1.53, 1.65, 1.84, and 1.43, respectively); male sex (aRR, 1.34); obesity (aRR, 1.31); immunosuppression (aRR, 1.29); and diabetes (aRR, 1.13). Independent factors associated with in-hospital mortality included ages 50–64, 65–74, 75–84, and ≥ 85 years versus 18–39 years (aRRs, 3.11, 5.77, 7.67, and 10.98, respectively); male sex (aRR, 1.30); immunosuppression (aRR, 1.39); renal disease (aRR, 1.33); chronic lung disease (aRR 1.31); cardiovascular disease (aRR, 1.28); neurologic disorders (aRR, 1.25); and diabetes (aRR, 1.19).
In-hospital mortality increased markedly with increasing age. Aggressive implementation of prevention strategies, including social distancing and rigorous hand hygiene, may benefit the population as a whole, as well as those at highest risk for COVID-19–related complications.
Since severe acute respiratory syndrome coronavirus-2 (SARS-CoV-2), was first identified in China in December 2019, approximately 6 million cases of coronavirus disease 2019 (COVID-19) have been reported globally [1]. As of 7 July 2020, approximately 3 million cases, including ~130 000 deaths, have been reported in the United States, and case counts continue to rise [1], with evidence of widespread community transmission [2].
Reports from China, Italy, and New York City have demonstrated that hospitalized COVID-19 patients are generally older and have underlying medical conditions, such as hypertension and diabetes [3–5]. These studies have also found that older patients and those with certain underlying medical conditions were at higher risk for severe outcomes [3, 6, 7]. Among cases reported to the US Centers for Disease Control and Prevention from local and state health departments, the prevalence of underlying medical conditions increased as the severity of infections increased [8, 9], although findings were limited by incomplete information. Questions remain about the independent associations of sex, race and ethnicity, and specific underlying conditions with severe outcomes among persons hospitalized with COVID-19, after adjusting for age and other potential confounders.
Comprehensive data on US patients with severe COVID-19 infections are needed to better inform clinicians’ understanding of which groups are at risk for poor outcomes and to inform prevention efforts and future interventions. We implemented population-based surveillance for laboratory-confirmed COVID-19–associated hospitalizations, collecting clinical data from hospitalized patients in 154 hospitals in 13 states beginning 1 March 2020. Using a convenience sample of patients identified though this surveillance system, we describe the characteristics of US adults hospitalized with COVID-19 and assess risk factors for intensive care unit (ICU) admission and in-hospital mortality.
METHODS
Surveillance Overview
The Coronavirus Disease 2019–Associated Hospitalization Surveillance Network (COVID-NET) has been previously described [10]. Eligible COVID-19–associated hospitalizations occurred among persons who (1) resided in a predefined surveillance catchment area; and (2) had a positive SARS-CoV-2 test within 14 days prior to or during hospitalization.
COVID-NET surveillance occurs in acute-care hospitals within 99 counties in 14 states (California, Colorado, Connecticut, Georgia, Iowa, Maryland, Michigan, Minnesota, New Mexico, New York, Ohio, Oregon, Tennessee, and Utah), covering a catchment population of approximately 32 million persons (~10% of the US population). COVID-NET surveillance was initiated for cases with hospital admission on or after 1 March 2020. Although COVID-NET includes all age groups, for this analysis, we excluded children <18 years of age due to small counts (n = 101) and 1 surveillance site (Iowa) for which medical chart abstractions were not conducted. We also excluded patients who were still hospitalized at the time of this analysis and all patients for whom medical chart abstractions had not yet been completed as of 2 May 2020. Because the COVID-19 pandemic limited the ability of surveillance officers to access medical records at facilities, patients were more likely to be included in this analysis if they were hospitalized at facilities that allowed remote chart access, participated in Health Information Exchanges, or were able to mail or fax records.
Laboratory-confirmed COVID-19–associated hospitalizations were identified using laboratory and reportable condition databases, hospital infection control databases, electronic medical records, and/or reviews of hospital discharge records. Laboratory tests were ordered at the discretion of the treating health-care provider.
Medical chart reviews were conducted by trained surveillance officers using a standard case report form. Underlying medical conditions were categorized into major groups (Supplementary Appendix Table 1). Obesity and severe obesity were defined as a calculated body mass index ≥30 kg/m2 and ≥40 kg/m2, respectively. Chest radiograph results were obtained from the radiology reports and not from review of the original radiograph. We defined severe outcomes as either ICU admission or in-hospital mortality.
Statistical Analysis
After the exclusions noted above, we included adults hospitalized within 154 acute-care hospitals in 74 counties in 13 states with an admission date during 1 March–2 May 2020 who had either been discharged from the hospital or died during hospitalization and had complete medical chart abstractions. We calculated proportions using the number of patients with data available on each characteristic as the denominator.
We examined the association of demographic factors, underlying medical conditions, and use of angiotensin-converting enzyme inhibitors and angiotensin receptor blockers prior to hospitalization with ICU admission and in-hospital death using chi-square tests. Variables considered for inclusion in the final models included being a current or former smoker; a history of hypertension, obesity, diabetes, chronic lung disease (CLD), cardiovascular disease (CVD; excluding hypertension), neurologic disorders, renal disease, immunosuppression, gastrointestinal/liver disease, hematologic conditions, rheumatologic/autoimmune conditions; and use of angiotensin-converting enzyme inhibitors or angiotensin receptor blockers prior to hospitalization. All multivariable models included age groups (18–39, 40–49, 50–64, 65–74, 75–84, and ≥ 85 years), sex, and race and ethnicity; models incorporated clustering by site to account for geographic differences. Other variables with P values < .10 in bivariate analyses were included in the multivariable analyses. Log-linked Poisson generalized estimating equation regression with an exchangeable correlation matrix [11, 12] was used to generate adjusted risk ratios (aRR) and 95% confidence intervals (95% CIs) for the risk of ICU admission and in-hospital death. Additional multivariable models were used to examine the association between the number of underlying medical conditions and ICU admission or in-hospital death. We considered 2-sided P-values < .05 to be statistically significant. All analyses were performed using SAS 9.4 software (SAS Institute Inc.).
These data were collected as part of routine public health surveillance and determined to be nonresearch by the Centers for Disease Control and Prevention. Participating sites obtained approval for the COVID-NET surveillance protocol from their respective state and local Institutional Review Boards, as required.
RESULTS
A total of 2491 COVID-19–associated hospitalized adults from 13 surveillance sites were included (Supplementary Appendix Figure 1). Patients came from 43% (154/357) of the acute-care hospitals included in COVID-NET surveillance across the 13 sites (Supplementary Appendix Table 2). The median age and sex distributions of included and excluded patients were similar (Supplementary Appendix Table 3).
Characteristics of Hospitalized Patients with COVID-19
Among the 2491 hospitalized adults, the median age was 62 years (interquartile range [IQR], 50–75), and almost 75% were ≥ 50 years (Table 1). For race and ethnicity, which was abstracted by surveillance officers, 47% of patients (n = 1178/2490) were non-Hispanic White, 30% were non-Hispanic Black (n = 755/2490), and 12% were Hispanic (n = 306/2490). Nearly one-third of patients were current or former smokers.
Demographic and Clinical Characteristics
| n (%) | |
|---|---|
| Age in years, median (IQR) | 62 (50–75) |
| Age category | |
| 18–39 | 302 (12.1) |
| 40–49 | 319 (12.8) |
| 50–64 | 744 (29.9) |
| 65–74 | 478 (19.2) |
| 75–84 | 397 (15.9) |
| 85+ | 251 (10.1) |
| Male | 1326 (53.2) |
| Race/ethnicity, n = 2490 | |
| Non-Hispanic White | 1178 (47.3) |
| Non-Hispanic Black | 755 (30.3) |
| Hispanic | 306 (12.3) |
| Non-Hispanic othera | 158 (6.3) |
| Unknown | 93 (3.7) |
| Residence at time of hospitalization, n = 2482 | |
| Private residence | 1899 (76.5) |
| Facilityb | 495 (19.9) |
| Homeless/shelter | 40 (1.6) |
| Otherc | 45 (1.8) |
| Unknown | 3 (.1) |
| Smoker, n = 2489 | |
| Current | 150 (6.0) |
| Former | 642(25.8) |
| No or unknown | 1697 (68.2) |
| Any underlying condition,d n = 2489 | 2278 (91.5) |
| Hypertension, n = 2488 | 1428 (57.4) |
| Obesity,e n = 2322 | 1154 (49.7) |
| Severe obesity,e n = 2322 | 325 (14.0) |
| Chronic metabolic disease, n = 2486f | 1024 (41.2) |
| Diabetes mellitus, n = 2486 | 819 (32.9) |
| Chronic lung disease, n = 2484 | 747 (30.1) |
| Asthma, n = 2484 | 314 (12.6) |
| Chronic obstructive pulmonary disease, n = 2484 | 266 (10.7) |
| Cardiovascular disease, n = 2486 | 859 (34.6) |
| Coronary artery disease, n = 2486g | 352 (14.2) |
| Congestive heart failure, n = 2486 | 284 (11.4) |
| Neurologic disease, n = 2484 | 548 (22.1) |
| Renal disease, n = 2488 | 386 (15.5) |
| Immunosuppressive condition, n = 2487h | 263 (10.6) |
| Gastrointestinal or liver disease, n = 2486 | 118 (4.7) |
| Hematologic condition, n = 2483 | 80 (3.2) |
| Rheumatologic or autoimmune disease, n = 2486 | 77 (3.1) |
| Pregnancy, n = 279i | 36 (12.9) |
| Number of underlying medical conditions, by major category, n = 2490 | |
| 0 | 212 (8.5) |
| 1 | 480 (19.3) |
| 2 | 510 (20.5) |
| 3+ | 1288 (51.7) |
| Medication use prior to hospitalization | |
| ACE-inhibitor, n = 1892 | 316 (16.7) |
| Angiotensin receptor blocker, n = 1895 | 257 (13.6) |
Data are of adults hospitalized with COVID-19, through COVID-NET, at 13 sites (n = 2491).
Abbreviations: ACE, angiotensin-converting enzyme; BMI, body mass index; COVID-19, coronavirus disease 2019; COVID-NET, COVID-19-Associated Hospitalization Surveillance Network; IQR, interquartile range.
aNon-Hispanic other includes: non-Hispanic American Indian or Alaskan Native (n = 24), non-Hispanic Asian or Pacific Islander (n = 128), and non-Hispanic multiracial (n = 6).
bFacility includes rehabilitation facilities, assisted living/residential care homes, group homes, nursing homes, skilled nursing facilities, long-term care facilities, long-term acute-care hospitals, alcohol/drug treatment centers, and psychiatric facilities.
cOther includes home with services (n = 43), correctional facility (n = 1), and hospice (n = 1).
dSee Supplementary Table 1 for definitions of underlying medical conditions.
eObesity is defined as a BMI ≥ 30 kg/m2, and severe obesity is defined as a BMI ≥ 40 kg/m2.
fChronic metabolic disease includes thyroid dysfunction (n = 191), parathyroid dysfunction (n = 11), adrenal disorder (n = 4), metabolic syndrome (n = 2), hyper-/hypo-function of the pituitary gland (n = 1), and inborn errors of metabolism (n = 1).
gIncludes coronary artery disease, history of coronary artery bypass grafting, and history of myocardial infarction.
hImmunosuppressive condition includes steroid therapy within 2 weeks prior to hospital admission (n = 106), immunosuppressive therapy within the 12 months previous to hospital admission (n = 83), solid organ malignancy (n = 58), solid organ transplant (n = 28), human immunodeficiency virus infection (n = 23), metastatic cancer (n = 21), leukemia (n = 11), multiple myeloma (n = 6), lymphoma/Hodgkin’s/non-Hodgkin’s (n = 5), immunoglobulin deficiency/immunodeficiency (n = 4), hematopoietic stem cell transplant (n = 3), and graft-vs-host disease (n = 1).
iDenominator includes women aged 15–49 years.
Almost all patients (n = 2278/2489, 92%) had ≥1 underlying medical condition, with hypertension (n = 1428/2488, 57%), obesity (n = 1154/2332, 50%), and chronic metabolic disease (n = 1024/2486, 41%) most frequently documented. Among patients with chronic metabolic disease, 80% (n = 819/1024) had diabetes mellitus; hypertension alone was documented in only 4% (n = 91/2490) of patients. The proportion of patients with any documented underlying medical condition increased with age (P < .05; Figure 1A). Prevalences of CLD, neurologic conditions, obesity, and renal disease varied between males and females (P values < .05; Figure 1B). CVD, CLD, and neurologic conditions were more prevalent among non-Hispanic Whites, while diabetes, hypertension, obesity, and renal disease were more common among non-Hispanic Blacks (P values < .05; Figure 1C).
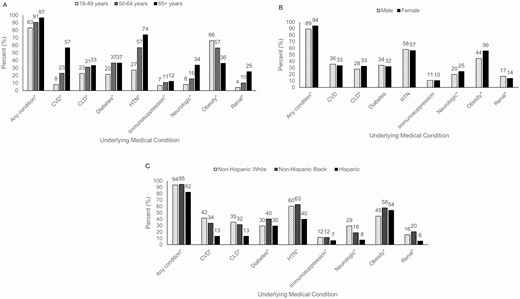
Select underlying medical conditions of adults hospitalized with COVID-19, by (A) age (n = 2489), (B) sex (n = 2489), and (C) race and ethnicity (n = 2488). Data are from COVID-NET at 13 sites (n = 2491). The underlying medical condition categories are not mutually exclusive. Patients can have more than 1 underlying medical condition. *P value < .05. Abbreviations: CLD, chronic lung disease; COVID-19, coronavirus disease 2019; COVID-NET, COVID-19-Associated Hospitalization Surveillance Network; CVD, cardiovascular disease (excluding hypertension); HTN, hypertension.
Cough (75%), fever or chills (74%), and shortness of breath (70%) were commonly documented symptoms at admission (Table 2; Supplementary Appendix Table 4). Gastrointestinal symptoms, including nausea, vomiting, and diarrhea, were documented in almost 30% of patients. The median length of hospitalization was 6 days (IQR, 3–11). The median values of initial vital signs were within normal range, except for elevated blood pressure (Table 2). Pathogens were detected from positive blood cultures in 33 individuals (Supplementary Appendix Table 5). Viral codetections from respiratory specimens were rare among those who were tested (n = 38/1549, 2.5%; Supplementary Appendix Table 6). Among 1932 patients with a chest radiograph performed, 92% (n = 1769) radiographs were documented as abnormal (Table 2; Supplementary Appendix Table 7). Of patients with a chest computerized tomography (CT), 95% (n = 540/566) had abnormal findings, and ground glass opacity was documented in 62% (n = 350/566; Table 2; Supplementary Appendix Table 7).
Clinical Course, Interventions, and Outcomes
| n (%) | |
|---|---|
| Symptoms on admission,a n = 2482 | |
| Cough | 1855 (74.7) |
| Fever or chills | 1835 (73.9) |
| Shortness of breath | 1740 (70.1) |
| Muscle aches/myalgias | 722 (29.1) |
| Diarrhea | 676 (27.2) |
| Nausea or vomiting | 621 (25.0) |
| Hospitalization length of stay in days, median (IQR), n = 2487 | 6 (3–11) |
| Days from symptom onset to hospitalization, median (IQR), n = 1937 | 6 (3–8) |
| Initial vital signs | |
| Temperature, ℃, median (IQR), n = 2469 | 37.4 (36.9–38.1) |
| Heart rate, median (IQR), n = 2479 | 95 (83–108) |
| Systolic blood pressure, median (IQR), n = 2483 | 132 (118–147) |
| Respiratory rate, median (IQR), n = 2461 | 20 (18–23) |
| Oxygen saturation, among those on room air, median (IQR), n = 1969 | 94 (92–97) |
| Initial laboratory values | |
| White blood cell count, median (IQR), per mm3, n = 2458 | 6.3 (4.7–8.5) |
| Hematocrit, median (IQR), %, n = 2461 | 40.6 (36.9–43.9) |
| Platelet count, median (IQR), per mm3, n = 2461 | 195.0 (156.0–249.0) |
| Sodium, median (IQR), mmol/L, n = 2460 | 137.0 (134.0–139.0) |
| Blood urea nitrogen, median (IQR), mg/dl, n = 2443 | 16.0 (11.0–25.0) |
| Creatinine, median (IQR), mg/dl, n = 2462 | 1.0 (.8–1.4) |
| Glucose, median (IQR), mg/dl, n = 2459 | 117.0 (102.0–149.0) |
| Aspartate transaminase, median (IQR), U/L, n = 2149 | 40.0 (28.0–61.0) |
| Alanine aminotransferase, median (IQR), U/L, n = 2164 | 31.0 (20.0–50.0) |
| Arterial pH, median, (IQR), n = 487 | 7.35 (7.40–7.45) |
| Abnormal chest X-ray during hospitalization, n = 1932 | 1769 (91.6) |
| Abnormal chest CT during hospitalization, n = 566 | 540 (95.4) |
| Ground glass opacities, n = 566 | 350 (61.8) |
| Investigational medication regimens for COVID-19,b n = 2482 | 1125 (45.3) |
| Hydroxychloroquinec | 1065 (94.7) |
| Azithromycin + ≥ 1 other COVID-19 treatment | 725 (64.4) |
| Tocilizumab | 103 (9.2) |
| Atazanavird | 94 (8.4) |
| Remdesivirc | 53 (4.7) |
| Lopinavir/ritonavird | 27 (2.4) |
| Convalescent plasma | 9 (.8) |
| Chloroquine | 7 (.6) |
| Sarilumabc | 6 (.5) |
| Zinc | 6 (.5) |
| Investigational drug, not specified, RCT | 1 (.1) |
| ICU admission, n = 2490 | 798 (32.0) |
| ICU length of stay, days, median (IQR), n = 771 | 6 (2–11) |
| Highest level of respiratory support required, n = 2489 | |
| Invasive mechanical ventilation | 462 (18.6) |
| BIPAP or CPAP | 82 (3.3) |
| High flow nasal cannula | 170 (6.8) |
| ECMO, n = 2487 | 9 (.4) |
| Vasopressor use, n = 2486 | 373 (15.0) |
| Systemic steroids, n = 2489 | 321 (12.9) |
| Renal replacement therapy, n = 2487 | 115 (4.6) |
| Discharge diagnosese | |
| Pneumonia, n = 2485 | 1395 (56.1) |
| Acute respiratory failure, n = 2487 | 999 (40.2) |
| Acute renal failure, n = 2485 | 456 (18.4) |
| Sepsis, n = 2479 | 443 (17.9) |
| Acute respiratory distress syndrome, n = 2485 | 255 (10.3) |
| Encephalitis, n = 2482 | 151 (6.1) |
| Congestive heart failure, n = 2485 | 51 (2.1) |
| Asthma exacerbation, n = 2486 | 43 (1.7) |
| COPD exacerbation, n = 2486 | 39 (1.6) |
| Acute myocardial infarction, n = 2485 | 38 (1.5) |
| In-hospital death, n = 2490 | 420 (16.9) |
Data are of adults hospitalized with COVID-19, through COVID-NET, at 13 sites (n = 2491).
Abbreviations: BIPAP, bilevel positive airway pressure; COPD, chronic obstructive pulmonary disease; COVID-19, coronavirus disease 2019; COVID-NET, COVID-19-Associated Hospitalization Surveillance Network; CPAP, continuous positive airway pressure; CT, computed tomography; ECMO, extracorporeal membrane oxygenation; ICU, intensive care unit; IQR, interquartile range; RCT, randomized controlled trial.
aSee Supplementary Table 2 for additional symptom data.
bNot mutually exclusive categories.
cIncludes RCTs where it cannot be determined whether the case received treatment vs placebo (remdesivir, 24; hydroxychloroquine, 15; and sarilumab, 5).
dPersons with human immunodeficiency virus/AIDS were excluded.
eDischarge diagnoses recorded from the hospital discharge summary and not based on International Classification of Disease, Tenth Edition, discharge codes.
During hospitalization, 45% (n = 1125/2482) of patients received investigational treatments for COVID-19 (Table 2). The most common treatments included hydroxychloroquine (n = 1065/1125, 95%) and the combination of azithromycin and ≥1 other COVID-19 treatment (n = 725/1125, 64%; non–mutually exclusive categories). The most frequent discharge diagnoses recorded in hospital discharge summaries were pneumonia (n = 1395/2485, 56%), acute respiratory failure (n = 999/2487, 40%), acute renal failure (n = 456/2485, 18%), and sepsis (n = 443/2479, 18%).
ICU admission was required for 32% (n = 798/2490) of patients, with a median length of ICU stay of 6 days (IQR, 2–11; Table 2). There was a median of 1 day from hospital admission to ICU admission (range, 0–19; IQR, 0–2). Among 2489 hospitalized patients, the highest respiratory support received was invasive mechanical ventilation in 19% (n = 462), bilevel positive airway pressure or continuous positive airway pressure in 3% (n = 82), and high-flow nasal cannula (HFNC) in 7% (n = 170). Of patients that received invasive mechanical ventilation, 53% (n = 246/462) died in hospital (median age, 71 years; IQR, 62–79). Vasopressors were used in 15% (n = 373/2486) of patients, while renal replacement therapy was used in 5% (n = 115/2487). As age increased, so did the proportion of patients who required ICU admission, invasive mechanical ventilation, and vasopressors (P < .05; Figure 2A). Males were admitted to the ICU and treated with invasive mechanical ventilation, HFNC, or vasopressors more frequently than females (P < .05; Figure 2B). Non-Hispanic Whites received bilevel positive airway pressure, continuous positive airway pressure, or HFNC more frequently than members of other races and ethnicities (P < .05; Figure 2C).
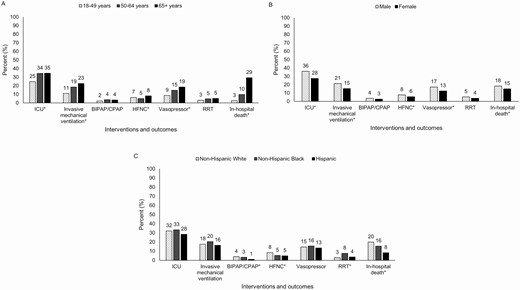
Interventions and outcomes of adults hospitalized with COVID-19, by (A) age (n = 2490), (B) sex (n = 2490), and (C) race and ethnicity (n = 2490). Data are from COVID-NET at 13 sites (n = 2491). For mechanical ventilation, BIPAP/CPAP, and HFNC, patients are assigned based on the highest level of respiratory support required during hospitalization (ie, invasive mechanical ventilation, followed by BIPAP or CPAP, followed by HFNC). *P value < .05. Abbreviations: BIPAP, bilevel positive airway pressure; COVID-19, coronavirus disease 2019; COVID-NET, COVID-19-Associated Hospitalization Surveillance Network; CPAP, continuous positive airway pressure; HFNC, high-flow nasal cannula; ICU, intensive care unit; RRT, renal replacement therapy.
During hospitalization, 17% (n = 420/2490) of patients died. The median age of patients who died was 76 years (IQR, 66–85); 58% (n = 244) were male; 71% (n = 299) were admitted to the ICU; and 59% (n = 246) received invasive mechanical ventilation (Table 2). The median length of hospitalization among patients who died was 7 days (IQR, 4–12). The proportion of patients who died increased with increasing age, ranging from 3% among those 18–49 years old to 10% among those 50–64 years old to 29% among those ≥ 65 years old (Figure 2A). Males died more frequently than females (P < .05; Figure 2B), and non-Hispanic Whites died more frequently than those of other races and ethnicities (P < .05; Figure 2C).
Risk Factors for ICU Admission and Death
Factors independently associated with ICU admission included an age of 50–64 years (adjusted risk ratio [aRR] = 1.53; 95% confidence interval (CI), 1.28–1.83), 65–74 years (aRR = 1.65; 95% CI, 1.34–2.03), 75–84 years (aRR = 1.84; 95% CI, 1.60–2.11), or ≥85 years (aRR = 1.43; 95% CI, 1.00–2.04); male sex (aRR = 1.34; 95% CI, 1.20–1.50); obesity (aRR = 1.31; 95% CI, 1.16–1.47); immunosuppression (aRR = 1.29; 95% CI, 1.13–1.47); and diabetes (aRR = 1.13; 95% CI, 1.03–1.24; Figure 3A; Supplementary Appendix Table 8A).
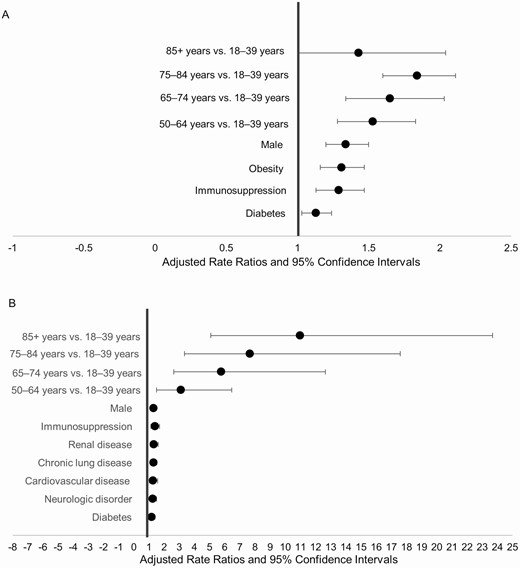
Risk factors for (A) ICU admission (n = 2490) and (B) in-hospital mortality (n = 2490). Data are from COVID-NET at 13 sites (n = 2491). The final model for ICU admission included age, sex, race and ethnicity, smoking status, hypertension, obesity, diabetes, chronic lung disease, cardiovascular disease, neurologic disease, renal disease, immunosuppression, and outpatient use of an angiotensin receptor blocker. The final model for in-hospital mortality was adjusted for age, sex, race and ethnicity, smoker, hypertension, obesity, diabetes, chronic lung disease, cardiovascular disease, neurologic disease, renal disease, immunosuppression, hematologic disorders, and rheumatologic or autoimmune disease. Abbreviations: COVID-19, coronavirus disease 2019; COVID-NET, COVID-19-Associated Hospitalization Surveillance Network; ICU, intensive care unit.
Independent factors associated with in-hospital mortality included an age of 50–64 years (aRR = 3.11; 95% CI 1.50–6.46), 65–74 years (aRR = 5.77; 95% CI, 2.64–12.64), 75–84 years (aRR = 7.67; 95% CI, 3.35–17.59), or ≥85 years (aRR = 10.98; 95% CI, 5.09 to 23.69); male sex (aRR = 1.30; 95% CI, 1.14–1.49); immunosuppression (aRR = 1.39; 95% CI, 1.13–1.70); renal disease (aRR = 1.33; 95% CI, 1.10–1.61); CLD (aRR = 1.31; 95% CI, 1.13–1.52); CVD (aRR = 1.28; 95% CI, 1.03–1.58); neurologic disorders (aRR = 1.25; 95% CI, 1.04–1.50); and diabetes (aRR = 1.19; 95% CI, 1.01–1.40; Figure 3B; Supplementary Appendix Table 8B).
Having ≥3 underlying medical conditions was significantly associated with higher risks of ICU admission and death after adjusting for age, sex, and race and ethnicity (Supplementary Appendix Table 9A and B).
DISCUSSION
Using a geographically diverse, multi-site, population-based US surveillance system, we found that among a sample of adults hospitalized with laboratory-confirmed COVID-19, almost one-third required ICU admission, 19% received invasive mechanical ventilation, and 17% died during hospitalization. About 75% of patients were ≥50 years, and >90% had underlying medical conditions. Older age, being male, and the presence of certain underlying medical conditions were associated with higher risks of ICU admission and in-hospital mortality.
In a published COVID-NET analysis, we found that when comparing the racial and ethnic distribution of residents of the surveillance catchment areas to the racial and ethnic distribution of COVID-19–associated hospitalizations, non-Hispanic Blacks were disproportionately hospitalized with COVID-19, compared to non-Hispanic Whites [10]. In this analysis, however, we found that once hospitalized, non-Hispanic Blacks did not have an increased risk of poorer outcomes, compared to other races and ethnicities, after adjusting for age and underlying conditions. Other recent US studies have also found no association between Black race and ICU admission or in-hospital mortality [4, 13, 14].
COVID-19–associated hospitalizations, ICU admissions, and deaths have been shown to occur more frequently with increasing age [6, 9, 15]. In our study, an age ≥65 years was the strongest independent predictor of ICU admission and in-hospital mortality. Persons aged 75–84 years had the highest risk of ICU admission when compared to those 18–49 years old, and those ≥85 years experienced 11 times the risk of death. These findings are similar to other studies from China, Europe, and the United States [4, 9, 15–18]. Our data provide support that older persons are particularly vulnerable to severe COVID-19 disease and should be targeted for aggressive preventive measures [8].
Being male was associated with a higher risk of ICU admission and death after adjusting for age, race and ethnicity, and underlying conditions. Other studies have similarly shown male sex to be associated with COVID-19–associated hospitalizations [4, 19], ICU admissions [20], and the need for mechanical ventilation [21].
Similar to other US studies, we found that nearly all hospitalized patients with COVID-19 had at least 1 underlying medical condition [4, 22]. In contrast, underlying medical conditions were documented in only 25–50% of hospitalized cases from China [3, 23]. Our analysis further demonstrated that a higher number of underlying medical conditions increased the risk of ICU admission (1.3 times the risk in persons with ≥3 vs 0 underlying conditions) and in-hospital mortality (1.8 times the risk in persons with ≥3 vs 0 underlying conditions).
In a retrospective case study among 1590 laboratory-confirmed hospitalized COVID-19 cases in 575 Chinese hospitals, Guan et al [3] found that after adjusting for age and smoking status, the risk factors for a composite endpoint of ICU admission, invasive mechanical ventilation, and death were chronic obstructive pulmonary disease, diabetes, hypertension, and malignancy. Similarly, we found an association between underlying medical conditions and severe outcomes, with diabetes, CLD, CVD, neurologic disease, renal disease, and immunosuppression associated with in-hospital death, and diabetes, obesity, and immunosuppression associated with ICU admission. While hypertension was highly prevalent in our patient population, it was not associated with ICU admission or death. This is similar to recently published US studies that did not find an association between hypertension and mortality [24, 25]. While several Chinese studies found hypertension to be associated with more severe clinical outcomes, they found the prevalence of hypertension to be much lower than reported in US studies, and management and control of hypertension might vary between China and the United States [3, 18, 26]. Additional studies are needed to determine whether hypertension, which is highly prevalent in the US population, increases the risk of COVID-19–associated hospitalizations, and whether the duration of hypertension and the degree to which it is controlled impact the risk for severe COVID-19 disease. Similarly, the associations between the duration and degree of glycemic control in diabetes and severity of COVID-19 disease require further investigation. Obesity, which was also highly prevalent in our study, imparted an increased risk for ICU admission, but not for death. This finding may, in part, be explained by a trend of decreasing obesity prevalence with increasing age, which was a strong risk factor for mortality. Health-care providers should be aware of these findings to appropriately triage and manage patients with high-risk conditions that may increase risks for either hospitalization or poorer outcomes once hospitalized [27, 28].
In our study, which was limited to patients that had either been discharged or died in hospital, 15% of patients received vasopressor support and 19% received invasive mechanical ventilation. Other US studies have found that up to 32% of hospitalized patients have received vasopressors and 17–33% have received invasive mechanical ventilation [20–22, 29], though some of these studies included patients who were still hospitalized at the time of analysis. In our study, 53% of patients requiring mechanical ventilation died, which is slightly lower than the 60% published in a recent study from New York City [4]; that same study also reported a similar age distribution and prevalence of underlying medical conditions among hospitalized cases as our data. These proportions of severe outcomes among US patients are also generally higher than those found in US adults hospitalized with seasonal influenza [30, 31]. Our findings may help to inform resource planning and allocation in health-care facilities during the COVID-19 pandemic.
There are limitations to our analysis. COVID-NET is an ongoing surveillance system; we included a convenience sample of COVID-19 hospitalized patients, representing those who were discharged or died in hospital during 1 March 1–2 May 2020 and for whom medical records were available and chart abstractions were completed. The hospitals that contributed cases to this analysis represented 43% of all the hospitals under surveillance; therefore, our findings may not be representative of the entire COVID-NET population or all adults hospitalized with COVID-19 in the United States. Nevertheless, COVID-NET encompasses a large geographic area with multiple hospitals, and likely offers a more racially and ethnically diverse patient population than single-center or state-based studies. Additionally, it is likely that not all COVID-19–associated hospitalizations were captured because of the lack of widespread testing capability during the study period and because the identification of COVID-19 patients was largely reliant on clinician-directed testing.
Based on findings from this multi-site, geographically diverse study, a high proportion of patients hospitalized with COVID-19 received aggressive interventions and had poor outcomes. Increasing age was the strongest predictor of in-hospital mortality. These findings alert health-care providers to the patient populations at highest risk for severe COVID-19–associated outcomes. The aggressive implementation of prevention strategies, including social distancing and rigorous hand hygiene, may benefit the population as a whole, as well as those at highest risk for COVID-19–related complications.
Supplementary Data
Supplementary materials are available at Clinical Infectious Diseases online. Consisting of data provided by the authors to benefit the reader, the posted materials are not copyedited and are the sole responsibility of the authors, so questions or comments should be addressed to the corresponding author.
Notes
Acknowledgments. The authors thank Ashley Coates, Pam Daily Kirley, and Gretchen Rothrock, California Emerging Infections Program; Nisha Alden, Rachel Herlihy, and Breanna Kawasaki, Colorado Department of Public Health & Environment; Paula Clogher, Hazal Kayalioglu, Amber Maslar, Adam Misiorski, Danyel Olson, and Christina Parisi, Connecticut Emerging Infections Program; Kyle Openo, Emily Fawcett, Jeremiah Williams, and Katelyn Lengacher, Georgia Emerging Infections Program; Andrew Weigel, Iowa Department of Health; Brian Bachaus, Timothy Blood, David Blythe, Alicia Brooks, Judie Hyun, Elisabeth Vaeth, and Cindy Zerrlaut, Maryland Department of Health; Jim Collins, Kimberly Fox, Sam Hawkins, Justin Henderson, Shannon Johnson, and Libby Reeg, Michigan Department of Health and Human Services; Austin Bell, Kayla Bilski, Erica Bye, Emma Contestabile, Richard Danila, Kristen Ehresmann, Hannah Friedlander, Claire Henrichsen, Emily Holodnick, Ruth Lynfield, Katherine Schliess, Samantha Siebman, Kirk Smith, and Maureen Sullivan, Minnesota Department of Health; Cory Cline, New Mexico Department of Health; Kathy Angeles, Lisa Butler, Emily Hancock, Sarah Khanlian, Meaghan Novi, and Sarah Shrum, New Mexico Emerging Infections Program, Albuquerque; Nancy Spina, Grant Barney, and Suzanne McGuire, New York State Health Department; Sophrena Bushey, Christina Felsen, Maria Gaitan, Anita Gellert, RaeAnne Kurtz, Christine Long, Shantel Peters, and Marissa Tracy, University of Rochester School of Medicine and Dentistry; Laurie Billing, Maya Scullin, and Jessica Shiltz, Ohio Department of Health; Nicole West, Oregon Health Authority; Kathy Billings, Katie Dyer, Anise Elie, Karen Leib, Tiffanie Markus, Terri McMinn, Danielle Ndi, and Manideepthi Pemmaraju, Vanderbilt University Medical Center; Keegan McCaffrey, Utah Department of Health; Clarissa Aquino, Ryan Chatelain, Andrea George, Jacob Ortega, Andrea Price, Ilene Risk, Melanie Spencer, and Ashley Swain, Salt Lake County Health Department; Mimi Huynh and Monica Schroeder, Council of State and Territorial Epidemiologists; Shua J. Chai, Field Services Branch, Division of State and Local Readiness, Center for Preparedness and Response, Centers for Disease Control and Prevention; Sharad Aggarwal, Lanson Broecker, Aaron Curns, Rebecca M. Dahl, Alexandra Ganim, Rainy Henry, Sang Kang, Sonja Nti-Berko, Robert Pinner, Mila Prill, Scott Santibanez, Alvin Shultz, Sheng-Te Tsai, Henry Walke, and Venkata Akesh R. Vundi, Centers for Disease Control and Prevention.
Disclaimer. The conclusions, findings, and opinions expressed by the authors do not necessarily reflect the official position of the United States Department of Health and Human Services, the United States Public Health Service, the Centers for Disease Control and Prevention, or the authors’ affiliated institutions.
Financial support. This work was supported by the Centers of Disease Control and Prevention through an Emerging Infections Program cooperative agreement (grant CK17–1701) and through a Council of State and Territorial Epidemiologists cooperative agreement (grant NU38OT000297–02–00).
Potential conflicts of interest. E. J. A. reports personal fees from Abbvie; grants and personal fees from Pfizer; and grants from Medimmune, Regeneron, PaxVax, Merck, Novavax, Sanofi-Pasteur, and Micron. L. B., M. H., and S. K. report grants from the Council of State and Territorial Epidemiologists. L. B. is a recipient of Epidemiology and Laboratory Capacity and Immunizations and Vaccines for Children grant funding from the Centers for Disease Control and Prevention to support vaccine preventable disease epidemiology staffing, outside the submitted work. H. K. T. reports personal fees from Seqirus and grants from Sanofi. W. S. reports personal fees from Pfizer and Roche Diagnostics. All other authors report no potential conflicts. All authors have submitted the ICMJE Form for Disclosure of Potential Conflicts of Interest. Conflicts that the editors consider relevant to the content of the manuscript have been disclosed.
References
Coronavirus Disease 2019 (
Author notes
L. K. and S. G. contributed equally to this work.

