


Abstract
Human immunodeficiency virus (HIV)–related opportunistic infections (OIs) cause substantial morbidity and mortality among people with HIV (PWH). US hospitalization and in-hospital mortality rates associated with OIs have not been published using data from the past decade.
We analyzed the National Inpatient Sample for the years 2011 through 2018. We used sociodemographic, financial, and hospital-level variables and identified hospitalizations for PWH and OI diagnoses. Using survey-weighted methods, we estimated all OI-related US hospitalization rates and in-hospital mortality per 100 000 PWH and modeled associated factors using survey-based multivariable logistic regression techniques.
From 2011 to 2018, there were an estimated 1 710 164 (95% confidence interval [CI], 1 659 566–1 760 762) hospital discharges for PWH with 154 430 (95% CI, 148 669–159 717 [9.2%]) associated with an OI, of which 9336 (95% CI, 8813–9857; 6.0%) resulted in in-hospital mortality. Variables associated with higher odds of OI-related hospitalizations (compared to without an OI) included younger age, male sex, non-White race/ethnicity, and being uninsured (all likelihood ratio [LR] P < .001). Higher OI-related mortality was associated with older age (LR P < .001), male sex (LR P = .001), Hispanic race/ethnicity (LR P < .001), and being uninsured (LR P = .009). The OI-related hospitalization rate fell from 2725.3 (95% CI, 2266.9–3183.7) per 100 000 PWH in 2011 to 1647.3 (95% CI, 1492.5–1802.1) in 2018 (P < .001), but the proportion of hospitalizations with mortality was stable (5.9% in 2011 and 2018).
Our findings indicate an ongoing need for continued funding of HIV testing, health insurance for all PWH, OI screening initiatives, review of current prophylaxis guidelines, and recruitment of more HIV clinicians.
Human immunodeficiency virus (HIV)–related opportunistic infections (OIs) cause substantial morbidity and mortality among people with HIV (PWH) [1, 2] and are frequently the initial presenting sign for a person who does not know they have HIV [3]. OIs are infections that are more frequent or more severe because of HIV-mediated immunosuppression [4, 5]. Prior to the advent of antiretroviral therapy (ART), people presented with OIs associated with HIV about 7–10 years after initial HIV infection, and once diagnosed with an OI, median survival was 9 months [5]. OIs now have many prophylactic and treatment options, for which the Centers for Disease Control and Prevention (CDC), in collaboration with the National Institutes of Health and the Infectious Diseases Society of America, have developed comprehensive management guidelines [5]. Though treatments for HIV and OIs have advanced considerably, there continue to be inequities in access to care [6]. For example, the CDC estimated in 2019 that of the approximately 1.2 million PWH in the United States (US) [7], 76.0% of PWH received medical care, 57.8% were retained in care [8], 34.5% had a detectable viral load, and 44.6% had ever been diagnosed with AIDS [7]. PWH with detectable viral loads have an increased risk for HIV-related OIs. To measure the success of timely and effective HIV treatment across the spectrum of care engagement, one key indicator could be quantifying the national rate of hospitalizations with OIs, especially among priority subgroups impacted negatively by social determinants [9].
Using the National Inpatient Sample (NIS), the Healthcare Cost and Utilization Project (HCUP) sponsored by the Agency for Healthcare Research and Quality (AHRQ) has reported estimates of the number of hospital stays with diagnosis codes for HIV and selected individual OIs for the years 2006, 2010, and 2013. Over that time period, the number of hospitalizations for certain OIs was declining, but aggregated sums of any OI and population rates among PWH were not reported [10]. Studies using cohort data have demonstrated that the incidence rates of OIs and associated mortality have been decreasing in the US and Canada for PWH engaged in care in the 1990s and 2000s, but do not include PWH who are not engaged in care [11–15]. The most recent study to report OIs in the US used data from over a decade ago [10]. Estimated rates for the US have not been published in the past decade. To meet the National HIV/AIDS Strategy's 2022–2025 goal to “Improve HIV-Related Health Outcomes of People with HIV” [9], national treatment and prophylaxis guidelines for OIs must be informed by objective and recent quantifications of OI hospitalization rates and characteristics of PWH experiencing those hospitalizations.
Our goal was to quantify US hospitalization rates for OIs and OI-related in-hospital mortality and to determine whether these rates are declining from 2011 to 2018. We describe sociodemographic, financial, and system-level characteristics of PWH who experienced OI-related hospitalizations. We also identify characteristics associated with (1) OI-related hospitalizations and (2) in-hospital mortality during an OI-related hospitalization.
METHODS
Sample and Population Data
We used hospitalization discharge data from the NIS for 2011 to 2018. The institutional review board at the University of Virginia deemed this study as not human subjects research because we used a de-identified, publicly available database. We executed data use agreements with AHRQ's HCUP.
Outcomes
The primary outcome of interest was hospitalization for a person aged >18 years with the diagnoses of HIV and an OI. The second outcome of interest was in-hospital mortality (discharge as deceased) among the OI-related hospitalizations. We identified individual hospitalizations for PWH and OIs using any code among the first 25 diagnosis codes (minimum number of codes across all years) under the International Classification of Diseases, Ninth Revision, Clinical Modification (ICD-9-CM) and the Tenth Revision (ICD-10-CM) starting with September 2015 (see Supplementary Tables 1 and 2 for chosen HIV and OI codes [4]). Some OIs could not be included in the analysis due to nonspecific ICD coding (Supplementary Table 3). OIs with a rate >50 per 100 000 PWH-years in 2018 were included in the primary report, and those with lower rates are reported in Supplementary Table 4. Other supplemental materials include the highest percentages of weighted hospitalizations with an OI that resulted in mortality (Supplementary Figure 1).
Statistical Analysis
We calculated the weighted distribution of sociodemographic variables, hospital characteristics, and hospitalization characteristics for each subgroup of hospitalization reported (PWH without OI, PWH with OI, PWH with OI and with survival, PWH with OI and with in-hospital mortality). We created a multivariable logistic regression model to determine the association between sociodemographic and hospital characteristics with hospitalization with an OI compared with hospitalizations without an OI. Among hospitalizations with an OI, we created a multivariable logistic regression model to measure the association between sociodemographic and hospital characteristics with in-hospital mortality. We calculated annual hospitalization rates with 95% confidence intervals (CIs) by using the weighted number of hospitalizations for each diagnosis category per 100 000 PWH prevalence for a given year. Discharge weight standard errors, 95% CIs [16], and logistic regression models were calculated as a subset of all NIS observations within the entire analysis period using a clustered, stratified survey design. All analyses were performed in R version 4.2.1 software (R Foundation for Statistical Computing). Additional methodological information is available in the Supplementary Materials, including expanded definitions of variables such as primary payer groups and total charges.
RESULTS
There were an estimated 242 943 815 (95% CI, 240 375 121–245 512 509) hospital discharges in the US during the years 2011 to 2018. There were 1 758 579 (95% CI, 1 707 580–1 809 578; 0.7%) estimated discharges associated with HIV of which 48 415 (95% CI, 41 239–55 590; 2.7% of PWH hospitalizations) were excluded due to missing data, leaving 1 710 164 (95% CI, 1 659 566–1 760 762; 97.2% of PWH) estimated hospitalizations for analysis. Of that number, 154 430 (95% CI, 148 669–159 717; 9.2%) were associated with an HIV-related OI in a univariate comparison to hospitalized PWH without an OI (Table 1).
Characteristics of Hospitalizations Among People With Human Immunodeficiency Virus With or Without an Opportunistic Infection
| Variable | Hospitalizations for PWH, No. (Column %) | PWH With OI, Row % | OI Present, No. (Column %) | OI Absent, No. (Column %) | P Valuea |
|---|---|---|---|---|---|
| Total | 1 710 165 | 9.0 | 154 430 | 1 555 735 | |
| Sociodemographic characteristics | |||||
| Age group, y | <.001 | ||||
| 18–24 | 46 352 (2.7) | 13.7 | 6329 (4.1) | 40 022 (2.6) | |
| 25–34 | 228 114 (13.3) | 15.3 | 34 983 (22.7) | 193 131 (12.4) | |
| 35–44 | 309 897 (18.2) | 12.5 | 38 717 (25.1) | 271 180 (17.4) | |
| 45–54 | 580 549 (33.9) | 8.5 | 49 064 (31.8) | 531 486 (34.2) | |
| ≥55 | 545 252 (31.9) | 4.6 | 25 336 (16.3) | 519 916 (33.4) | |
| Sex | <.001 | ||||
| Male | 1 125 813 (65.8) | 9.4 | 106 267 (68.8) | 1 019 546 (65.5) | |
| Female | 584 352 (34.2) | 8.2 | 48 163 (31.2) | 536 189 (34.5) | |
| Race/Ethnicity | <.001 | ||||
| White | 506 353 (29.6) | 7.6 | 38 297 (24.8) | 468 056 (30.0) | |
| Black | 897 830 (52.5) | 9.2 | 82 768 (53.6) | 815 062 (52.4) | |
| Hispanic | 214 714 (12.6) | 11.3 | 24 354 (15.8) | 190 360 (12.2) | |
| AAPI | 13 236 (0.8) | 16.3 | 2167 (1.4) | 11 068 (0.8) | |
| Other | 78 032 (4.5) | 8.8 | 6844 (4.4) | 71 189 (4.6) | |
| Payer | <.001 | ||||
| Medicaid | 657 083 (38.4) | 10.4 | 68 438 (44.3) | 588 645 (37.8) | |
| Medicare | 585 679 (34.2) | 5.6 | 32 621 (21.1) | 553 058 (35.5) | |
| Private insurance | 280 816 (16.4) | 10.0 | 28 120 (18.2) | 252 696 (16.2) | |
| Self-pay | 121 032 (7.1) | 14.9 | 18 094 (11.7) | 102 938 (6.6) | |
| Other | 62 595 (3.7) | 11.0 | 6879 (4.6) | 55 716 (3.6) | |
| Unknown | 2960 (0.2) | 9.4 | 278 (0.1) | 2682 (0.2) | |
| Hospital characteristics | |||||
| Region | <.001 | ||||
| Northeast | 498 318 (29.1) | 6.5 | 32 293 (20.9) | 466 025 (29.9) | |
| Midwest | 207 148 (12.1) | 8.0 | 16 641 (10.8) | 190 507 (12.2) | |
| South | 809 728 (47.3) | 9.9 | 79 856 (51.7) | 729 872 (46.9) | |
| West | 194 971 (11.4) | 13.2 | 25 639 (16.6) | 169 332 (10.9) | |
| Urban-Ruralb | <.001 | ||||
| Urbanc | 1 658 326 (97.0) | 9.1 | 150 588 (97.5) | 1 507 737 (96.9) | |
| Rurald | 51 839 (3.0) | 7.4 | 3841 (2.5) | 47 998 (3.1) | |
| Hospitalization characteristics | |||||
| Total charges, median (IQR) | $30 034 ($16 135–$58 688) | … | $50 629 ($26 048–$107 148) | $28 670 ($15 561–$55 098) | <.001 |
| Unknown | 18 627 (1.1) | 10.1 | 1889 (1.2) | 16 738 (1.1) | |
| LOS (days), median (IQR) | 4 (2–7) | … | 7 (4–13) | 4 (2–6) | <.001 |
| Unknown | 182 (0.01) | 13.7 | 25 (0.02) | 157 (0.01) | |
| Year | <.001 | ||||
| 2011 | 225 155 (13.2) | 10.3 | 23 165 (15.0) | 201 990 (13.0) | |
| 2012 | 216 135 (12.6) | 9.7 | 20 870 (13.5) | 195 265 (12.6) | |
| 2013 | 212 860 (12.4) | 9.6 | 20 505 (13.2) | 192 355 (12.4) | |
| 2014 | 212 130 (12.4) | 9.3 | 19 805 (12.8) | 192 325 (12.4) | |
| 2015 | 214 620 (12.5) | 8.6 | 18 480 (12.0) | 196 140 (12.6) | |
| 2016 | 205 155 (12.0) | 8.6 | 17 720 (11.5) | 187 435 (12.0) | |
| 2017 | 211 445 (12.4) | 8.1 | 17 075 (11.0) | 194 370 (12.5) | |
| 2018 | 212 665 (12.4) | 7.9 | 16 810 (10.9) | 195 855 (12.6) | |
Abbreviations: AAPI, Asian and Pacific Islander; IQR, interquartile range; LOS, length of stay; OI, opportunistic infection; PWH, people with human immunodeficiency virus.
Data are presented as No. (%) unless otherwise indicated.
aχ2 test with Rao & Scott second-order correction; Wilcoxon rank-sum test for complex survey samples.
bUsing classification by core-based statistical area.
cMetropolitan core-based statistical area (>50 000 population in largest urban area).
dNonmetropolitan core-based statistical area (<50 000 population in largest urban area).
The sociodemographic subgroups accounting for the largest number of hospitalizations with an OI were the 45–54 age group (49 064 [32%]; P < .001), males (106 267 [69%]; P < .001), the Black race/ethnicity group (82 768 [54%]; P < .001), and the Medicaid insurance payer group (68 438 [44%]; P < .001). The hospital-level subgroups accounting for the majority of hospitalizations with an OI were the South (79 856 [52%]; P < .001) and urban areas (150 588 [98%]; P < .001). The median total charge of hospitalizations for PWH hospitalized with an OI was $50 629 (interquartile range [IQR], $26 048–$107 148) compared with $28 670 (IQR, $15 561–$55 098) for PWH hospitalized without an OI (P < .001). The median length of stay for PWH hospitalized with an OI was 7 days (IQR, 4–13) compared with 4 days (IQR, 2–6) for PWH hospitalized without an OI (P < .001). The year with the most hospitalizations was 2011 (23 165 [15%]), which reduced to 16 810 (11%) in 2018 (P < .001).
Of the 154 430 (95% CI, 148 904–159 954) estimated OI-related hospitalizations for PWH, 9336 (95% CI, 8813–9857 [6.0%]) resulted in in-hospital mortality by univariate comparison to OI-related hospitalizations among PWH that did not result in mortality (Table 2). The sociodemographic subgroups with the highest number of hospitalizations resulting in mortality were the 45–54 age group (2967 [32%]; P < .001), males (6824 [73%]; P < .001), the Black race/ethnicity group (4515 [48%]; P < .001), and the Medicaid insurance payer group (3967 [43%]; P = .078). Just over half of the weighted OI hospitalizations that resulted in in-hospital mortality were in the South (4951 [53%]; P = .005). Nearly all were in urban areas (9094 [97%]; P = .8). The median total charge of hospitalizations for PWH with OIs that resulted in in-hospital mortality was $155 054 (IQR, $68 381–$298 536) compared with $48 028 (IQR, $25 243–$98 205) (P < .001) for hospitalizations with the PWH alive at discharge. The median length of stay was 13 (IQR, 6–24) for in-hospital mortality compared with 7 (IQR, 4–13) for who were alive at discharge (P < .001). Of the PWH hospitalized with an OI, the percentage each year that resulted in mortality was stable at 5.9% from 2011 to 2018.
Characteristics of Hospitalizations With Opportunistic Infection, With or Without In-Hospital Mortality
| Variable | OI-Related Hospitalizations, No. (Column %) | In-Hospital Mortality (Row %) | In-Hospital Mortality, No. (Column %) | Alive at Discharge, No. (Column %) | P Valuea |
|---|---|---|---|---|---|
| Total | 154 429 | 6.0 | 9336 | 145 094 | |
| Sociodemographic characteristics | |||||
| Age group, y | <.001 | ||||
| 18–24 | 6329 (4.1) | 3.6 | 231 (2.5) | 6098 (4.2) | |
| 25–34 | 34 983 (22.7) | 5.0 | 1735 (18.6) | 33 248 (22.9) | |
| 35–44 | 38 717 (25.1) | 5.4 | 2096 (22.5) | 36 621 (25.2) | |
| 45–54 | 49 064 (31.8) | 6.0 | 2967 (31.7) | 46 097 (31.8) | |
| ≥55 | 25 336 (16.4) | 9.1 | 2307 (24.7) | 23 029 (15.8) | |
| Sex | <.001 | ||||
| Male | 106 267 (68.8) | 6.4 | 6824 (73.1) | 99 443 (68.5) | |
| Female | 48 163 (31.2) | 5.2 | 2512 (26.9) | 45 651 (31.5) | |
| Race/Ethnicity | <.001 | ||||
| White | 38 297 (24.8) | 6.4 | 2443 (26.2) | 35 854 (24.7) | |
| Black | 82 768 (53.6) | 5.4 | 4515 (48.4) | 78 253 (53.9) | |
| Hispanic | 24 354 (15.8) | 7.4 | 1799 (19.3) | 22 554 (15.5) | |
| AAPI | 2167 (1.4) | 4.6 | 99 (1.1) | 2068 (1.4) | |
| Other | 6844 (4.4) | 7.0 | 480 (5.1) | 6364 (4.4) | |
| Payer | .08 | ||||
| Medicaid | 68 438 (44.3) | 5.8 | 3967 (42.5) | 64 471 (44.4) | |
| Medicare | 32 621 (21.1) | 6.0 | 1944 (20.8) | 30 677 (21.1) | |
| Private insurance | 28 120 (18.2) | 6.1 | 1725 (18.5) | 26 395 (18.2) | |
| Self-pay | 18 094 (11.7) | 7.1 | 1280 (13.7) | 16 814 (11.6) | |
| Other | 6879 (4.5) | 5.9 | 405 (4.3) | 6474 (4.5) | |
| Unknown | 278 (0.2) | 5.4 | 15 (0.2) | 263 (0.2) | |
| Hospital characteristics | |||||
| Region | .005 | ||||
| Northeast | 32 293 (20.9) | 6.3 | 2023 (21.7) | 30 271 (20.8) | |
| Midwest | 16 641 (10.8) | 4.6 | 761 (8.2) | 15 880 (10.9) | |
| South | 79 856 (51.7) | 6.2 | 4951 (53.0) | 74 905 (51.6) | |
| West | 25 639 (16.6) | 6.2 | 1601 (17.1) | 24 038 (16.6) | |
| Urban-Ruralb | .8 | ||||
| Urbanc | 150 588 (97.5) | 6.0 | 9094 (97.4) | 141 495 (97.5) | |
| Rurald | 3841 (2.5) | 6.3 | 242 (2.6) | 3599 (2.5) | |
| Hospitalization characteristics | |||||
| Total charges, median (IQR) | $50 629 ($26 048–$107 148) | … | $155 054 ($68 381–$298 536) | $48 028 ($25 243–$98 205) | <.001 |
| Unknown | 1889 (1.2) | 5.3 | 100 (1.1) | 1789 (1.2) | |
| LOS (days), median (IQR) | 7 (4–13) | … | 13 (6–24) | 7 (4–13) | <.001 |
| Unknown | 25 (0.02) | 20 | 5 (0.05) | 20 (0.01) | |
| Year | >.9 | ||||
| 2011 | 23 165 (15.0) | 5.9 | 1371 (14.7) | 21 794 (15.0) | |
| 2012 | 20 870 (13.5) | 6.1 | 1280 (13.7) | 19 590 (13.5) | |
| 2013 | 20 505 (13.3) | 6.1 | 1245 (13.3) | 19 260 (13.3) | |
| 2014 | 19 805 (12.8) | 6.0 | 1180 (12.6) | 18 625 (12.8) | |
| 2015 | 18 480 (12.0) | 6.3 | 1160 (12.4) | 17 320 (11.9) | |
| 2016 | 17 720 (11.5) | 6.0 | 1065 (11.4) | 16 655 (11.5) | |
| 2017 | 17 075 (11.1) | 6.2 | 1050 (11.2) | 16 025 (11.0) | |
| 2018 | 16 810 (10.8) | 5.9 | 985 (10.6) | 15 825 (10.9) | |
Abbreviations: AAPI, Asian and Pacific Islander; IQR, interquartile range; LOS, length of stay; OI, opportunistic infection.
Data are presented as No. (%) unless otherwise indicated.
aχ2 test with Rao & Scott second-order correction; Wilcoxon rank-sum test for complex survey samples.
bUsing classification by core-based statistical area.
cMetropolitan core-based statistical area (>50 000 population in largest urban area).
dNonmetropolitan Core-based statistical area (<50 000 population in largest urban area).
Of the 1 710 164 included hospitalizations for PWH, there were 1 707 204 (99.8%) estimated hospitalizations with no missing data for the remaining covariates included in the multivariable logistic regression models. The following variables were associated with being hospitalized with an HIV-related OI (Table 3): age, sex, race/ethnicity, payer, region, rural areas, and year (all P < .001). For age, the groups younger than the 45–54 reference group had higher odds for being hospitalized with an OI (18–24 years: aOR, 1.50 [95% CI, 1.39–1.62]; 25–34 years: aOR, 1.72 [95% CI, 1.65–1.78]; and 35–44 years: aOR, 1.46 [95% CI, 1.41–1.52]) whereas the age group ≥55 years had lower odds (aOR, 0.60 [95% CI, .58–.63]). Females had lower odds of being hospitalized with an OI (aOR, 0.82 [95% CI, .79–.85]) than males. The White race/ethnicity reference group had the lowest odds and the Asian American and Pacific Islander (AAPI) group had the highest (aOR, 1.93 [95% CI, 1.71–2.17]). Other groups with the highest odds of being hospitalized with an OI included the self-pay payer group (aOR, 1.19 [95% CI, 1.14–1.26]) and the West region (aOR, 2.18 [95% CI, 2.06–2.31]). Rural areas had lower odds (aOR, 0.84 [95% CI, .76–.92]) compared with urban areas.
Multivariable Analysis of Characteristics Associated With Being Hospitalized With an Opportunistic Infection
 |
|
Abbreviations: AAPI, Asian American and Pacific Islander; aOR, adjusted odds ratio; CI, confidence interval; LR, likelihood ratio; OI, opportunistic infection.
Multivariable Analysis of Characteristics Associated With Being Hospitalized With an Opportunistic Infection
|
|
Abbreviations: AAPI, Asian American and Pacific Islander; aOR, adjusted odds ratio; CI, confidence interval; LR, likelihood ratio; OI, opportunistic infection.
Of the 1 707 204 hospitalizations for PWH with no missing data in any covariate, there were 153 915 (9.0%) estimated hospitalizations with no missing data in the remaining covariates included in the second multivariable logistic regression model. The following variables were associated with in-hospital mortality (Table 4): age (P < .001), sex (P = .001), race/ethnicity (P < .001), payer (P = .009), and region (P = .003). For age, the groups younger than 45–54 years had lower odds for in-hospital mortality (18–24 years: aOR, 0.60 [95% CI, .44–.80]; 25–34 years: aOR, 0.78 [95% CI, .68–.90]; 35–44 years: aOR, 0.89 [95% CI, .78–1.01]), whereas the ≥55 group had the highest odds (aOR, 1.61 [95% CI, 1.42–1.84]). Females had lower odds of in-hospital mortality (aOR, 0.84 [95% CI, .76–.94]) than males, and for race/ethnicity, the Hispanic group (aOR, 1.22 [95% CI, 1.06–1.41]) than the White reference group. The Midwest region had the lowest odds of in-hospital mortality (aOR, 0.77 [95% CI, .63–.94]). The urban-rural classification (P = .91) and year (P = .97) variables did not contribute significantly to the model.
Multivariable Analysis of Characteristics Associated With In-Hospital Mortality Among Those Hospitalized With an Opportunistic Infection
 |
|
Abbreviations: AAPI, Asian American and Pacific Islander; aOR, adjusted odds ratio; CI, confidence interval; LR, likelihood ratio.
Multivariable Analysis of Characteristics Associated With In-Hospital Mortality Among Those Hospitalized With an Opportunistic Infection
|
|
Abbreviations: AAPI, Asian American and Pacific Islander; aOR, adjusted odds ratio; CI, confidence interval; LR, likelihood ratio.
The estimated annual rates of US hospitalizations with any HIV-related OI decreased from 2725.3 (95% CI, 2266.9–3183.7) per 100 000 PWH in 2011 to 1647.3 (95% CI, 1492.5–1802.1) in 2018 (Table 5) with significant decline over time (P < .001). All individual OI-related US hospitalization rates were significantly declining over time as well. Pneumocystis jirovecii pneumonia (PJP) decreased from 1044.3 (95% CI, 866.8–1221.8) in 2011 to 591.4 (95% CI, 536.1–646.7) in 2018 (P < .001), esophageal candidiasis from 694.3 (95% CI, 557.0–831.7) to 505.2 (95% CI, 445.8–564.6) (P < .001), cytomegalovirus (CMV) disease from 428.1 (95% CI, 318.4–537.8) to 250.4 (95% CI, 213.2–287.5) (P < .001), disseminated nontuberculous mycobacteria (NTM) from 392.8 (95% CI, 305.1–480.4) to 152.9 (95% CI, 127.6–178.2) (P < .001), cryptococcosis from 246.3 (95% CI, 186.6–306.0) to 182.3 (95% CI, 155.1–209.5) (P < .001), any form of active tuberculosis from 155.2 (95% CI, 111.0–199.3) to 99.0 (95% CI, 80.0–117.9) (P < .001), and histoplasmosis from 77.3 (95% CI, 47.3–107.4) to 61.2 (95% CI, 46.1–76.3) (P = .04) (Figure 1).
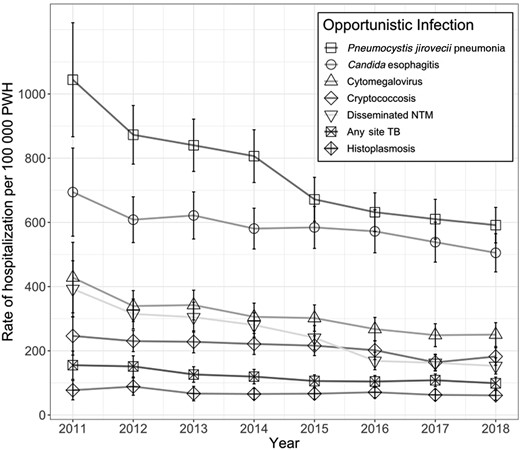
Annual rates of hospitalization with HIV-related opportunistic infections, United States, 2011–2018. Abbreviations: HIV, human immunodeficiency virus; NTM, nontuberculous mycobacteria; PWH, people with human immunodeficiency virus; TB, tuberculosis.
Rates of Human Immunodeficiency Virus (HIV)–Related Opportunistic Infections and Associated Mortality per 100 000 People With HIV, 2011–2018, United States
| OI Diagnosis | Variablea | 2011 | 2012 | 2013 | 2014 | 2015 | 2016 | 2017 | 2018 | P Value |
|---|---|---|---|---|---|---|---|---|---|---|
| Any OI | Hospitalization rate | 2725.3 (2266.9–3183.7) | 2384.5 (2141.8–2627.1) | 2280.3 (2054.2–2506.3) | 2143.5 (1940.8–2346.3) | 1947.3 (1758.0–2136.7) | 1820.1 (1648.2–1991.9) | 1711.9 (1547.6–1876.1) | 1647.3 (1492.5–1802.1) | <.001 |
| Estimated No. of hospitalizations | 23 164.6 (19 268.3–27 060.8) | 20 870.0 (18 746.5–22 993.6) | 20 505.0 (18 472.2–22 537.8) | 19 805.0 (17 931.9–21 678.1) | 18 480.0 (16 682.9–20 277.1) | 17 720.0 (16 046.9–19 393.1) | 17 075.0 (15 436.5–18 713.5) | 16 810.0 (15 230.2–18 389.9) | ||
| Mortality rate | 161.3 (126.5–196.0) | 146.2 (125.2–167.3) | 138.5 (116.4–160.5) | 127.7 (108.1–147.3) | 122.2 (103.5–140.9) | 109.4 (92.7–126.1) | 105.3 (88.1–122.5) | 96.5 (81.5–111.6) | <.001 | |
| Estimated No. of deaths | 1370.7 (1075.6–1665.9) | 1280.0 (1095.7–1464.3) | 1245.0 (1046.5–1443.5) | 1180.0 (999.1–1360.9) | 1160.0 (982.5–1337.5) | 1065.0 (902.3–1227.7) | 1050.0 (878.5–1221.4) | 985.0 (831.4–1138.6) | ||
| Pneumocystis jirovecii pneumonia | Hospitalization rate | 1044.3 (866.8–1221.8) | 872.9 (781.5–964.3) | 840.2 (758.7–921.6) | 806.3 (724.2–888.5) | 671.8 (603.3–740.3) | 631.7 (571.4–692.0) | 610.1 (548.3–671.8) | 591.4 (536.1–646.7) | <.001 |
| Estimated No. of hospitalizations | 8876.7 (7367.9–10 385.6) | 7640.0 (6840.2–8439.8) | 7555.0 (6822.8–8287.2) | 7450.0 (6690.9–8209.1) | 6375.0 (5724.8–7025.2) | 6150.0 (5563.2–6736.8) | 6085.0 (5469.1–6700.9) | 6035.0 (5471.0–6599.0) | ||
| Mortality rate | 77.9 (57.6–98.3) | 76.0 (61.3–90.7) | 80.6 (65.7–95.6) | 66.6 (53.3–79.8) | 56.9 (44.9–68.9) | 55.0 (43.9–66.1) | 51.6 (40.6–62.6) | 43.6 (34.4–52.8) | <.001 | |
| Estimated No. of deaths | 662.5 (489.3–835.8) | 665.0 (536.4–793.6) | 725.0 (590.6–859.4) | 615.0 (492.4–737.6) | 540.0 (426.3–653.7) | 535.0 (426.9–643.1) | 515.0 (405.3–624.7) | 445.0 (351.1–538.9) | ||
| Candidiasis of esophagusb | Hospitalization rate | 694.3 (557.0–831.7) | 608.4 (537.0–679.8) | 621.6 (548.3–695.0) | 580.7 (517.1–644.3) | 584.3 (519.0–649.6) | 572.1 (505.1–639.1) | 538.4 (476.2–600.6) | 505.2 (445.8–564.6) | <.001 |
| Estimated No. of hospitalizations | 5901.6 (4734.1–7069.1) | 5325.0 (4700.0–5950.0) | 5590.0 (4930.3–6249.6) | 5365.0 (4777.4–5952.6) | 5545.0 (4925.1–6164.9) | 5570.0 (4917.7–6222.3) | 5370.0 (4749.8–5990.2) | 5155.0 (4548.9–5761.1) | ||
| Mortality rate | 17.3 (9.7–24.8) | 25.1 (17.6–32.7) | 20.0 (13.3–26.7) | 20.6 (13.9–27.3) | 21.6 (15.0–28.2) | 15.9 (10.0–21.9) | 23.6 (16.6–30.5) | 19.1 (12.8–25.4) | .06 | |
| Estimated No. of deaths | 146.8 (82.5–211.1) | 220.0 (153.8–286.2) | 180.0 (119.7–240.3) | 190.0 (128.2–251.8) | 205.0 (142.5–267.5) | 155.0 (97.2–212.8) | 235.0 (165.4–304.6) | 195.0 (131.1–258.9) | ||
| CMV disease | Hospitalization rate | 428.1 (318.4–537.8) | 339.3 (291.3–387.4) | 342.5 (296.1–388.9) | 305.8 (263.1–348.4) | 301.9 (260.9–342.9) | 267.6 (231.3–303.8) | 248.6 (213.1–284.2) | 250.4 (213.2–287.5) | <.001 |
| Estimated No. of hospitalizations | 3638.8 (2706.5–4571.1) | 2970.0 (2549.2–3390.8) | 3080.0 (2663.0–3497.0) | 2825.0 (2430.7–3219.3) | 2865.0 (2475.9–3254.1) | 2605.0 (2252.0–2958.0) | 2480.0 (2125.1–2834.9) | 2555.0 (2175.8–2934.2) | ||
| Mortality rate | 30.0 (20.1–39.9) | 32.0 (23.3–40.6) | 28.9 (20.2–37.6) | 22.2 (15.3–29.1) | 29.0 (20.8–37.1) | 21.1 (14.3–27.8) | 25.6 (18.1–33.1) | 23.0 (15.7–30.4) | .08 | |
| Estimated No. of deaths | 254.8 (170.8–338.8) | 280.0 (204.4–355.6) | 260.0 (181.8–338.2) | 205.0 (141.0–269.0) | 275.0 (197.5–352.5) | 205.0 (139.4–270.6) | 255.0 (180.1–329.9) | 235.0 (160.2–309.8) | ||
| Disseminated NTMb | Hospitalization rate | 392.8 (305.1–480.4) | 314.8 (268.0–361.5) | 304.7 (258.2–351.2) | 280.3 (242.4–318.3) | 240.8 (203.0–278.6) | 168.5 (141.1–195.8) | 162.4 (137.2–187.6) | 152.9 (127.6–178.2) | <.001 |
| Estimated No. of hospitalizations | 3338.5 (2593.6–4083.4) | 2755.0 (2345.8–3164.2) | 2740.0 (2322.0–3158.0) | 2590.0 (2239.5–2940.5) | 2285.0 (1926.2–2643.8) | 1640.0 (1373.8–1906.2) | 1620.0 (1368.9–1871.1) | 1560.0 (1301.8–1818.2) | ||
| Mortality rate | 25.2 (15.0–35.4) | 13.1 (7.8–18.5) | 16.7 (10.3–23.0) | 18.4 (12.2–24.6) | 14.2 (8.7–19.8) | 9.8 (5.4–14.1) | 11.5 (6.8–16.2) | 8.3 (4.4–12.3) | <.001 | |
| Estimated No. of deaths | 214.1 (127.5–300.7) | 115.0 (68.1–161.9) | 150.0 (92.9–207.1) | 170.0 (113.1–226.9) | 135.0 (82.3–187.7) | 95.0 (52.3–137.7) | 115.0 (68.1–161.9) | 85.0 (44.7–125.3) | ||
| Cryptococcosis | Hospitalization rate | 246.3 (186.6–306.0) | 230.2 (197.4–263.1) | 228.0 (193.6–262.3) | 221.3 (188.5–254.1) | 216.0 (185.0–247.1) | 201.8 (172.7–231.0) | 163.9 (138.5–189.4) | 182.3 (155.1–209.5) | <.001 |
| Estimated No. of hospitalizations | 2093.4 (1585.8–2601.0) | 2015.0 (1727.5–2302.5) | 2050.0 (1741.1–2358.9) | 2045.0 (1741.9–2348.1) | 2050.0 (1755.4–2344.6) | 1965.0 (1681.2–2248.8) | 1635.0 (1381.3–1888.7) | 1860.0 (1582.6–2137.4) | ||
| Mortality rate | 20.1 (13.1–27.1) | 18.9 (12.4–25.3) | 21.1 (13.9–28.3) | 18.9 (12.3–25.5) | 20.0 (13.2–26.9) | 19.5 (12.9–26.2) | 10.5 (5.4–15.6) | 14.2 (8.9–19.5) | .006 | |
| Estimated No. of deaths | 170.8 (111.1–230.5) | 165.0 (108.9–221.1) | 190.0 (125.1–254.9) | 175.0 (114.0–236.0) | 190.0 (125.1–254.9) | 190.0 (125.3–254.7) | 105.0 (54.1–155.9) | 145.0 (90.6–199.4) | ||
| Tuberculosis, any | Hospitalization rate | 155.2 (111.0–199.3) | 151.4 (118.4–184.4) | 126.2 (101.9–150.5) | 119.6 (97.1–142.1) | 105.9 (86.8–125.0) | 104.3 (85.5–123.0) | 108.3 (88.6–127.9) | 99.0 (80.0–117.9) | <.001 |
| Estimated No. of hospitalizations | 1318.9 (943.5–1694.2) | 1325.0 (1036.4–1613.6) | 1135.0 (916.8–1353.2) | 1105.0 (896.9–1313.1) | 1005.0 (823.4–1186.6) | 1015.0 (832.6–1197.4) | 1080.0 (884.0–1276.0) | 1010.0 (816.6–1203.4) | ||
| Mortality rate | 7.7 (3.4–12.1) | 8.0 (3.8–12.2) | 5.6 (1.2–9.9) | 4.9 (1.7–8.1) | 5.3 (2.0–8.5) | 6.2 (2.4–9.9) | 4.0 (1.2–6.8) | 2.0 (0.0–3.9) | <.001 | |
| Estimated No. of deaths | 65.8 (28.6–103.1) | 70.0 (33.3–106.7) | 50.0 (10.8–89.2) | 45.0 (15.6–74.4) | 50.0 (19.0–81.0) | 60.0 (23.3–96.7) | 40.0 (12.3–67.7) | 20.0 (0.4–39.6) | ||
| Histoplasmosis | Hospitalization rate | 77.3 (47.3–107.4) | 88.5 (61.6–115.5) | 66.7 (44.1–89.3) | 65.5 (48.4–82.6) | 66.4 (49.0–83.7) | 70.9 (53.8–87.9) | 62.7 (45.6–79.7) | 61.2 (46.1–76.3) | .04 |
| Estimated No. of hospitalizations | 657.3 (401.9–912.6) | 775.0 (539.1–1010.9) | 600.0 (396.9–803.1) | 605.0 (446.9–763.1) | 630.0 (465.3–794.7) | 690.0 (523.8–856.2) | 625.0 (454.6–795.4) | 625.0 (470.9–779.1) | ||
| Mortality rate | 7.5 (3.1–11.8) | 4.6 (1.4–7.7) | 2.8 (0.3–5.2) | 4.3 (1.3–7.3) | 3.7 (1.0–6.4) | 2.6 (0.3–4.8) | 3.5 (0.9–6.1) | 4.4 (1.5–7.3) | .048 | |
| Estimated No. of deaths | 63.5 (26.2–100.7) | 40.0 (12.3–67.7) | 25.0 (3.1–46.9) | 40.0 (12.3–67.7) | 35.0 (9.1–60.9) | 25.0 (3.1–46.9) | 35.0 (9.1–60.9) | 45.0 (15.6–74.4) |
Abbreviations: CMV, cytomegalovirus; NTM, nontuberculous mycobacteria; OI, opportunistic infection; PWH, people with human immunodeficiency virus.
aRates are calculated as age-adjusted, weighted events per 100 000 PWH-years (95% CI).
bDisseminated or extrapulmonary.
The estimated annual rates of US in-hospital mortality for HIV-related OIs decreased from 161.3 (95% CI, 126.5–196.0) per 100 000 PWH-years in 2011 to 96.5 (95% CI, 81.5–111.6) in 2018 (Table 5) with significant decline over time (P < .001). Two OI-related mortality rates were not declining over time. CMV had in 2018 an estimated US in-hospital mortality rate of 23.0 (95% CI, 15.7–30.4) (P = .08). Esophageal candidiasis was 19.1 (95% CI, 12.8–25.4) in 2018 (P = .06). All other individual OI-related US in-hospital mortality rates were declining. PJP decreased from 77.9 (95% CI, 57.6–98.3) in 2011 to 43.6 (95% CI, 34.4–52.8) in 2018 (P < .001), disseminated NTM from 25.2 (95% CI, 15.0–35.4) to 8.3 (95% CI, 4.4–12.3) (P < .001), extrapulmonary cryptococcosis from 20.1 (95% CI, 13.1–27.1) to 14.2 (95% CI, 8.9–19.5) (P = .006), any form of active tuberculosis from 7.7 (95% CI, 3.4–12.1) to 2.0 (95% CI, 0.0–3.9) (P < .001), and histoplasmosis from 7.5 (95% CI, 3.1–11.8) to 4.4 (95% CI, 1.5–7.3) (P = .048) (Figure 2).
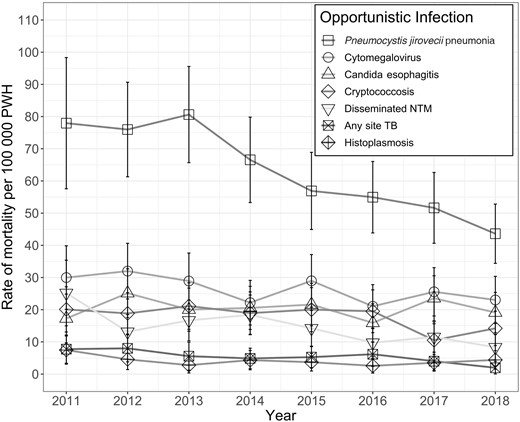
Annual rates of in-hospital mortality with HIV-related opportunistic infections, United States, 2011–2018 (estimated rate, 95% CI). Abbreviations: CI, confidence interval; HIV, human immunodeficiency virus; NTM, nontuberculous mycobacteria; PWH, people with human immunodeficiency virus; TB, tuberculosis.
DISCUSSION
For OI-related hospitalizations among PWH, we found a considerable reduction in the national hospitalization rate and in-hospital mortality rate per 100 000 PWH, which demonstrates a large stride toward one of the National HIV/AIDS Strategy's (NHAS) core goals of improving health outcomes of PWH [9]. Reduction in OI occurrence is consistent with previously reported cohort studies [11–15], but any presentation with an OI is late in the course of HIV and signifies a failure along the HIV care continuum [9]. The reduction in OI-related hospitalizations over time likely reflects the corresponding national improvement in the percentage of PWH aware of HIV status, linkage to care, initiation of ART, and viral suppression rates [7, 8]. Because HIV-related OIs are preventable in most cases with starting highly effective ART promptly [5], it should be a national goal to have OI-related hospitalizations approach zero. Based on what we found, there is still much work to do.
We found a significantly higher OI hospitalization rate of 1947.3 per 100 000 PWH or 1.9 per 100 PWH in 2015 compared with the recently published North American AIDS Cohort Collaboration on Research and Design AIDS-defining illness hospitalization rate of 0.5 per 100 PWH in 2015 for a cohort that was engaged in care [17]. OI hospitalizations are a subset of AIDS-defining illness hospitalizations, so one would expect these hospitalization rates to be higher than for OIs. This may be due to research cohorts accessing care more than many PWH in the US.
Though the mortality rate for OI-related hospitalizations per 100 000 PWH in the US was declining, there was not a mortality reduction among PWH hospitalized with an OI. Among PWH hospitalized with an OI, the percentage of in-hospital mortality was stable at 5.9% in 2011 and 2018. The year of hospitalization was not associated with OI-related mortality among hospitalized PWH while controlling for US census region and sociodemographic factors. Though we did find a 40.1% reduction for OI-related in-hospital mortality rate per 100 000 PWH in the US, this is due in part to a concomitant 39.5% reduction in overall hospitalization rate for HIV-related OIs. Both of these findings would be expected with an overall national improvement in early HIV diagnoses and viral suppression for 2011 to 2018 [8]. But even though OIs are occurring less frequently overall, treatment outcomes for PWH hospitalized with an OI are not improving. Reasons for this stagnation may include late presentation with severe disease, a delay in recognition of OIs among hospitalized PWH, lack of availability of advanced diagnostics for OIs, limited access to infectious diseases or HIV experts, or a need for optimization of current OI treatment and prophylaxis guidelines for different subpopulations [5].
We found several notable sociodemographic differences concerning for systemic inequity that are consistent with findings in the most recent CDC surveillance report [8]. Younger and male PWH are known to have the lowest rate of knowing about their HIV diagnosis, linkage to HIV care, and viral suppression [8], and we found that they have a higher risk of being hospitalized for an OI compared with being hospitalized without an OI. Older and male PWH had the highest risk of in-hospital mortality, perhaps due to higher number of medical comorbidities or higher rates of multimorbidity [18]. Non-White race/ethnicity groups had a higher risk of being hospitalized for an OI than hospitalized White PWH, with the highest risk among AAPI and Hispanic PWH. Presentation with AIDS at first time of HIV diagnosis in 2018 was known to be highest for AAPI (23.8%–26.0%) and Hispanic (21.6%) PWH [8]. Therefore, improving HIV testing strategies for these race/ethnicity subgroups and focusing on timely diagnosis may have the biggest impact on reducing OI hospitalizations.
We found that PWH without health insurance were most likely to be hospitalized and experience in-hospital mortality. This finding is consistent with reports from the Institute of Medicine that being uninsured is directly linked with higher mortality, especially for PWH [19]. These findings further contribute to the evidence that PWH in the US benefit from having health insurance, such as through Medicaid expansion throughout the US and health insurance purchased by AIDS drug assistance programs [20]. The total charges for OI-related hospitalizations were nearly double than for PWH without an OI and the in-hospital mortality group had >5 times the cost of hospitalization. This study also provides important economic data that can be used in HIV-related economic models [21, 22]. It demonstrates the costs that could be averted if PWH are diagnosed earlier, if those engaged in care are offered OI prophylaxis as recommended, and the critical importance of federal and state-funded initiatives that provide interdisciplinary care for PWH engaged in care [9]. More research is needed to examine factors that contribute to geographic disparities. The highest burden of OI-related hospitalizations was in the South, possibly due to less prevalent Medicaid coverage expansion [23].
All individual OI hospitalization rates were declining similarly to the total rate decline, likely contributed in part due to implementation of medical prophylaxis for PJP for those with AIDS and recommended screening for latent tuberculosis among all PWH [5]. The in-hospital mortality rates with diagnoses of CMV disease and esophageal candidiasis were not declining. CMV disease is most often diagnosed by clinical recognition rather than a standardized screening [5]. No medical prophylaxis is recommended [5]. The CMV hospitalization rate is declining similarly to the national reduction of aggregate OIs, but the stable mortality rate over time may indicate that people are presenting with severe disease or that clinical recognition is currently not adequate.
Our study is the first in over a decade to quantify hospitalization and mortality rates for HIV-related OIs in the US. Our work identifies key areas for improvement among hospitalized PWH when it comes to OI prevention and treatment for certain subgroups of PWH experiencing potential disparities in OI-related hospitalizations and mortality. Some limitations of our study include that the available data did not contain sex, sexual identity, HIV acquisition risk group, homelessness, clinical or laboratory markers of disease severity, ART prescription prior to hospitalization, or timing of HIV diagnosis in relation to hospitalization. Also, inability to control for repeat hospitalizations results in an overall OI hospitalization rate rather than a risk of hospitalization for an individual PWH. The use of ICD discharge codes to identify OI hospitalizations for PWH requires explicit designation by a clinician. This may not capture all hospitalizations for people with HIV or all OIs.
HIV-related OI hospitalization rates may be used as a proxy measure for national surveillance and treatment outcomes for PWH who are engaged and not engaged with care. The disparities in these rates reveal high-value areas for financial and labor investment to best meet the goals of the NHAS and to work toward health equity in HIV care. Some potential interventions to reduce OI-related hospitalizations and related mortality among vulnerable sociodemographic subgroups include increasing of health insurance coverage for PWH (including expanding Medicaid throughout the US) [23], differentiated and innovative HIV care [24], reconsideration of prophylactic guidelines among subgroups at highest risk of mortality, and the training, recruitment, and retention of more HIV clinicians.
Supplementary Data
Supplementary materials are available at Clinical Infectious Diseases online. Consisting of data provided by the authors to benefit the reader, the posted materials are not copyedited and are the sole responsibility of the authors, so questions or comments should be addressed to the corresponding author.
Notes
Author Contributions. C. B.: Conceptualization, formal analysis, methodology, software, visualization, writing–original draft, writing–review and editing. A. S.: Methodology, software, writing–review and editing. S. G.: Methodology, software, writing–review and editing. T. M.: Methodology, software, writing–review and editing. K. A. M.: Conceptualization, resources, methodology, software, supervision, writing–review and editing.
Data sharing. The data used in this study are a publicly available data set (https://hcup-us.ahrq.gov/nisoverview.jsp) with a publicly available data dictionary. It is available through a data use agreement with the Agency for Healthcare Research and Quality's Healthcare Cost and Utilization Project.
Financial support. This work was supported by the National Institute of Allergy and Infectious Diseases at the National Institutes of Health (grant numbers T32 AI007046 to C. B.; K08AI136644 and R01AI170093 to K. A. M.).
References
Author notes
Potential conflicts of interest. K. A. M. reports an unrelated previous investigator-initiated grant from Gilead Sciences Inc; honoraria from MedPage Today and eHIV Review; leadership role as current Chair of the Advisory Committee to the Virginia Medication Assistance Program and previous Co-chair of the Ryan White Medical Providers Coalition Steering Committee; and previous stock ownership in Gilead Sciences Inc. All other authors report no potential conflicts.
All authors have submitted the ICMJE Form for Disclosure of Potential Conflicts of Interest. Conflicts that the editors consider relevant to the content of the manuscript have been disclosed.

